| Param | Original file | Final file |
|---|---|---|
| Filename | modeM0/AS1G08_057T09_9000002174_14699cztM0_level2.evt | modeM0/AS1G08_057T09_9000002174_14699cztM0_level2_quad_clean.evt |
| Size (bytes) | 952,364,160 | 143,697,600 |
| Size | 908.2 MB | 137.0 MB |
| Events in quadrant A | 6,165,685 | 886,445 |
| Events in quadrant B | 6,890,795 | 877,054 |
| Events in quadrant C | 9,215,447 | 855,210 |
| Events in quadrant D | 5,718,964 | 862,603 |
| Mode SS | |||
|---|---|---|---|
| Quadrant | BADHDUFLAG | Total packets | Discarded packets |
| A | 0 | 254 | 0 |
| B | 0 | 254 | 0 |
| C | 0 | 254 | 0 |
| D | 0 | 254 | 0 |
| Mode M0 | |||
|---|---|---|---|
| Quadrant | BADHDUFLAG | Total packets | Discarded packets |
| A | 0 | 26287 | 3 |
| B | 0 | 28602 | 2 |
| C | 0 | 37324 | 2 |
| D | 0 | 26059 | 2 |
| Mode M9 | |||
|---|---|---|---|
| Quadrant | BADHDUFLAG | Total packets | Discarded packets |
| A | 0 | 14 | 0 |
| B | 0 | 14 | 0 |
| C | 0 | 14 | 0 |
| D | 0 | 14 | 0 |
| Quadrant | Total seconds | Saturated seconds | Saturation percentage |
|---|---|---|---|
| A | 12601 | 114 | 0.904690% |
| B | 12601 | 507 | 4.023490% |
| C | 12601 | 110 | 0.872947% |
| D | 12601 | 67 | 0.531704% |
Noise dominated data is calculated using 1-second bins in cleaned event files. If a bin has >2000 counts, and if more than 50% of those come from <1% of pixels, then it is considered to be noise-dominated and hence unusable.
| Quadrant | # 1 sec bins | Bins with >0 counts | Bins with >2000 counts | High rate bins dominated by noise | Noise dominated (total time) | Noise dominated (detector-on time) | Marked lightcurve |
|---|---|---|---|---|---|---|---|
| A | 13922 | 12602 | 5 | 5 | 0.04% | 0.04% | 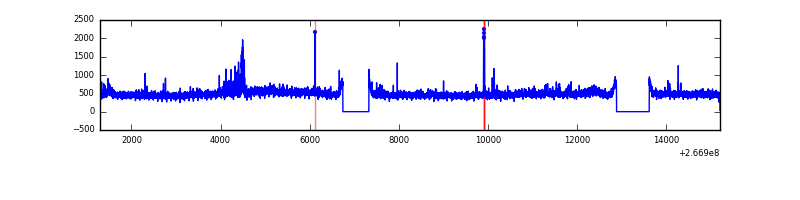 |
| B | 13922 | 12602 | 370 | 370 | 2.66% | 2.94% | 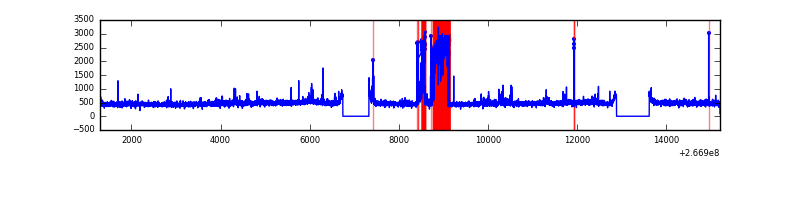 |
| C | 13922 | 12603 | 0 | 0 | 0.00% | 0.00% | 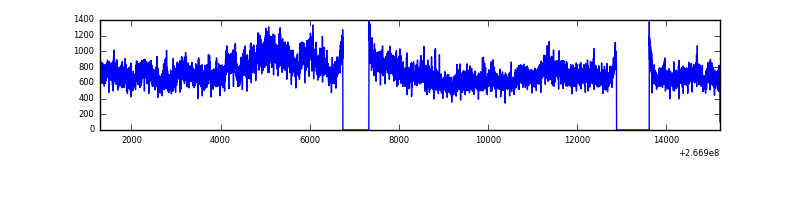 |
| D | 13922 | 12603 | 11 | 11 | 0.08% | 0.09% | 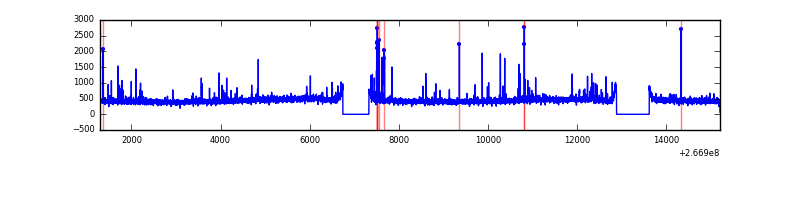 |
Top three noisy pixels from each quadrant. If the there are fewer than three noisy pixels in the level2.evt file, extra rows are filled as -1
| Pixel properties | Quadrant properties | ||||||
|---|---|---|---|---|---|---|---|
| Quadrant | DetID | PixID | Counts | Sigma | Mean | Median | Sigma |
| A | 12 | 189 | 207248 | 691.67 | 1488 | 1455 | 297.5 |
| A | 8 | 15 | 177147 | 590.5 | 1488 | 1455 | 297.5 |
| A | 11 | 29 | 19848 | 61.82 | 1488 | 1455 | 297.5 |
| B | 10 | 16 | 1063886 | 3788.98 | 1459 | 1419 | 280.4 |
| B | 0 | 205 | 38578 | 132.52 | 1459 | 1419 | 280.4 |
| B | 12 | 111 | 33414 | 114.1 | 1459 | 1419 | 280.4 |
| C | 3 | 233 | 3568893 | 10699.32 | 1435 | 1440 | 333.4 |
| C | 3 | 234 | 36526 | 105.23 | 1435 | 1440 | 333.4 |
| C | 13 | 61 | 10405 | 26.89 | 1435 | 1440 | 333.4 |
| D | 12 | 110 | 156973 | 454.91 | 1441 | 1407 | 342.0 |
| D | 2 | 120 | 50030 | 142.19 | 1441 | 1407 | 342.0 |
| D | 2 | 234 | 49467 | 140.54 | 1441 | 1407 | 342.0 |
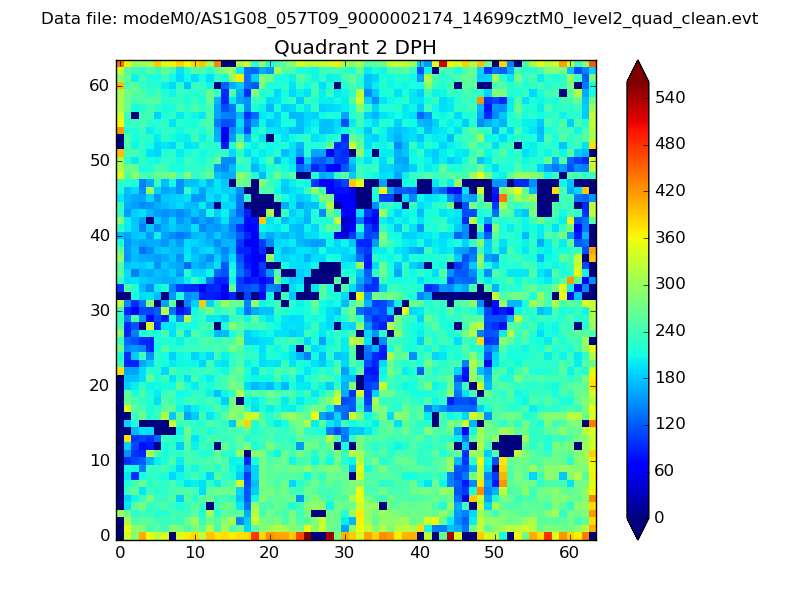
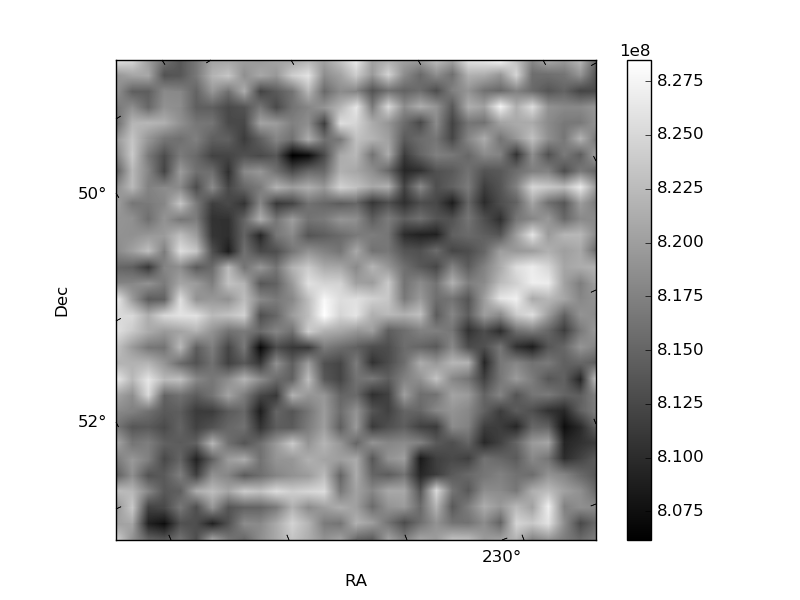
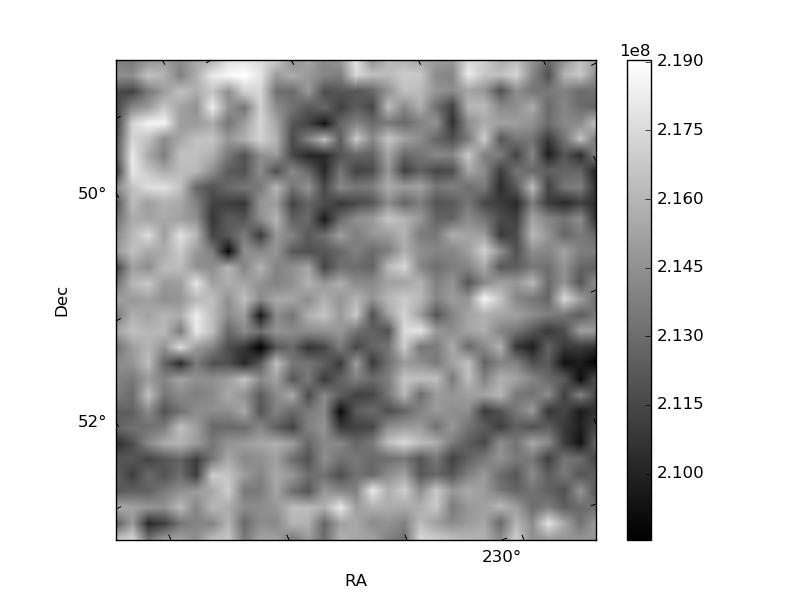
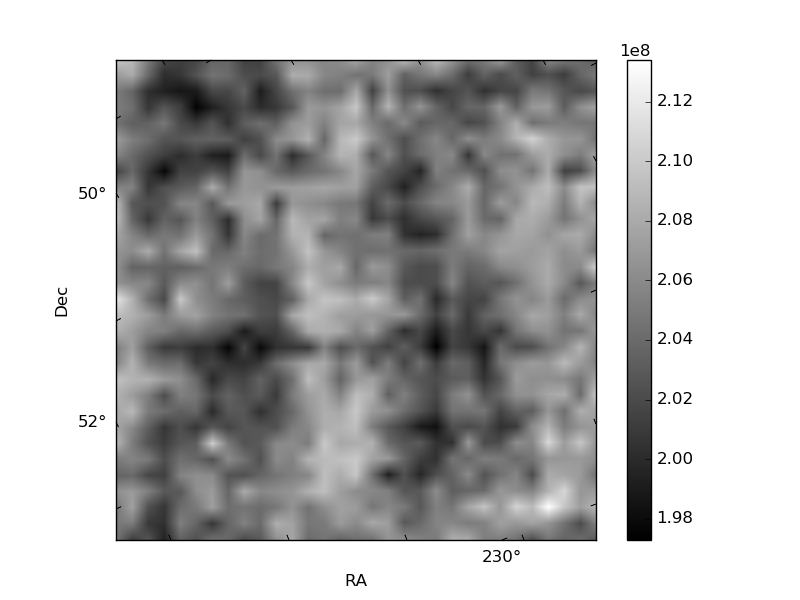
Histogram calculated using DETX and DETY for each event in the final _common_clean file
| Quadrant A | 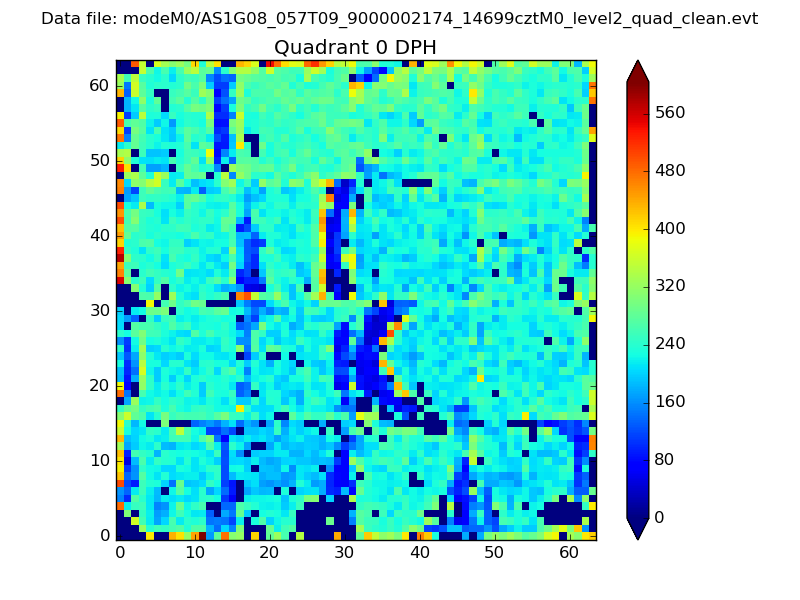 |
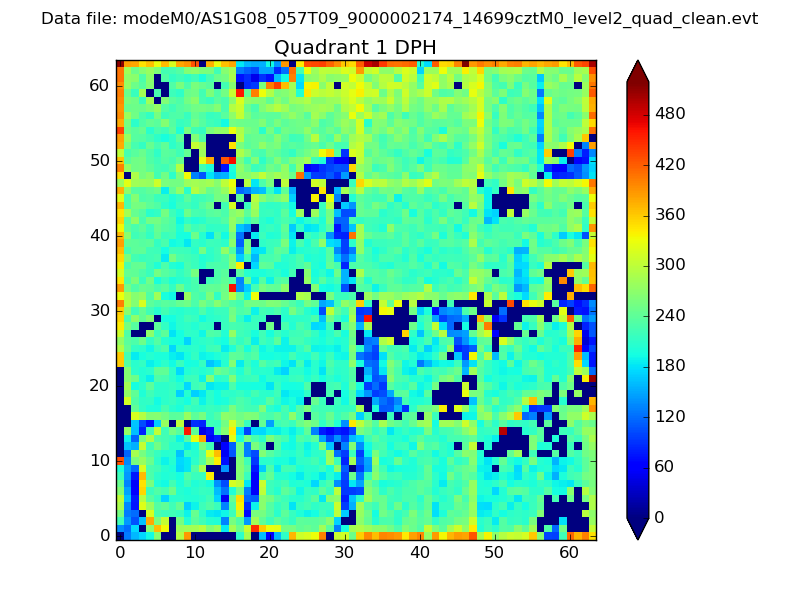 |
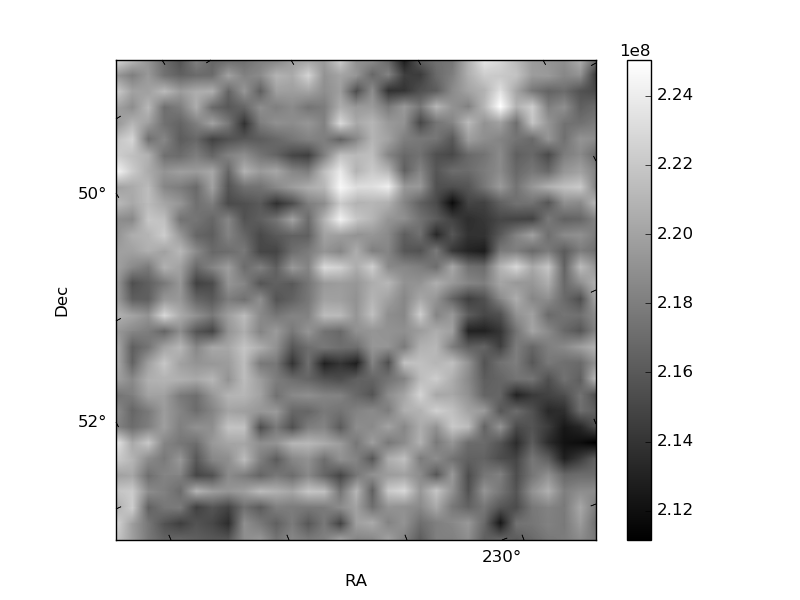
Quadrant B |
|---|---|---|---|
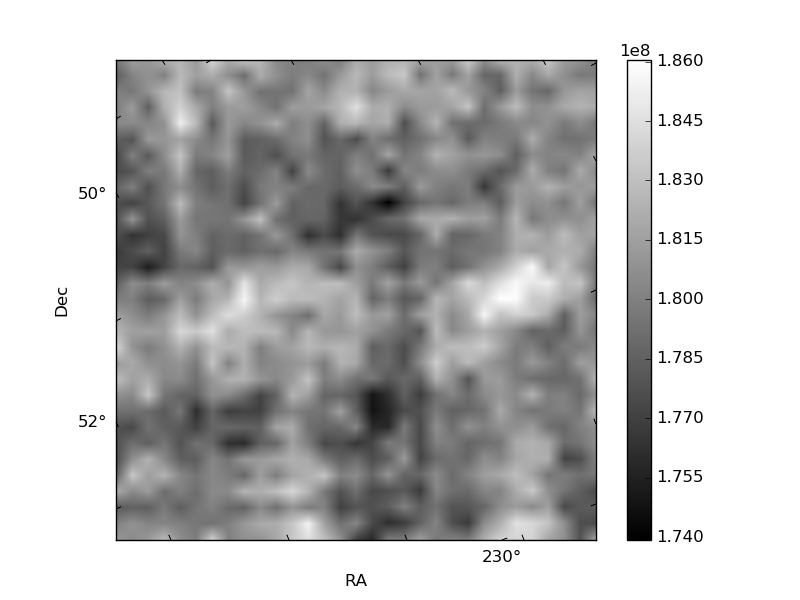
| Quadrant D | 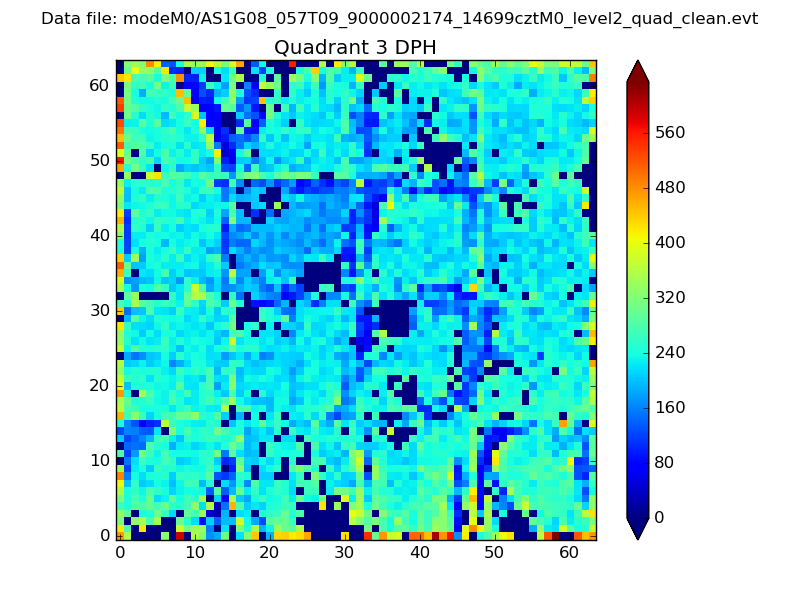 |
 |
Quadrant C |
| Plot type | Count rate plots | Images |
|---|---|---|
| Comparison with Poisson distribution Blue bars denote a histogram of data divided into 1 sec bins. Red curve is a Poisson curve with rate = median count rate of data. |
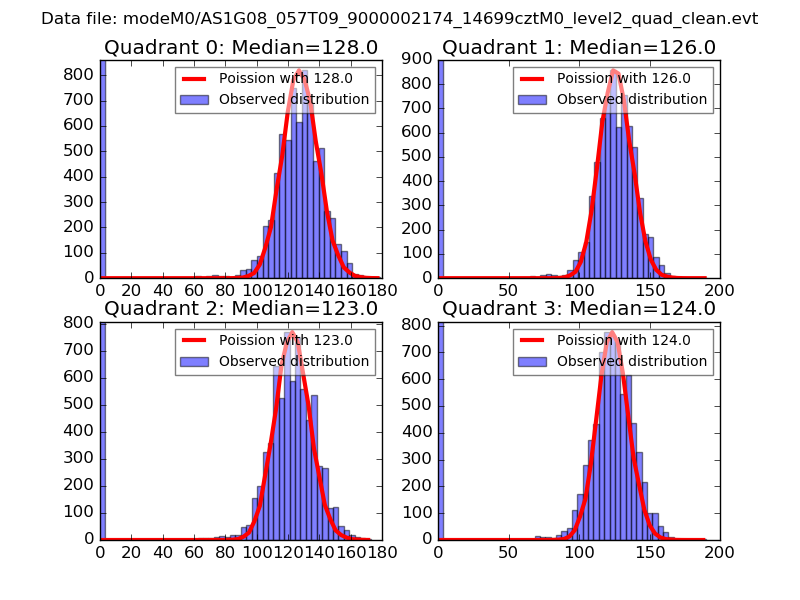 |
 |
| Quadrant-wise count rates Data is divided into 100 sec bins |
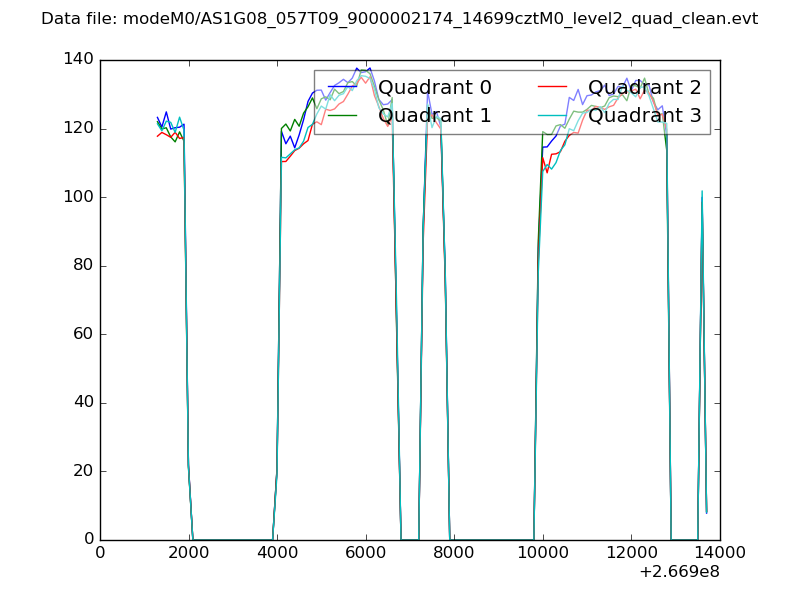 |
|
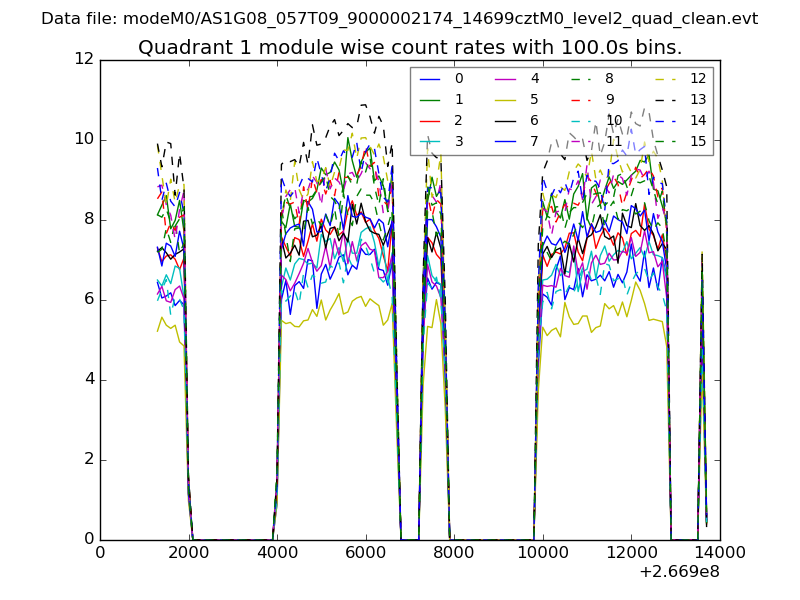
| Module-wise count rates for Quadrant A Data is divided into 100 sec bins |
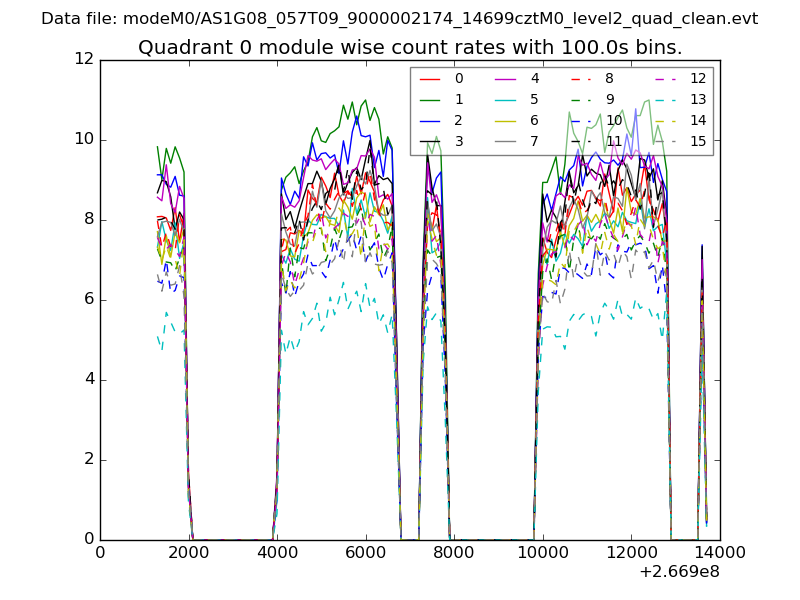 |
 |
| Module-wise count rates for Quadrant B Data is divided into 100 sec bins |
 |
 |
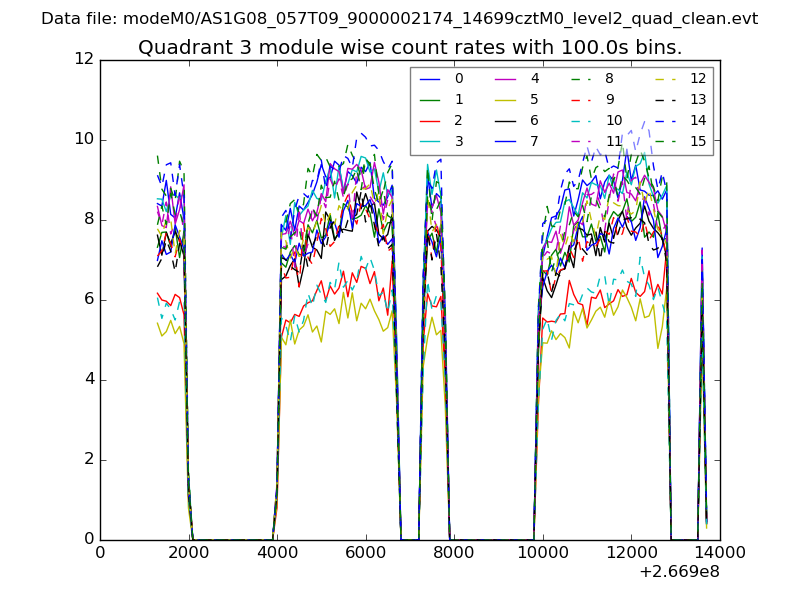
| Module-wise count rates for Quadrant C Data is divided into 100 sec bins |
 |
 |
| Module-wise count rates for Quadrant D Data is divided into 100 sec bins |
 |
 |
| Parameter | Plot |
|---|---|
| CZT HV Monitor | 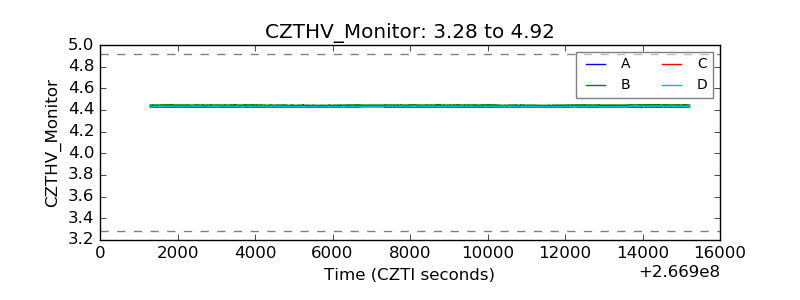 |
| D_VDD | 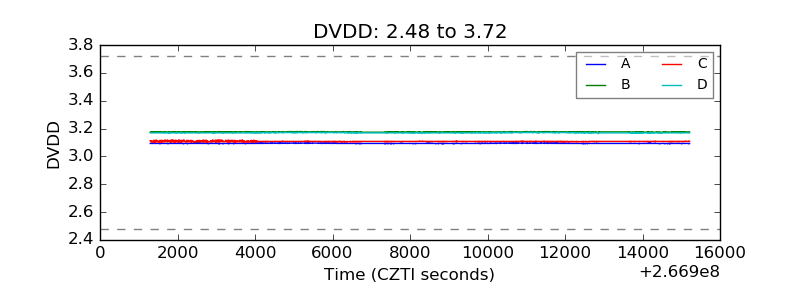 |
| Temperature 1 | 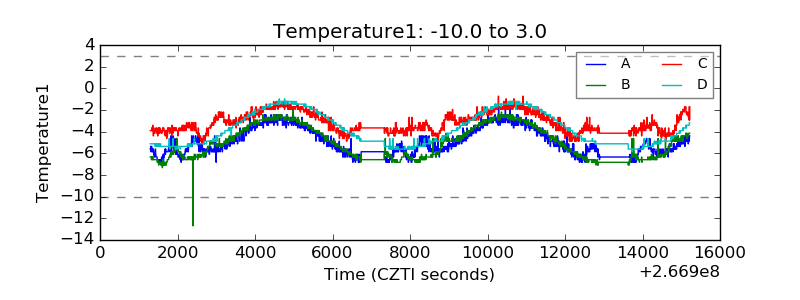 |
| Veto HV Monitor | 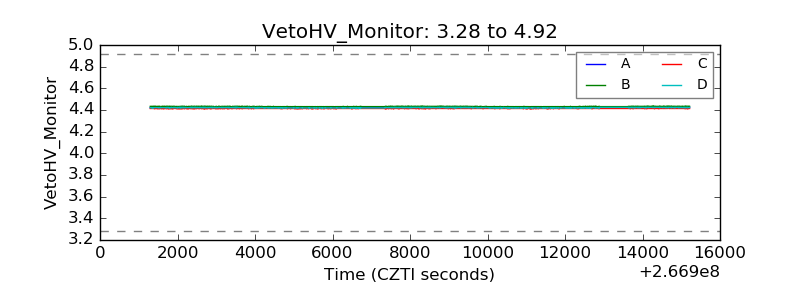 |
| Veto LLD | 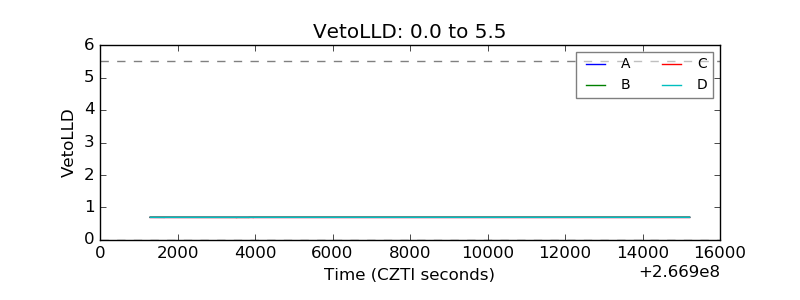 |
| Alpha Counter | 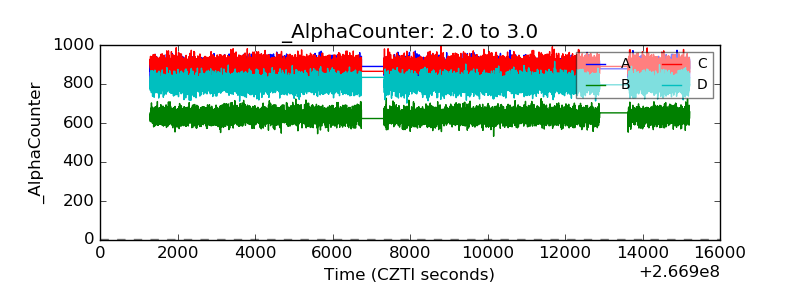 |
| _CPM_Rate |  |
| CZT Counter | 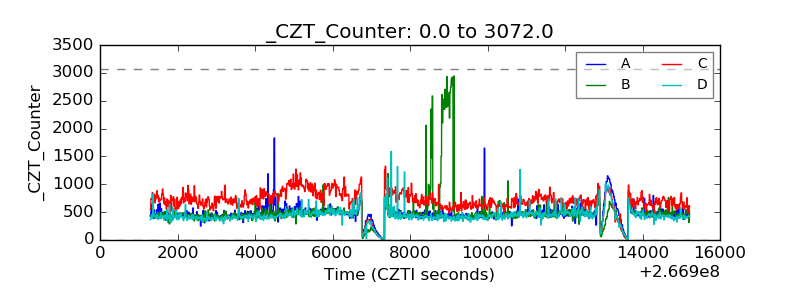 |
| +2.5 Volts monitor |  |
| +5 Volts monitor |  |
| _ROLL_ROT | 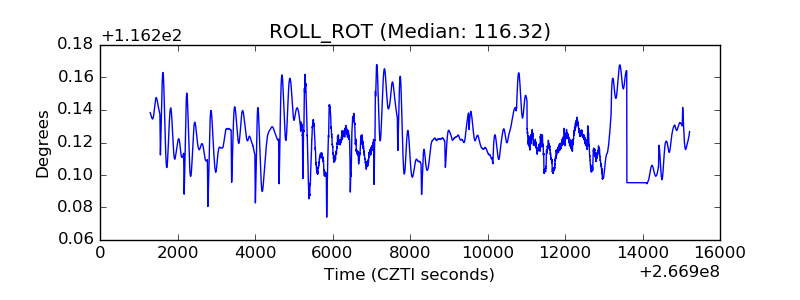 |
| _Roll_DEC | 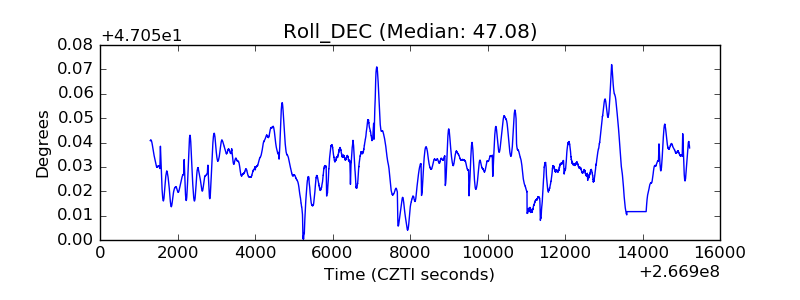 |
| _Roll_RA | 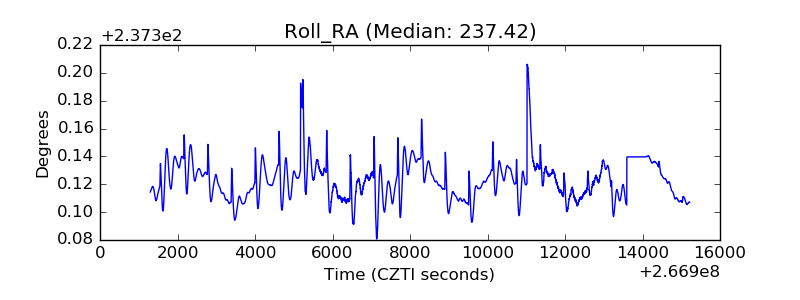 |
| Veto Counter | 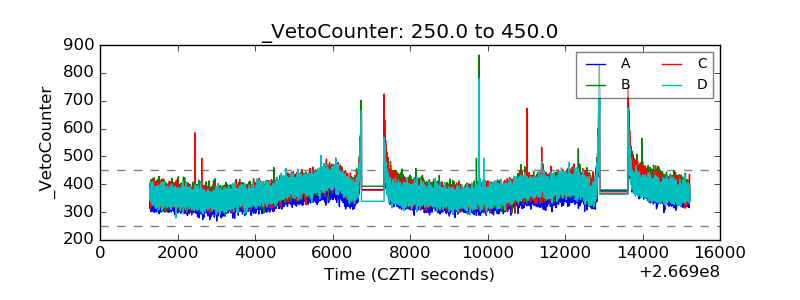 |