| Param | Original file | Final file |
|---|---|---|
| Filename | modeM0/AS1G08_057T09_9000002174_14700cztM0_level2.evt | modeM0/AS1G08_057T09_9000002174_14700cztM0_level2_quad_clean.evt |
| Size (bytes) | 491,584,320 | 70,482,240 |
| Size | 468.8 MB | 67.2 MB |
| Events in quadrant A | 3,299,894 | 424,187 |
| Events in quadrant B | 3,261,902 | 418,761 |
| Events in quadrant C | 4,702,651 | 408,168 |
| Events in quadrant D | 3,165,012 | 412,277 |
| Mode SS | |||
|---|---|---|---|
| Quadrant | BADHDUFLAG | Total packets | Discarded packets |
| A | 0 | 138 | 0 |
| B | 0 | 138 | 0 |
| C | 0 | 138 | 0 |
| D | 0 | 138 | 0 |
| Mode M0 | |||
|---|---|---|---|
| Quadrant | BADHDUFLAG | Total packets | Discarded packets |
| A | 0 | 13939 | 3 |
| B | 0 | 13894 | 2 |
| C | 0 | 19419 | 2 |
| D | 0 | 14093 | 2 |
| Mode M9 | |||
|---|---|---|---|
| Quadrant | BADHDUFLAG | Total packets | Discarded packets |
| A | 0 | 14 | 0 |
| B | 0 | 14 | 0 |
| C | 0 | 14 | 0 |
| D | 0 | 15 | 0 |
| Quadrant | Total seconds | Saturated seconds | Saturation percentage |
|---|---|---|---|
| A | 6749 | 68 | 1.007557% |
| B | 6749 | 80 | 1.185361% |
| C | 6749 | 60 | 0.889021% |
| D | 6749 | 57 | 0.844570% |
Noise dominated data is calculated using 1-second bins in cleaned event files. If a bin has >2000 counts, and if more than 50% of those come from <1% of pixels, then it is considered to be noise-dominated and hence unusable.
| Quadrant | # 1 sec bins | Bins with >0 counts | Bins with >2000 counts | High rate bins dominated by noise | Noise dominated (total time) | Noise dominated (detector-on time) | Marked lightcurve |
|---|---|---|---|---|---|---|---|
| A | 7685 | 6750 | 3 | 3 | 0.04% | 0.04% | 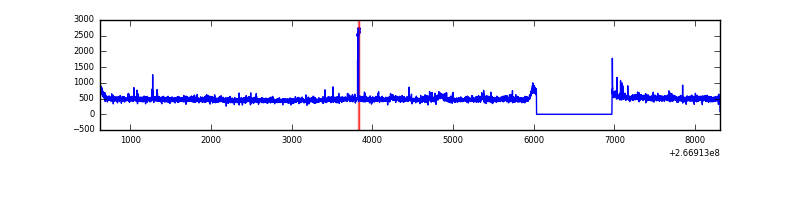 |
| B | 7685 | 6750 | 3 | 3 | 0.04% | 0.04% | 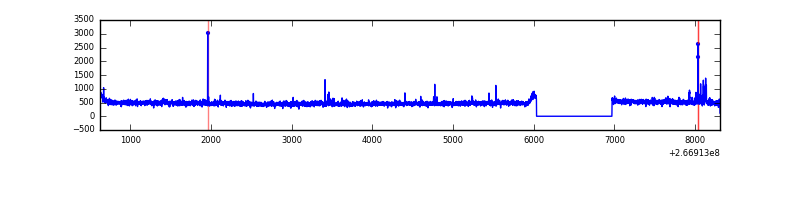 |
| C | 7685 | 6750 | 0 | 0 | 0.00% | 0.00% | 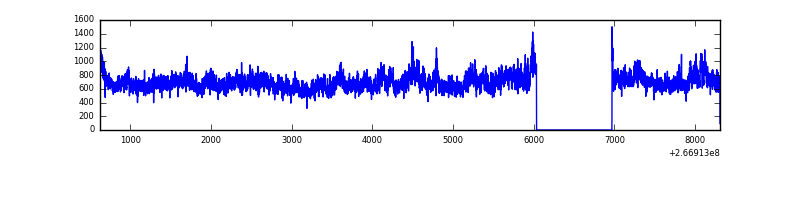 |
| D | 7685 | 6750 | 10 | 10 | 0.13% | 0.15% | 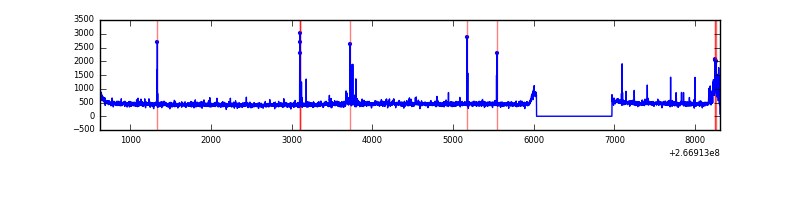 |
Top three noisy pixels from each quadrant. If the there are fewer than three noisy pixels in the level2.evt file, extra rows are filled as -1
| Pixel properties | Quadrant properties | ||||||
|---|---|---|---|---|---|---|---|
| Quadrant | DetID | PixID | Counts | Sigma | Mean | Median | Sigma |
| A | 8 | 15 | 63601 | 381.14 | 817 | 799 | 164.8 |
| A | 12 | 189 | 47499 | 283.41 | 817 | 799 | 164.8 |
| A | 3 | 1 | 24213 | 142.09 | 817 | 799 | 164.8 |
| B | 0 | 189 | 25800 | 159.92 | 813 | 792 | 156.4 |
| B | 0 | 214 | 23687 | 146.41 | 813 | 792 | 156.4 |
| B | 0 | 205 | 19787 | 121.47 | 813 | 792 | 156.4 |
| C | 3 | 233 | 1631826 | 8926.23 | 784 | 787 | 182.7 |
| C | 3 | 234 | 12433 | 63.74 | 784 | 787 | 182.7 |
| C | 13 | 61 | 5601 | 26.35 | 784 | 787 | 182.7 |
| D | 2 | 14 | 90352 | 476.87 | 789 | 768 | 187.9 |
| D | 2 | 120 | 34881 | 181.59 | 789 | 768 | 187.9 |
| D | 2 | 234 | 25164 | 129.87 | 789 | 768 | 187.9 |
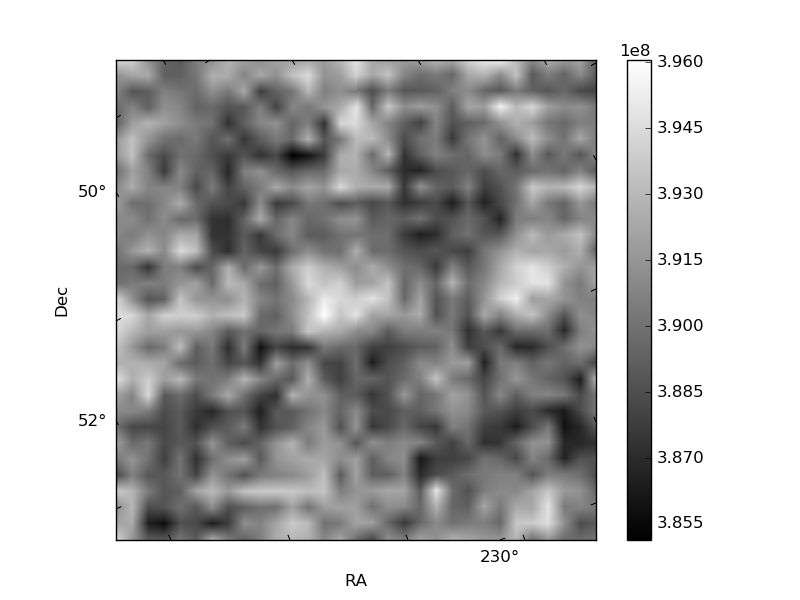
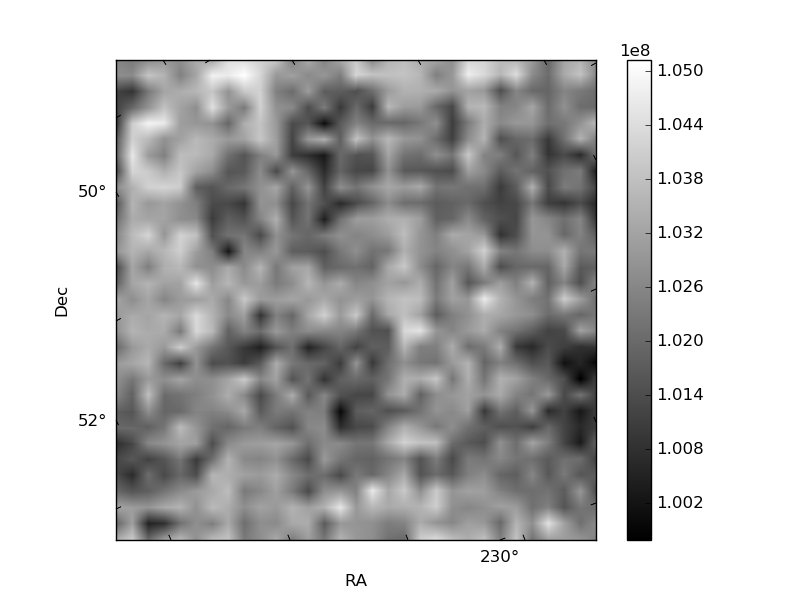
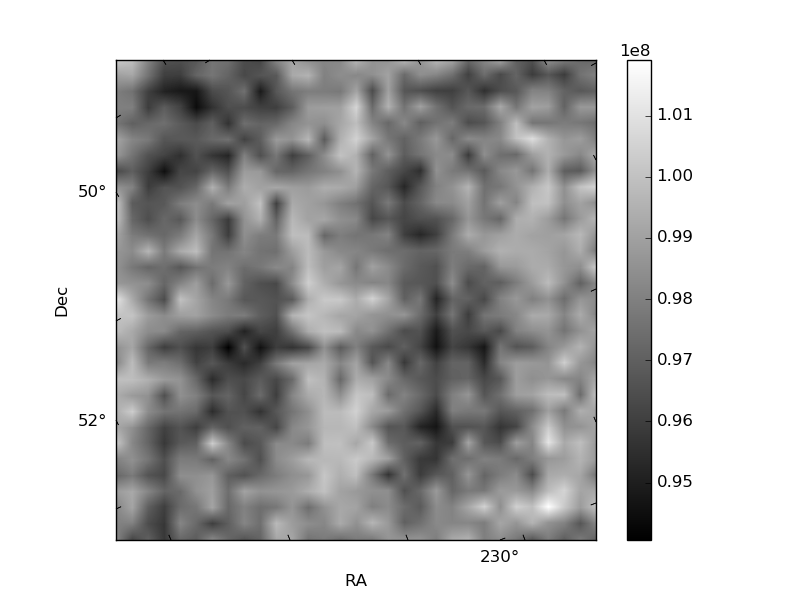
Histogram calculated using DETX and DETY for each event in the final _common_clean file
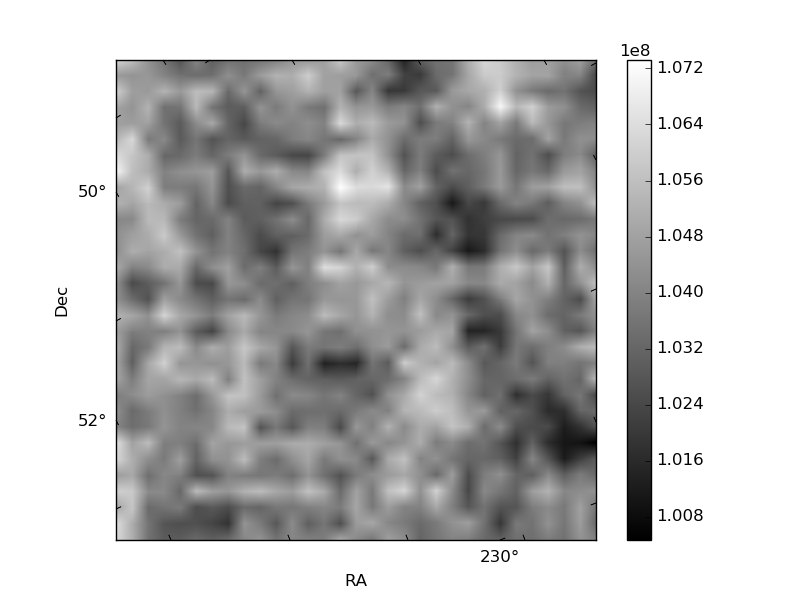
| Quadrant A |  |
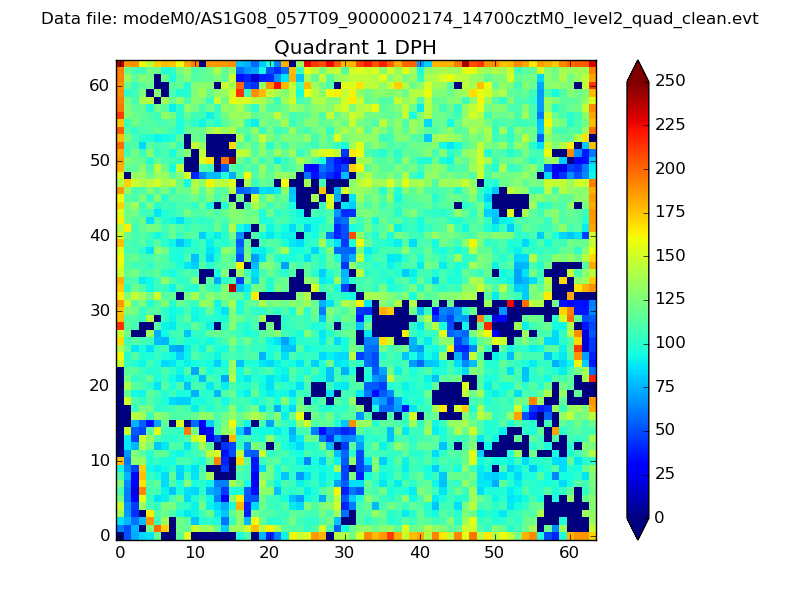 |
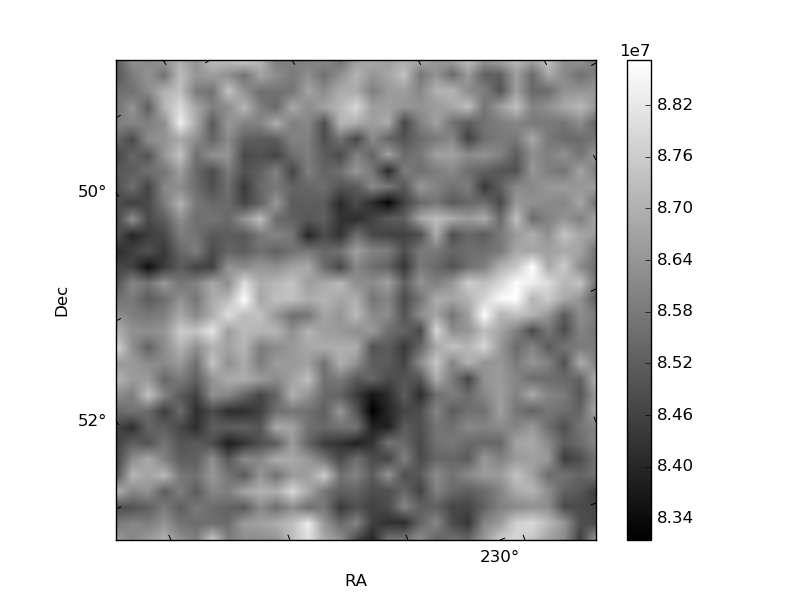
Quadrant B |
|---|---|---|---|
| Quadrant D | 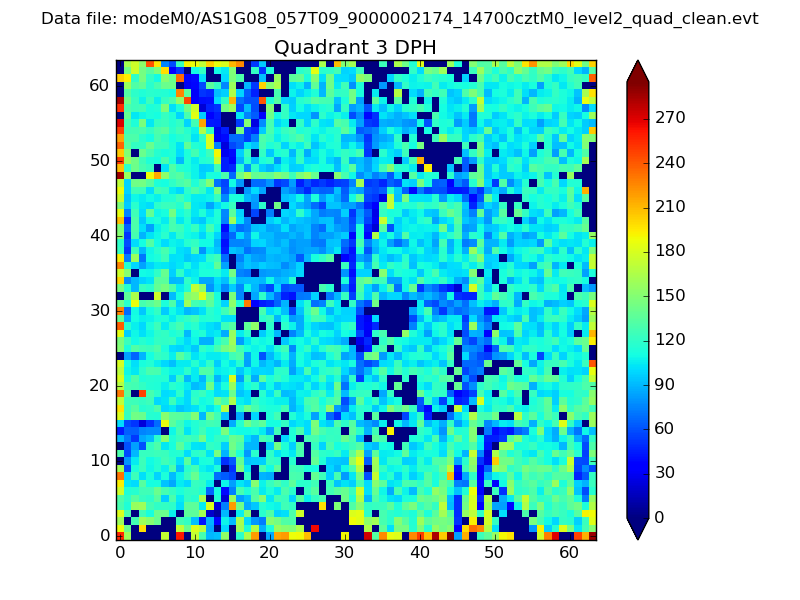 |
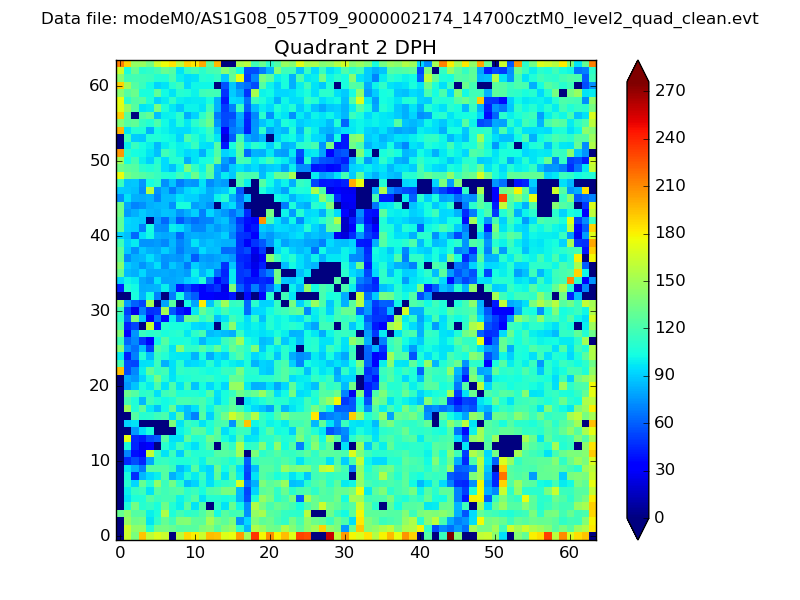 |
Quadrant C |
| Plot type | Count rate plots | Images |
|---|---|---|
| Comparison with Poisson distribution Blue bars denote a histogram of data divided into 1 sec bins. Red curve is a Poisson curve with rate = median count rate of data. |
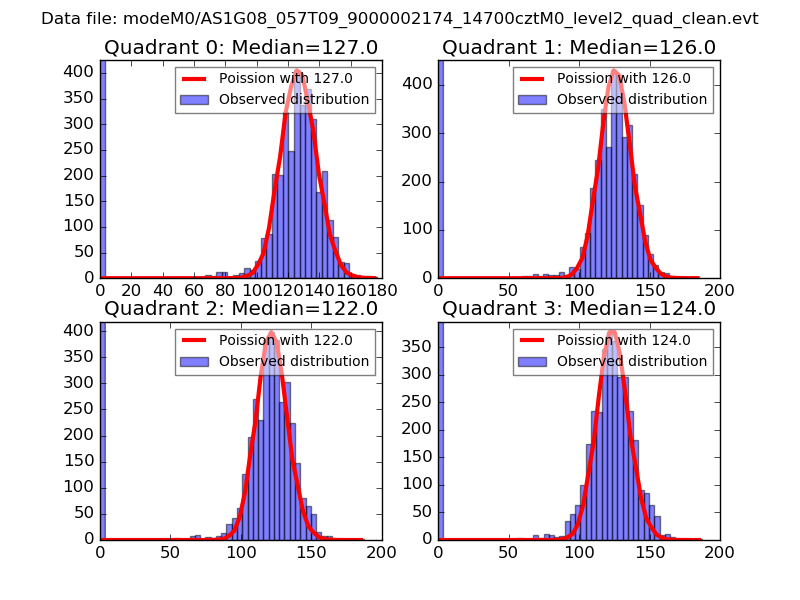 |
 |
| Quadrant-wise count rates Data is divided into 100 sec bins |
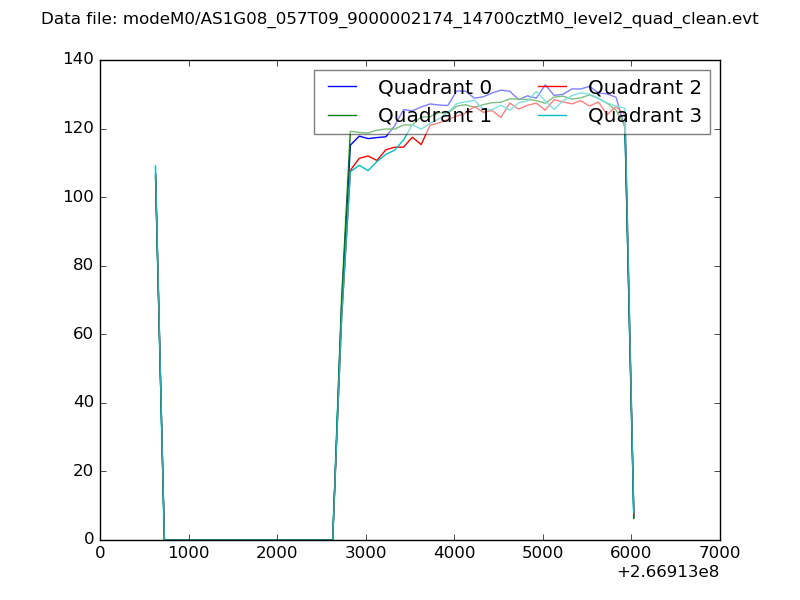 |
|
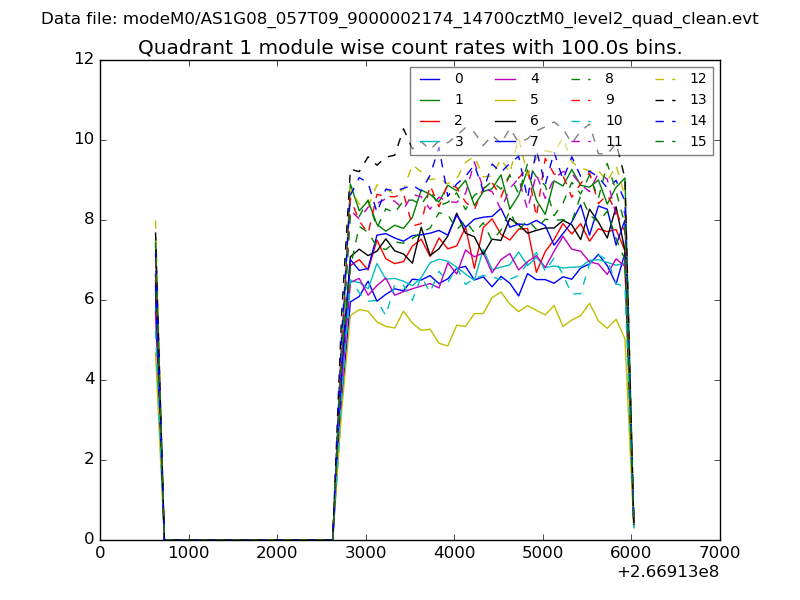
| Module-wise count rates for Quadrant A Data is divided into 100 sec bins |
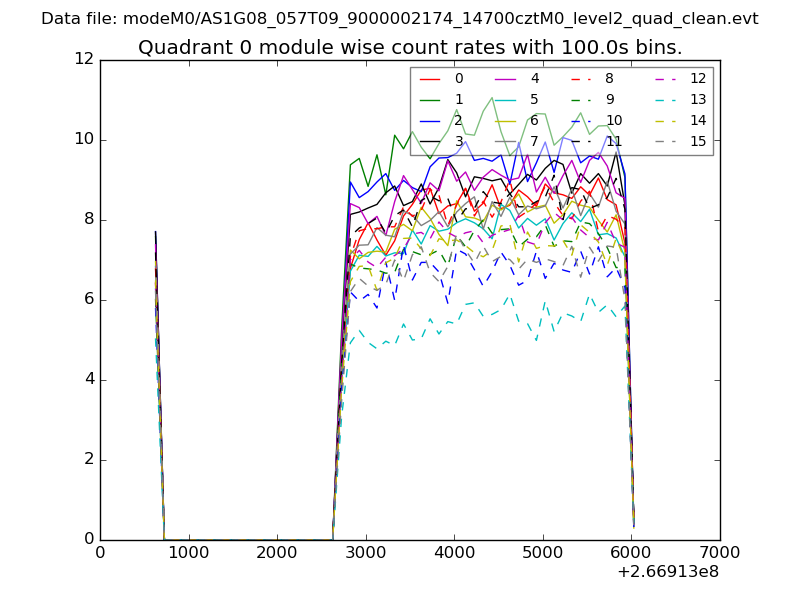 |
 |
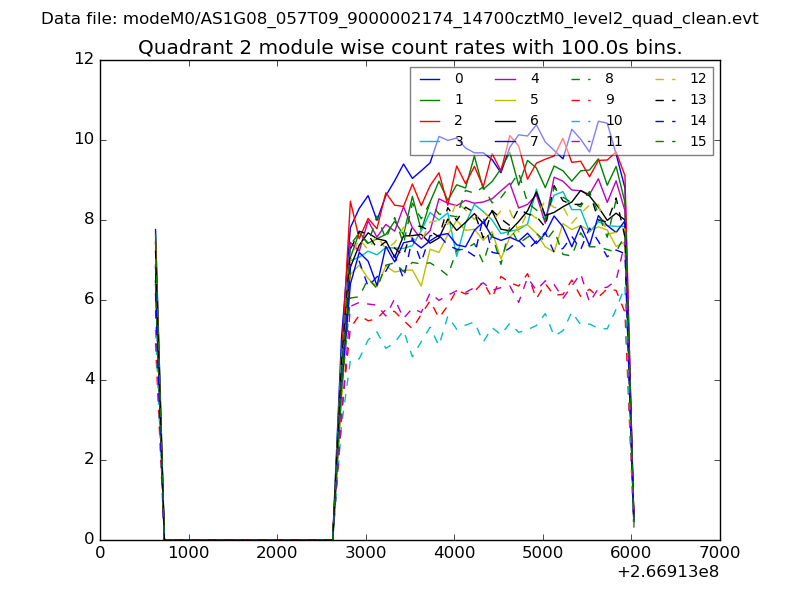
| Module-wise count rates for Quadrant B Data is divided into 100 sec bins |
 |
 |
| Module-wise count rates for Quadrant C Data is divided into 100 sec bins |
 |
 |
| Module-wise count rates for Quadrant D Data is divided into 100 sec bins |
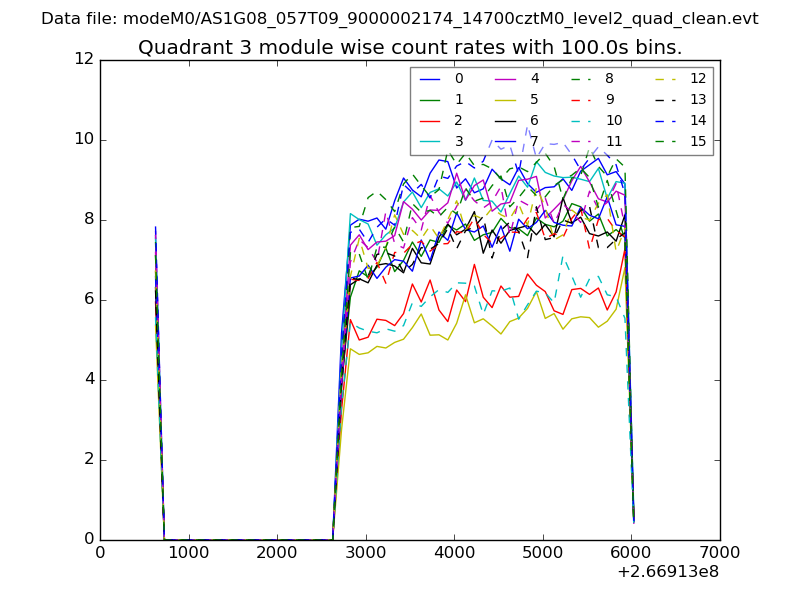 |
 |
| Parameter | Plot |
|---|---|
| CZT HV Monitor | 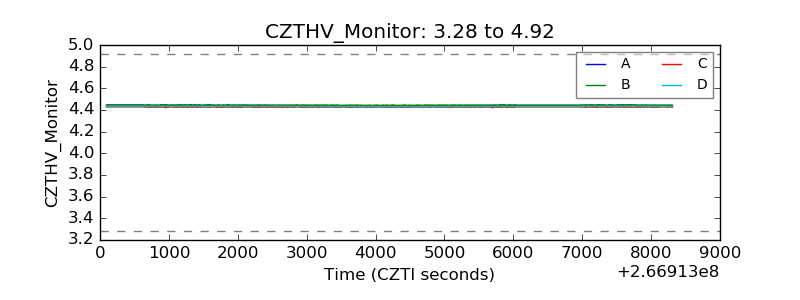 |
| D_VDD | 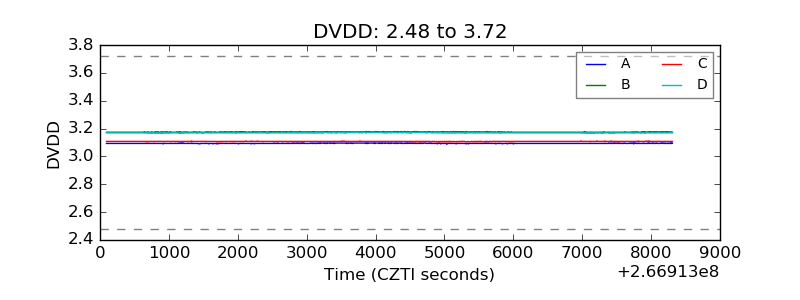 |
| Temperature 1 | 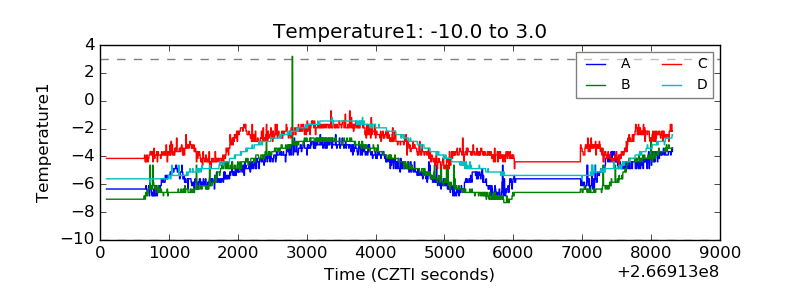 |
| Veto HV Monitor | 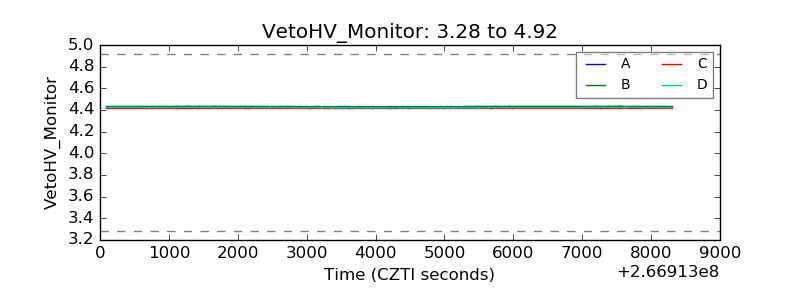 |
| Veto LLD | 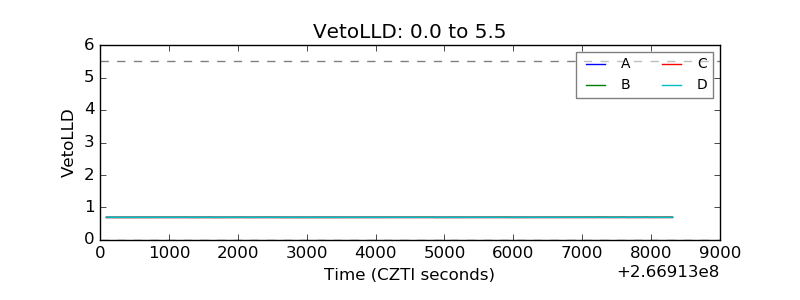 |
| Alpha Counter | 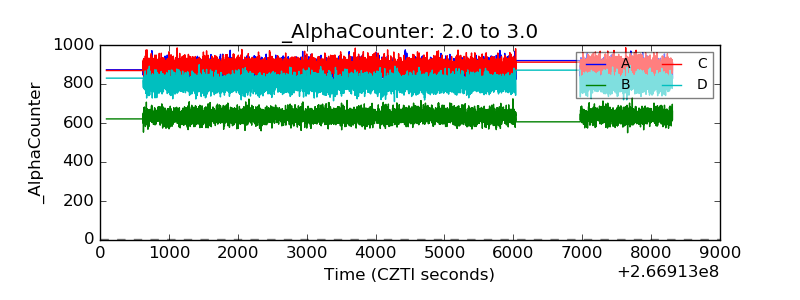 |
| _CPM_Rate | 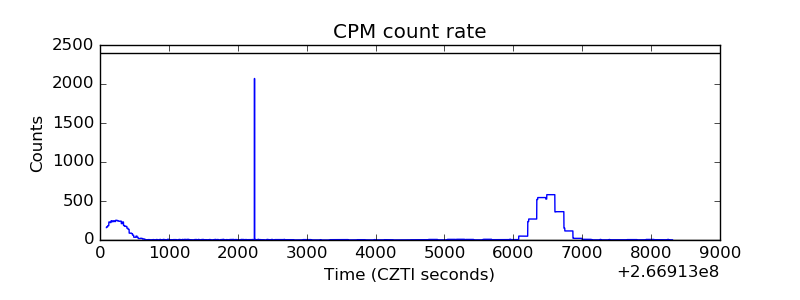 |
| CZT Counter | 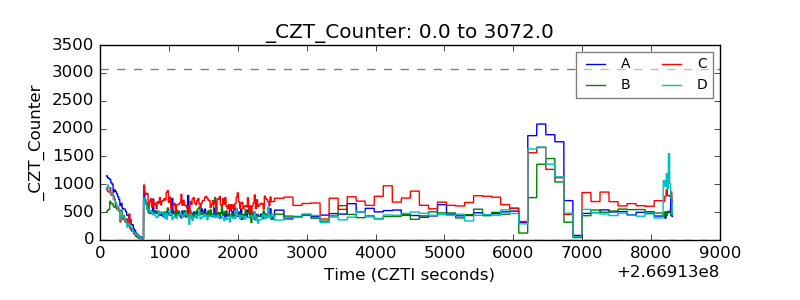 |
| +2.5 Volts monitor | 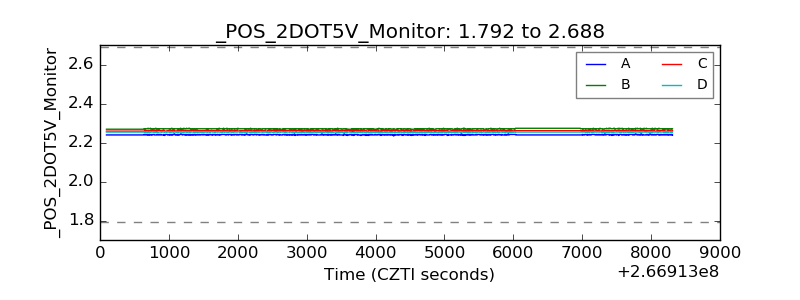 |
| +5 Volts monitor | 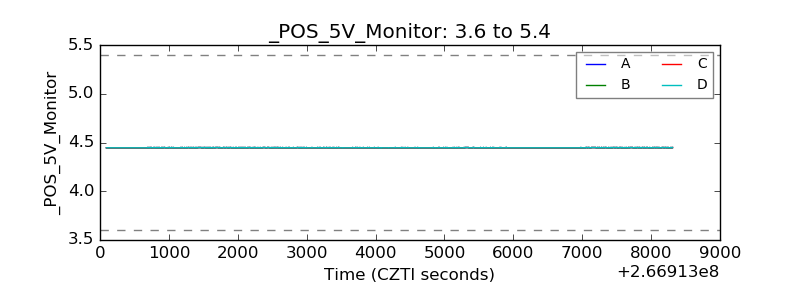 |
| _ROLL_ROT | 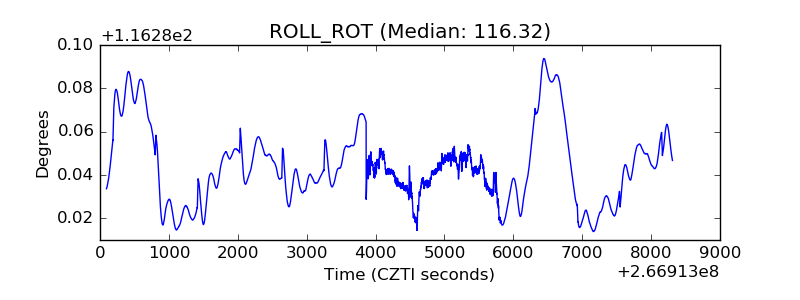 |
| _Roll_DEC | 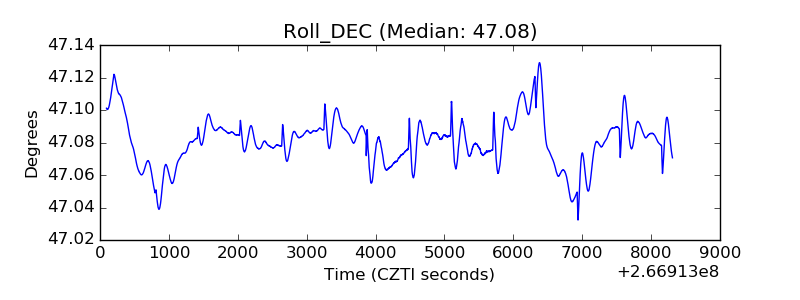 |
| _Roll_RA | 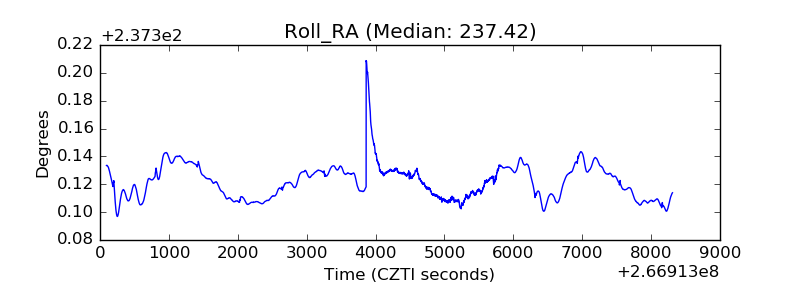 |
| Veto Counter | 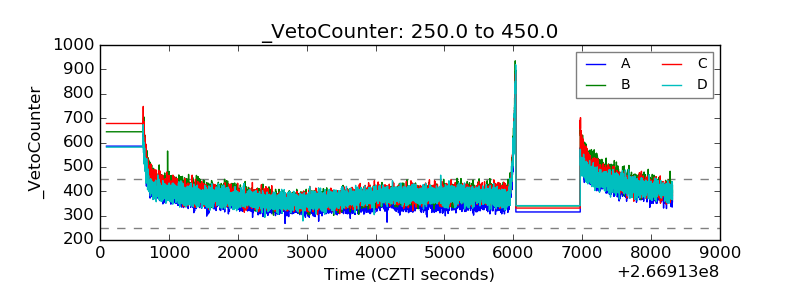 |