| Param | Original file | Final file |
|---|---|---|
| Filename | modeM0/AS1G08_057T09_9000002174_14701cztM0_level2.evt | modeM0/AS1G08_057T09_9000002174_14701cztM0_level2_quad_clean.evt |
| Size (bytes) | 559,290,240 | 91,013,760 |
| Size | 533.4 MB | 86.8 MB |
| Events in quadrant A | 3,634,677 | 573,230 |
| Events in quadrant B | 3,771,191 | 564,583 |
| Events in quadrant C | 5,502,253 | 550,761 |
| Events in quadrant D | 3,532,725 | 556,965 |
| Mode SS | |||
|---|---|---|---|
| Quadrant | BADHDUFLAG | Total packets | Discarded packets |
| A | 0 | 150 | 0 |
| B | 0 | 150 | 0 |
| C | 0 | 150 | 0 |
| D | 0 | 150 | 0 |
| Mode M0 | |||
|---|---|---|---|
| Quadrant | BADHDUFLAG | Total packets | Discarded packets |
| A | 0 | 15332 | 3 |
| B | 0 | 15736 | 2 |
| C | 0 | 22000 | 2 |
| D | 0 | 15420 | 2 |
| Mode M9 | |||
|---|---|---|---|
| Quadrant | BADHDUFLAG | Total packets | Discarded packets |
| A | 0 | 20 | 0 |
| B | 0 | 20 | 0 |
| C | 0 | 20 | 0 |
| D | 0 | 20 | 0 |
| Quadrant | Total seconds | Saturated seconds | Saturation percentage |
|---|---|---|---|
| A | 7338 | 96 | 1.308258% |
| B | 7338 | 111 | 1.512674% |
| C | 7338 | 113 | 1.539929% |
| D | 7338 | 88 | 1.199237% |
Noise dominated data is calculated using 1-second bins in cleaned event files. If a bin has >2000 counts, and if more than 50% of those come from <1% of pixels, then it is considered to be noise-dominated and hence unusable.
| Quadrant | # 1 sec bins | Bins with >0 counts | Bins with >2000 counts | High rate bins dominated by noise | Noise dominated (total time) | Noise dominated (detector-on time) | Marked lightcurve |
|---|---|---|---|---|---|---|---|
| A | 9334 | 7339 | 0 | 0 | 0.00% | 0.00% | 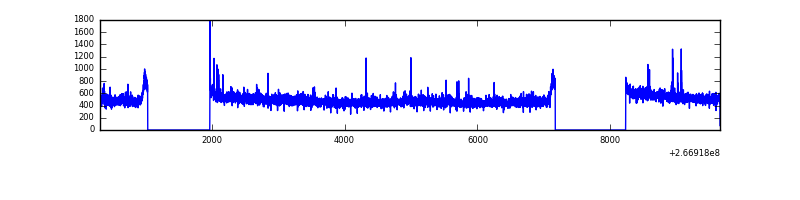 |
| B | 9334 | 7339 | 4 | 4 | 0.04% | 0.05% | 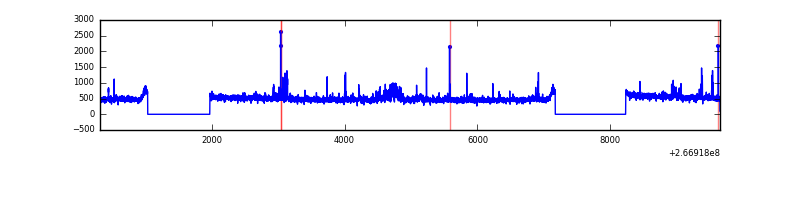 |
| C | 9334 | 7339 | 0 | 0 | 0.00% | 0.00% | 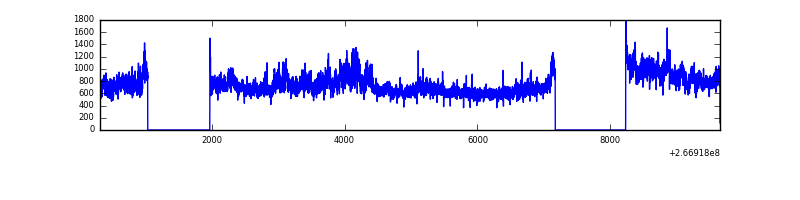 |
| D | 9334 | 7339 | 11 | 11 | 0.12% | 0.15% | 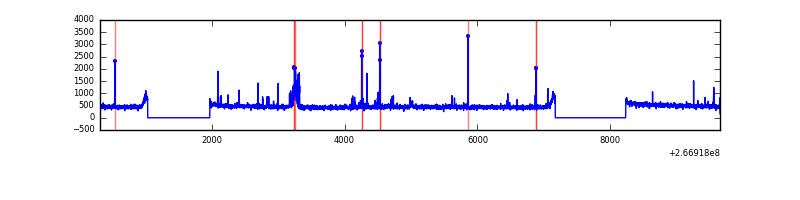 |
Top three noisy pixels from each quadrant. If the there are fewer than three noisy pixels in the level2.evt file, extra rows are filled as -1
| Pixel properties | Quadrant properties | ||||||
|---|---|---|---|---|---|---|---|
| Quadrant | DetID | PixID | Counts | Sigma | Mean | Median | Sigma |
| A | 12 | 189 | 38693 | 205.26 | 917 | 896 | 184.1 |
| A | 8 | 15 | 29837 | 157.16 | 917 | 896 | 184.1 |
| A | 3 | 1 | 19839 | 102.87 | 917 | 896 | 184.1 |
| B | 0 | 189 | 145709 | 829.13 | 909 | 887 | 174.7 |
| B | 0 | 229 | 30128 | 167.41 | 909 | 887 | 174.7 |
| B | 12 | 111 | 20708 | 113.48 | 909 | 887 | 174.7 |
| C | 3 | 233 | 2061061 | 10171.73 | 880 | 884 | 202.5 |
| C | 3 | 234 | 7490 | 32.62 | 880 | 884 | 202.5 |
| C | 13 | 61 | 6357 | 27.02 | 880 | 884 | 202.5 |
| D | 2 | 14 | 81559 | 383.28 | 885 | 862 | 210.5 |
| D | 2 | 120 | 35687 | 165.41 | 885 | 862 | 210.5 |
| D | 2 | 234 | 24777 | 113.59 | 885 | 862 | 210.5 |
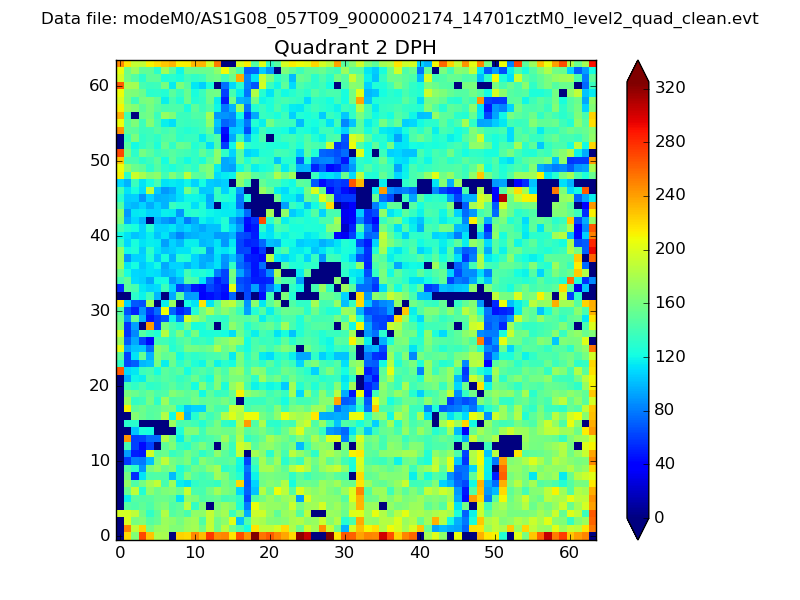
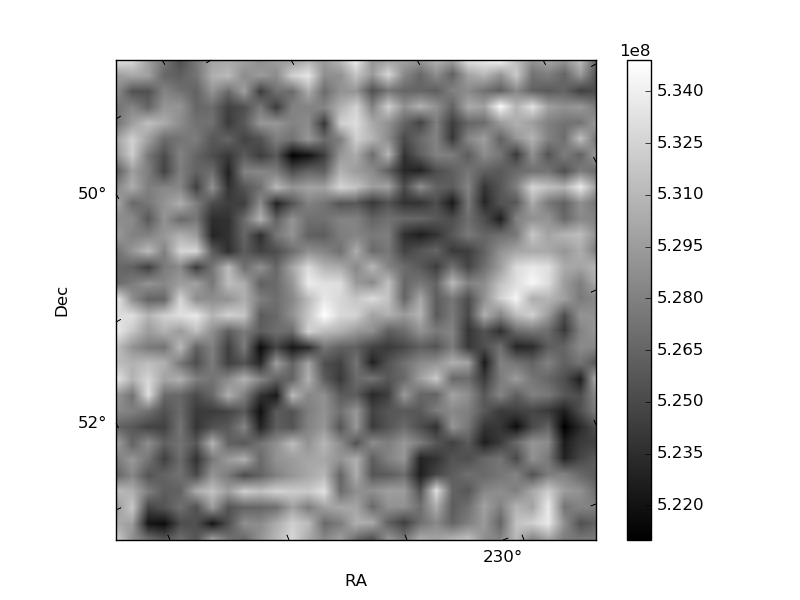
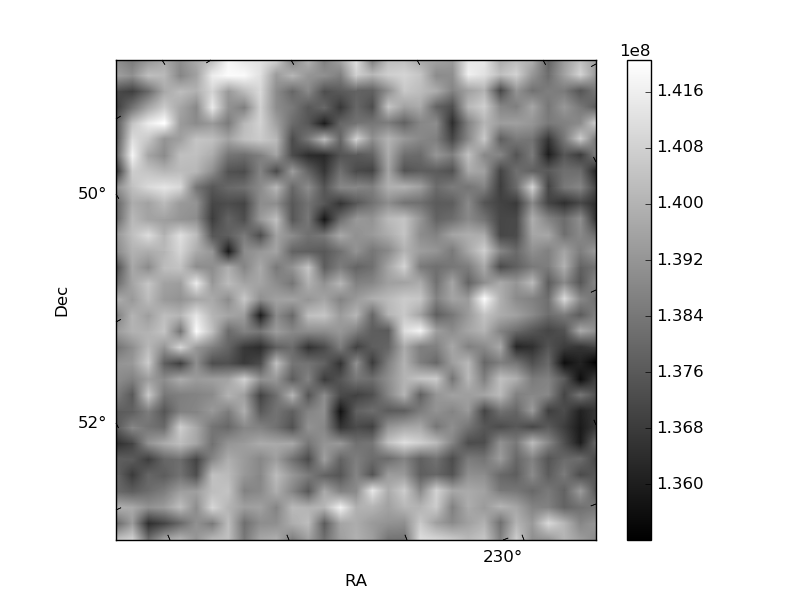
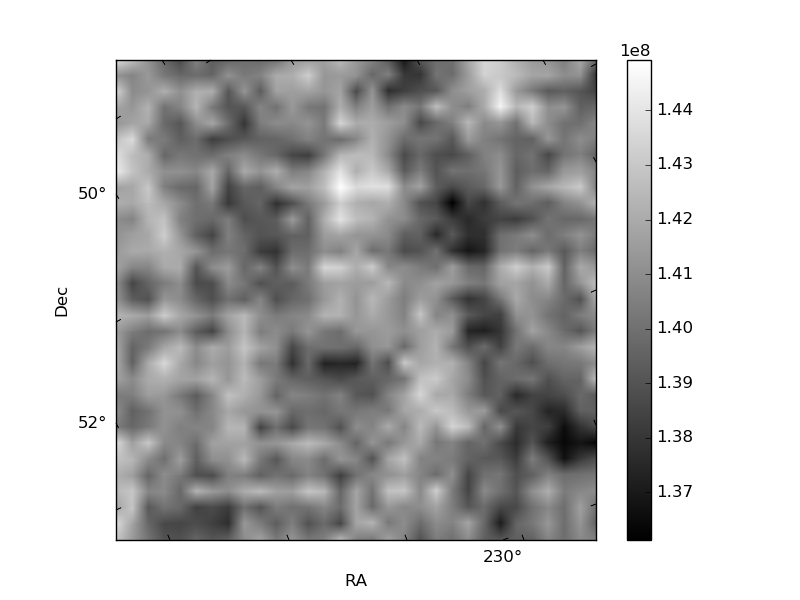
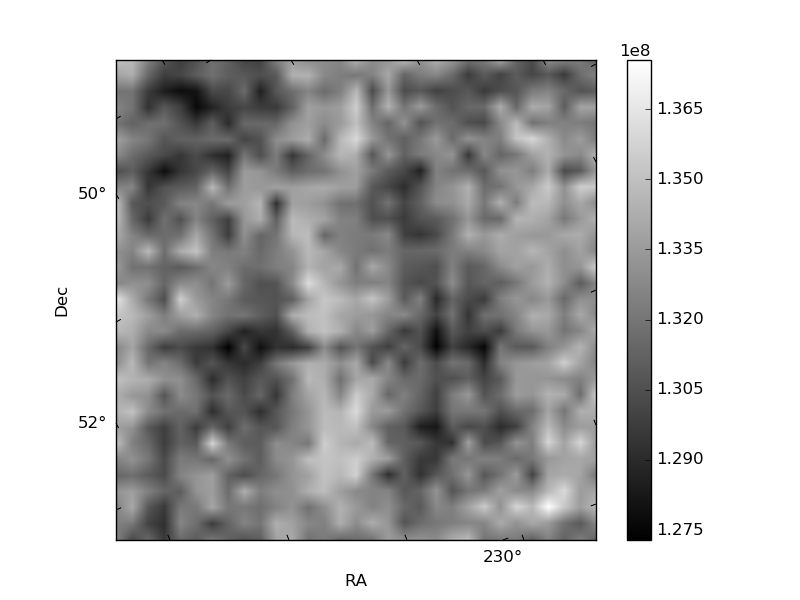
Histogram calculated using DETX and DETY for each event in the final _common_clean file
| Quadrant A | 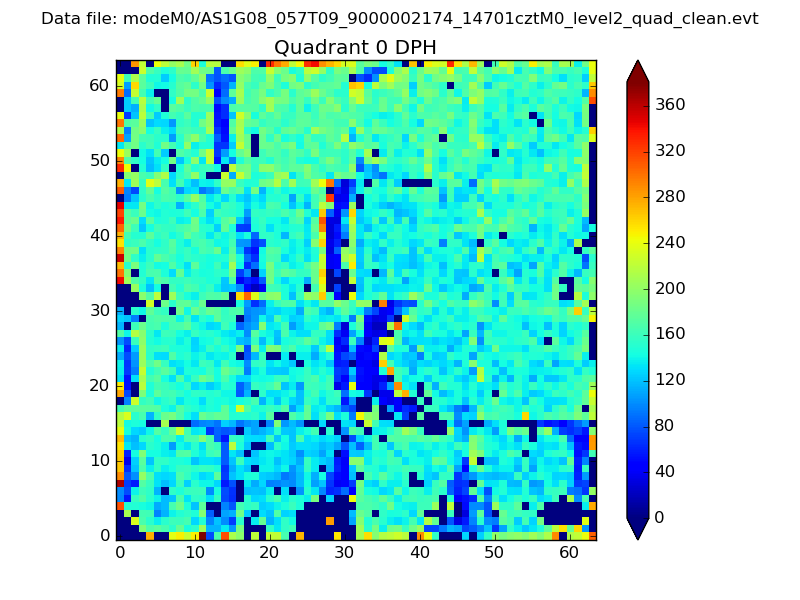 |
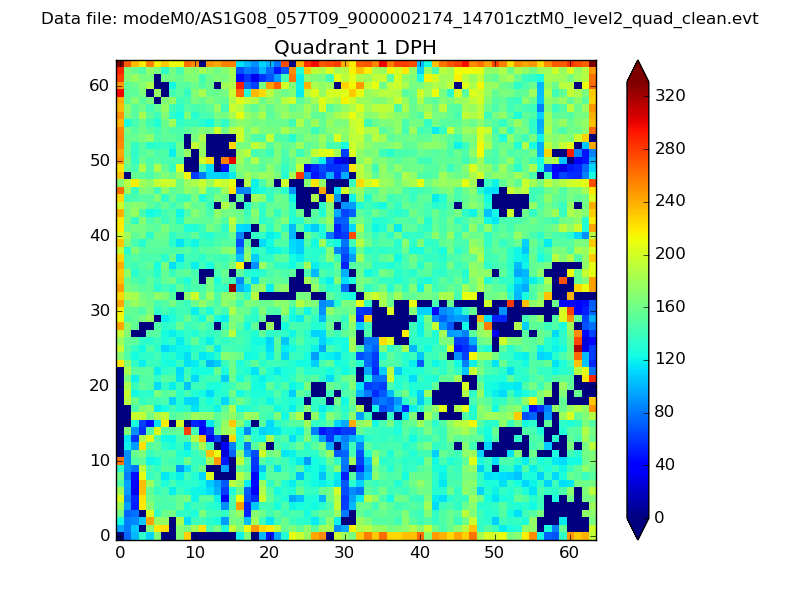 |
Quadrant B |
|---|---|---|---|
| Quadrant D | 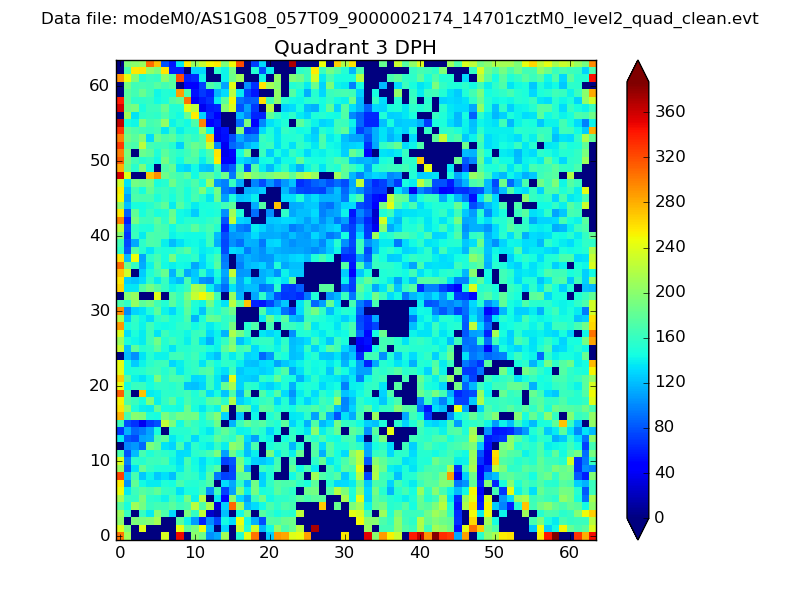 |
 |
Quadrant C |
| Plot type | Count rate plots | Images |
|---|---|---|
| Comparison with Poisson distribution Blue bars denote a histogram of data divided into 1 sec bins. Red curve is a Poisson curve with rate = median count rate of data. |
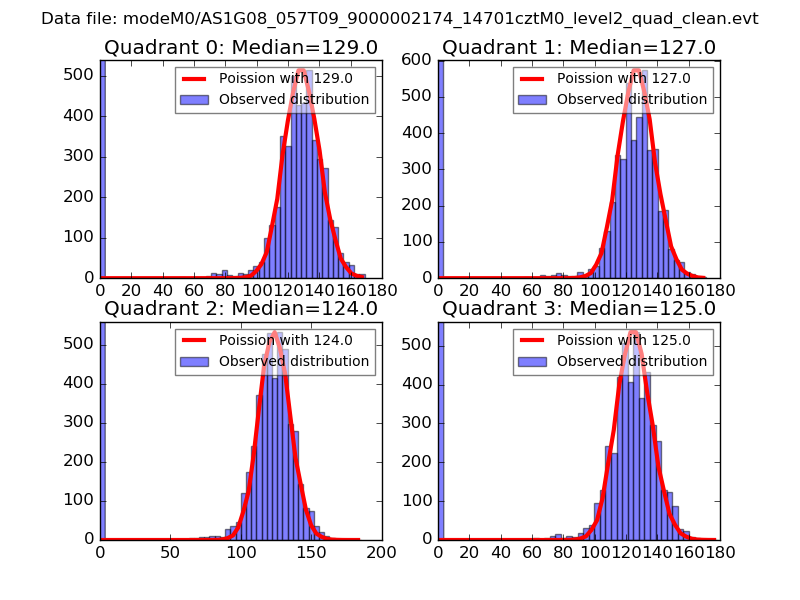 |
 |
| Quadrant-wise count rates Data is divided into 100 sec bins |
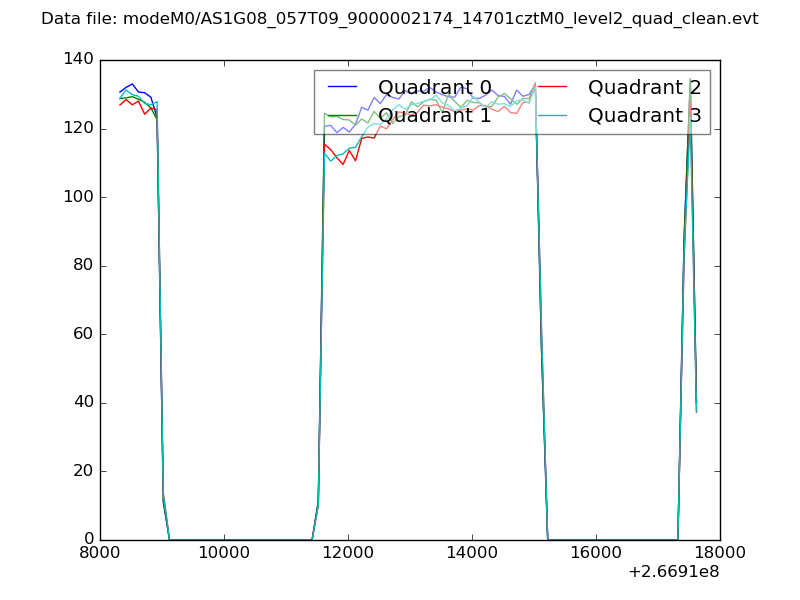 |
|
| Module-wise count rates for Quadrant A Data is divided into 100 sec bins |
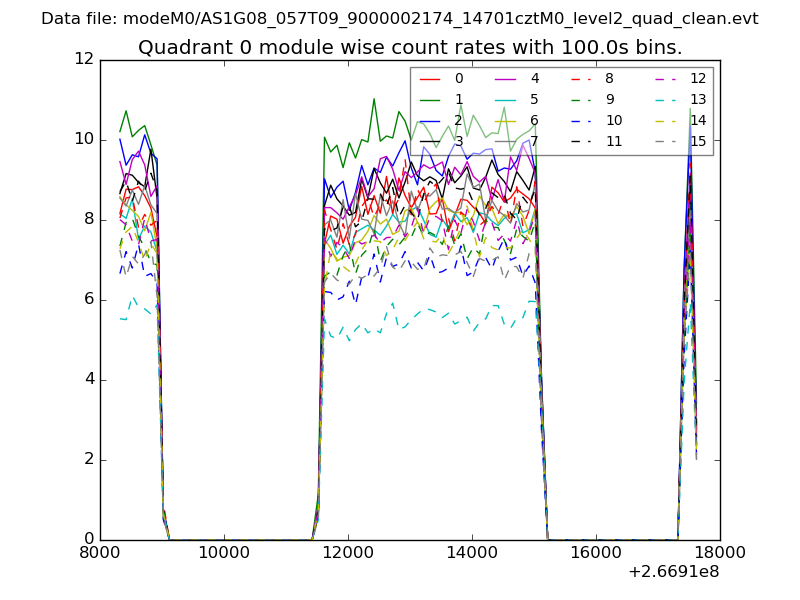 |
 |
| Module-wise count rates for Quadrant B Data is divided into 100 sec bins |
 |
 |
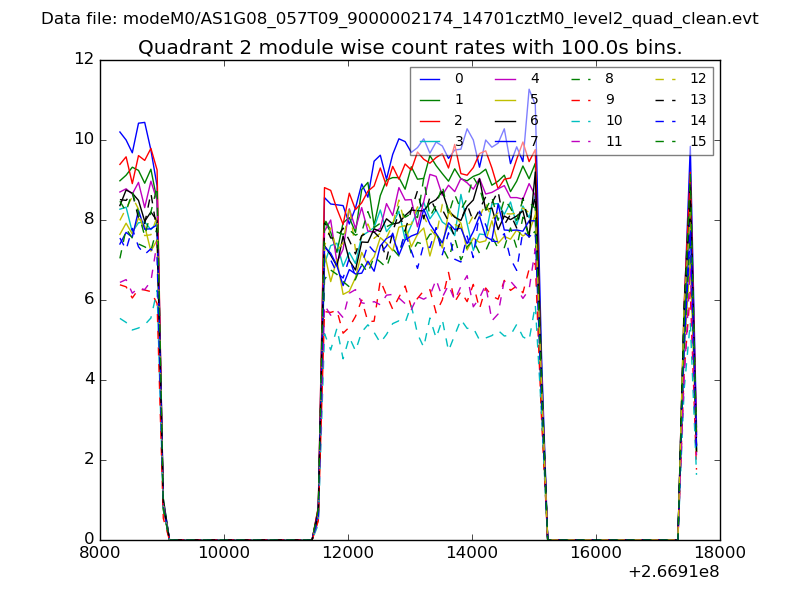
| Module-wise count rates for Quadrant C Data is divided into 100 sec bins |
 |
 |
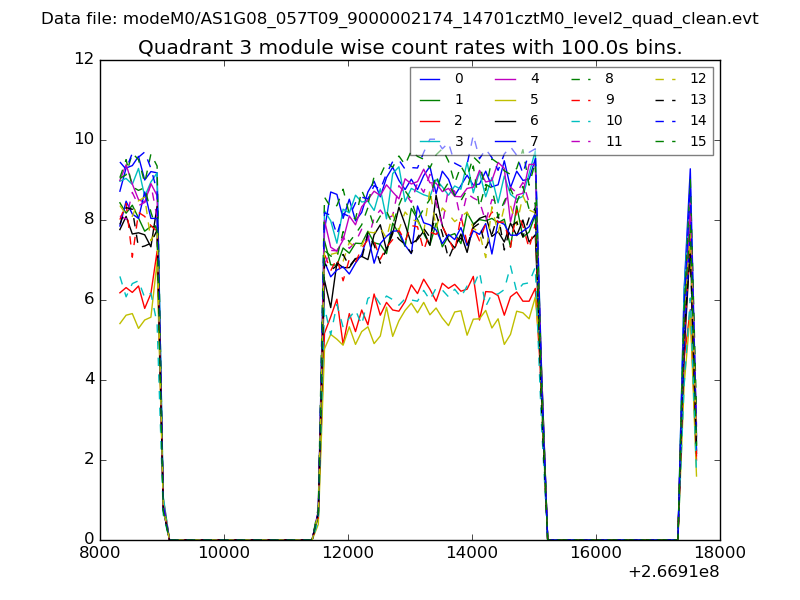
| Module-wise count rates for Quadrant D Data is divided into 100 sec bins |
 |
 |
| Parameter | Plot |
|---|---|
| CZT HV Monitor | 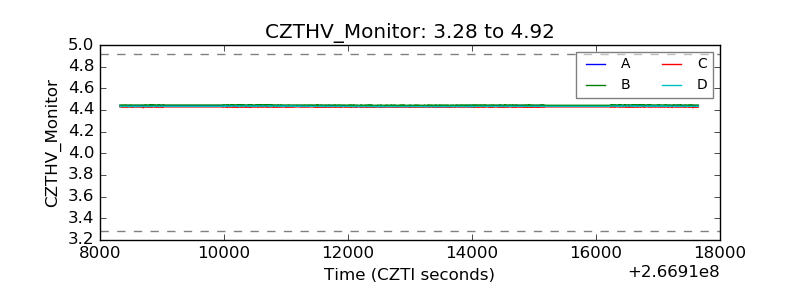 |
| D_VDD | 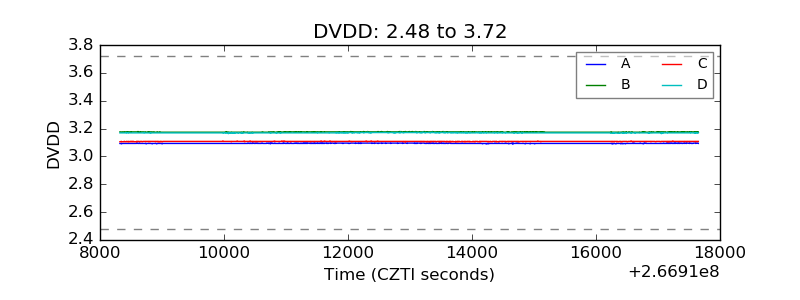 |
| Temperature 1 |  |
| Veto HV Monitor | 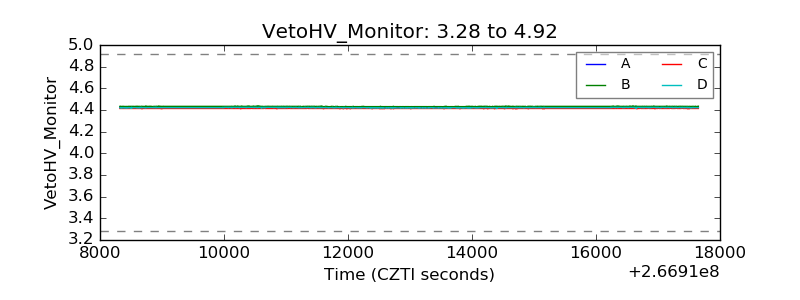 |
| Veto LLD | 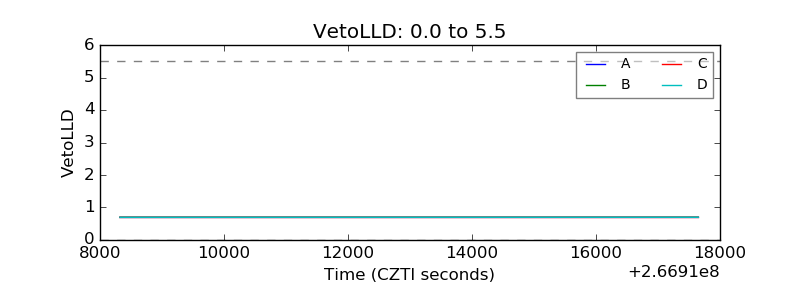 |
| Alpha Counter | 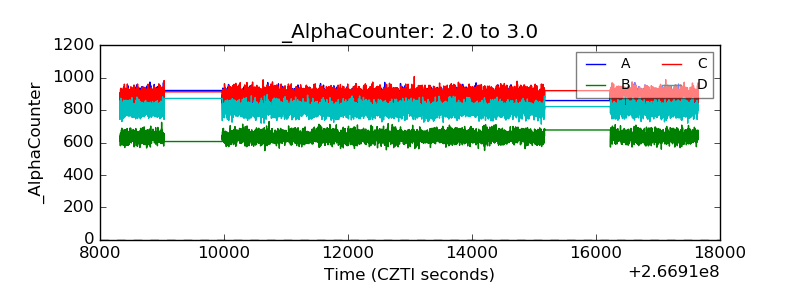 |
| _CPM_Rate | 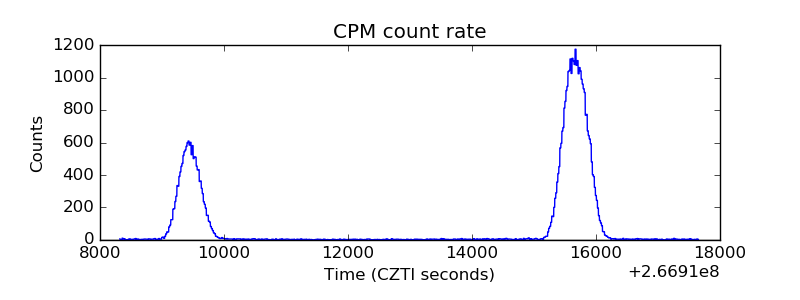 |
| CZT Counter | 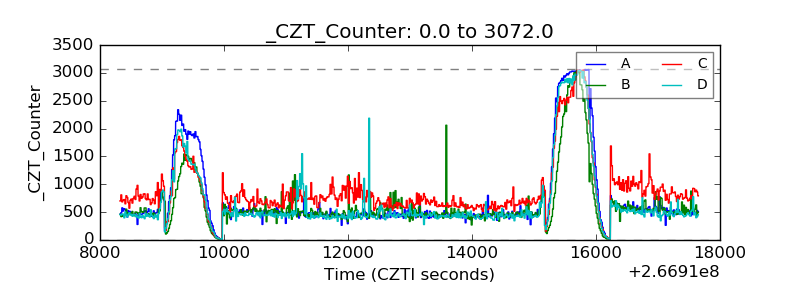 |
| +2.5 Volts monitor |  |
| +5 Volts monitor |  |
| _ROLL_ROT | 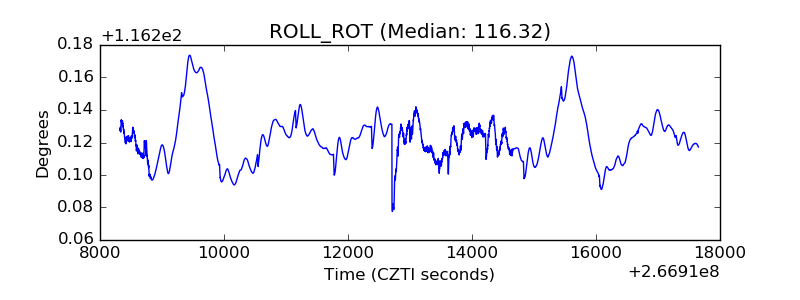 |
| _Roll_DEC | 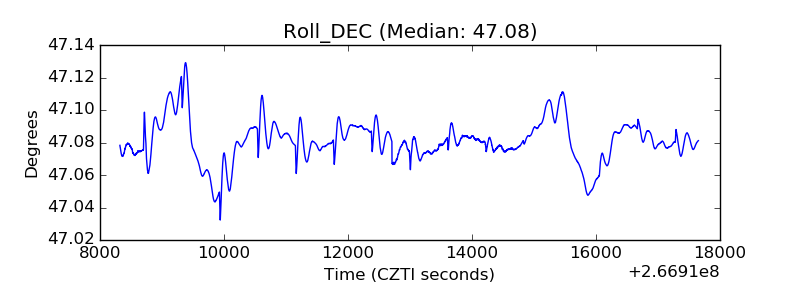 |
| _Roll_RA | 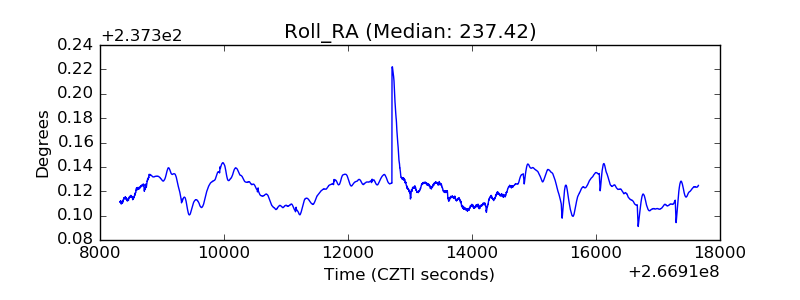 |
| Veto Counter | 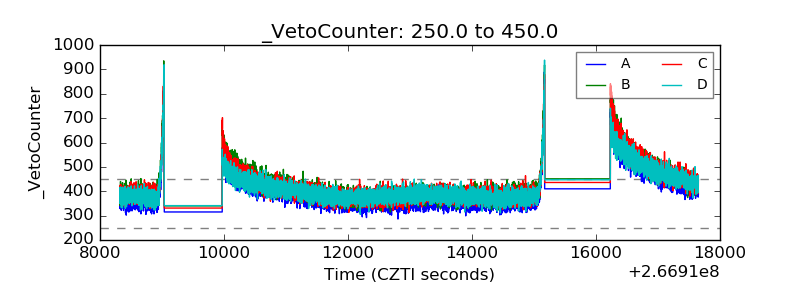 |