| Param | Original file | Final file |
|---|---|---|
| Filename | modeM0/AS1G08_057T09_9000002174_14702cztM0_level2.evt | modeM0/AS1G08_057T09_9000002174_14702cztM0_level2_quad_clean.evt |
| Size (bytes) | 521,046,720 | 91,846,080 |
| Size | 496.9 MB | 87.6 MB |
| Events in quadrant A | 3,323,143 | 597,978 |
| Events in quadrant B | 3,393,955 | 585,983 |
| Events in quadrant C | 5,437,938 | 566,643 |
| Events in quadrant D | 3,182,358 | 575,436 |
| Mode SS | |||
|---|---|---|---|
| Quadrant | BADHDUFLAG | Total packets | Discarded packets |
| A | 0 | 134 | 0 |
| B | 0 | 134 | 0 |
| C | 0 | 134 | 0 |
| D | 0 | 134 | 0 |
| Mode M0 | |||
|---|---|---|---|
| Quadrant | BADHDUFLAG | Total packets | Discarded packets |
| A | 0 | 14032 | 3 |
| B | 0 | 14280 | 2 |
| C | 0 | 20963 | 2 |
| D | 0 | 13700 | 2 |
| Mode M9 | |||
|---|---|---|---|
| Quadrant | BADHDUFLAG | Total packets | Discarded packets |
| A | 0 | 19 | 0 |
| B | 0 | 19 | 0 |
| C | 0 | 19 | 0 |
| D | 0 | 20 | 0 |
| Quadrant | Total seconds | Saturated seconds | Saturation percentage |
|---|---|---|---|
| A | 6526 | 65 | 0.996016% |
| B | 6526 | 78 | 1.195219% |
| C | 6526 | 89 | 1.363776% |
| D | 6526 | 49 | 0.750843% |
Noise dominated data is calculated using 1-second bins in cleaned event files. If a bin has >2000 counts, and if more than 50% of those come from <1% of pixels, then it is considered to be noise-dominated and hence unusable.
| Quadrant | # 1 sec bins | Bins with >0 counts | Bins with >2000 counts | High rate bins dominated by noise | Noise dominated (total time) | Noise dominated (detector-on time) | Marked lightcurve |
|---|---|---|---|---|---|---|---|
| A | 7682 | 6527 | 0 | 0 | 0.00% | 0.00% | 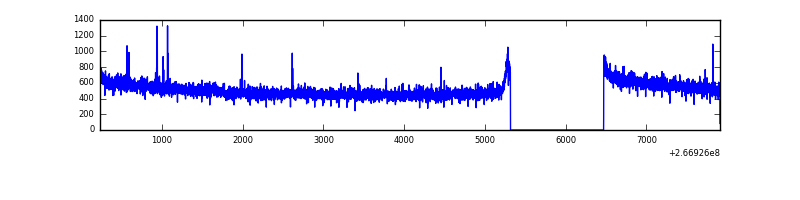 |
| B | 7682 | 6527 | 9 | 9 | 0.12% | 0.14% | 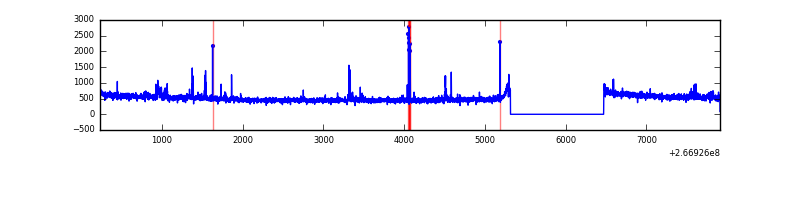 |
| C | 7682 | 6527 | 0 | 0 | 0.00% | 0.00% | 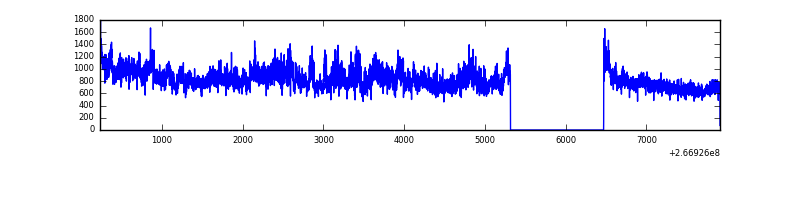 |
| D | 7682 | 6527 | 0 | 0 | 0.00% | 0.00% | 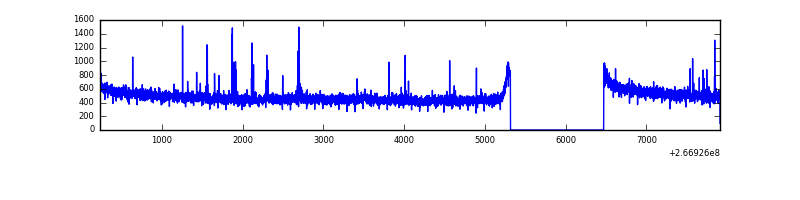 |
Top three noisy pixels from each quadrant. If the there are fewer than three noisy pixels in the level2.evt file, extra rows are filled as -1
| Pixel properties | Quadrant properties | ||||||
|---|---|---|---|---|---|---|---|
| Quadrant | DetID | PixID | Counts | Sigma | Mean | Median | Sigma |
| A | 9 | 143 | 13671 | 75.81 | 851 | 835 | 169.3 |
| A | 12 | 189 | 12612 | 69.55 | 851 | 835 | 169.3 |
| A | 0 | 226 | 7659 | 40.3 | 851 | 835 | 169.3 |
| B | 0 | 229 | 31445 | 193.78 | 836 | 817 | 158.1 |
| B | 15 | 201 | 25696 | 157.4 | 836 | 817 | 158.1 |
| B | 0 | 189 | 18875 | 114.25 | 836 | 817 | 158.1 |
| C | 3 | 233 | 2263706 | 12171.1 | 811 | 816 | 185.9 |
| C | 3 | 234 | 10102 | 49.95 | 811 | 816 | 185.9 |
| C | 13 | 61 | 5738 | 26.47 | 811 | 816 | 185.9 |
| D | 2 | 234 | 22868 | 113.74 | 822 | 801 | 194.0 |
| D | 15 | 145 | 17114 | 84.08 | 822 | 801 | 194.0 |
| D | 13 | 172 | 12483 | 60.21 | 822 | 801 | 194.0 |
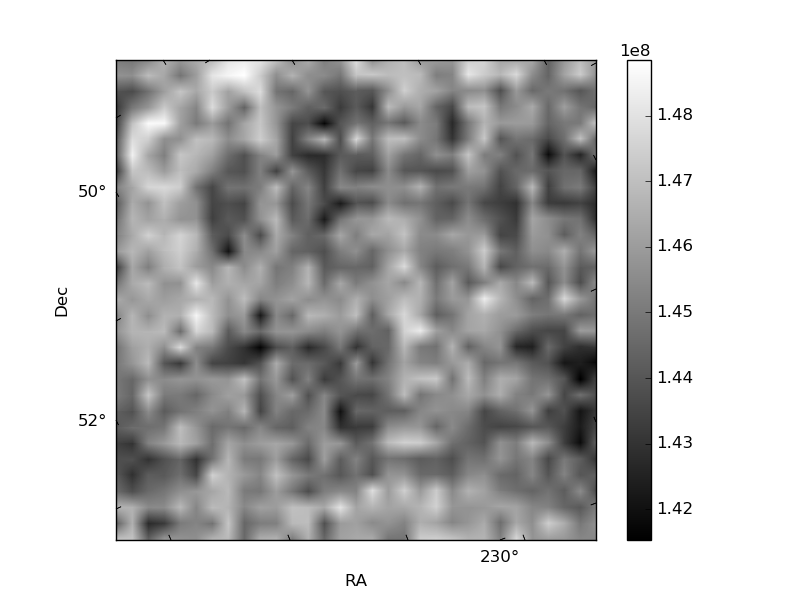
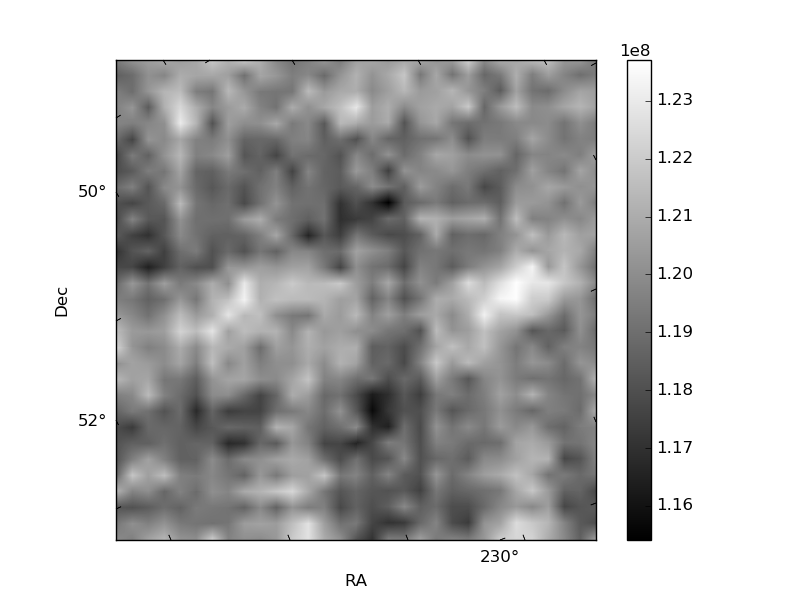
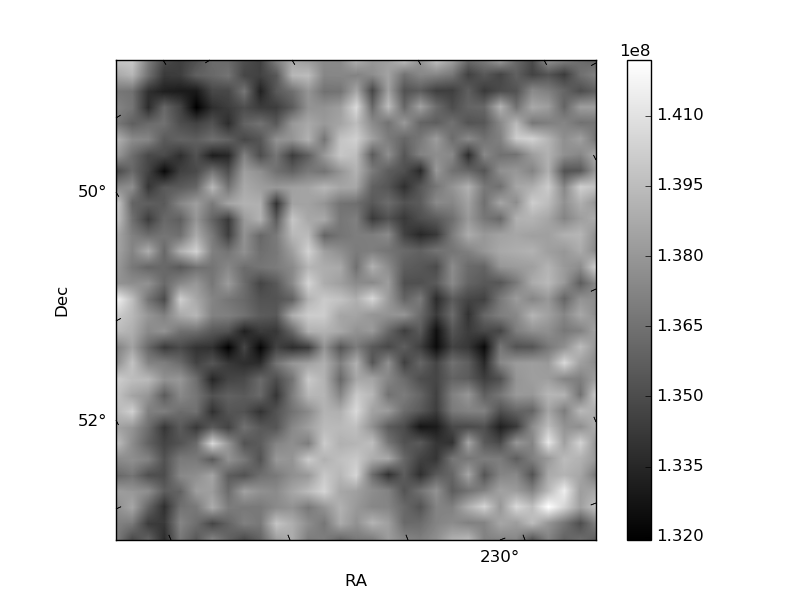
Histogram calculated using DETX and DETY for each event in the final _common_clean file
| Quadrant A | 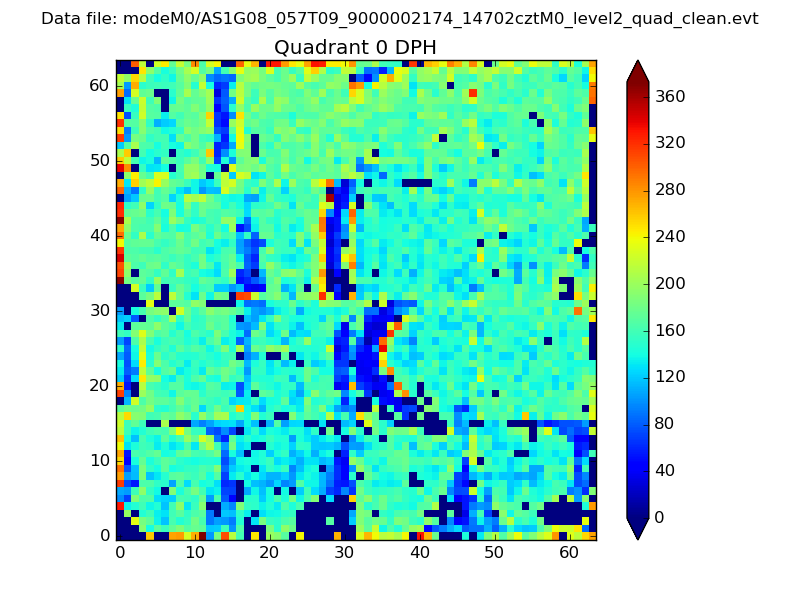 |
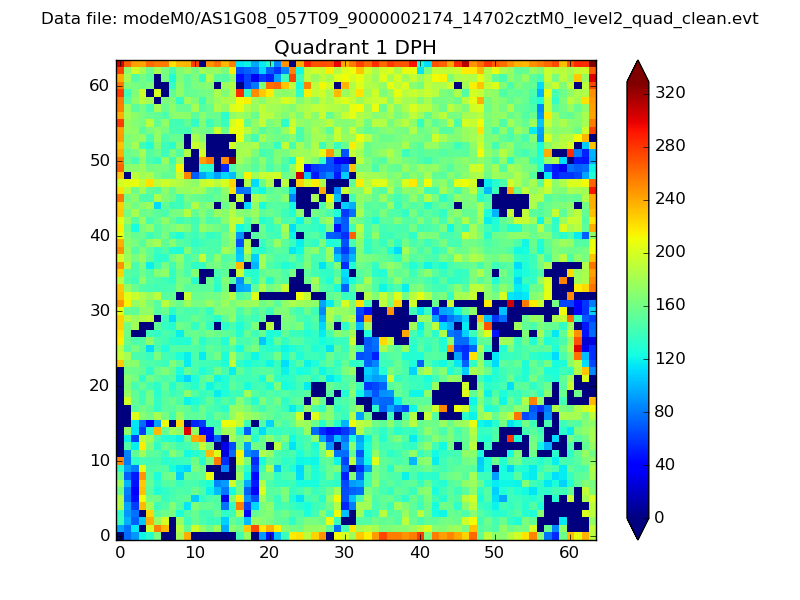 |
Quadrant B |
|---|---|---|---|
| Quadrant D | 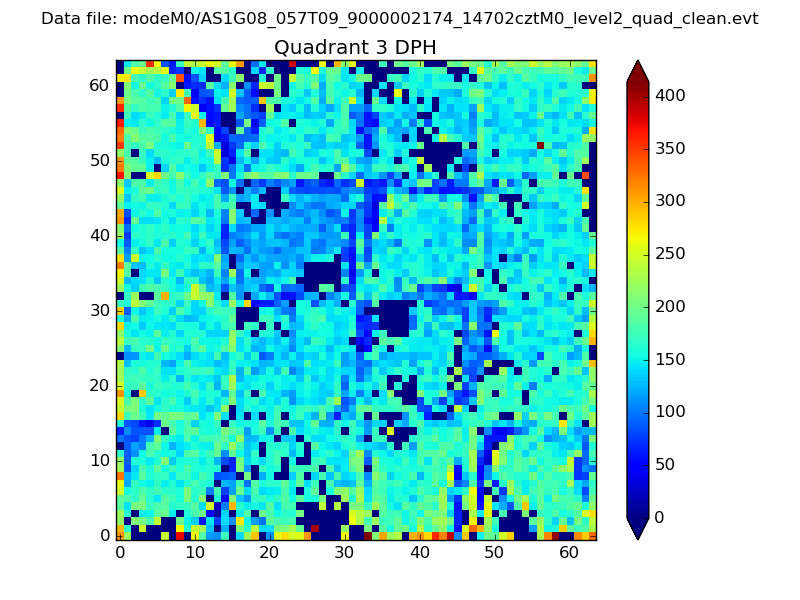 |
 |
Quadrant C |
| Plot type | Count rate plots | Images |
|---|---|---|
| Comparison with Poisson distribution Blue bars denote a histogram of data divided into 1 sec bins. Red curve is a Poisson curve with rate = median count rate of data. |
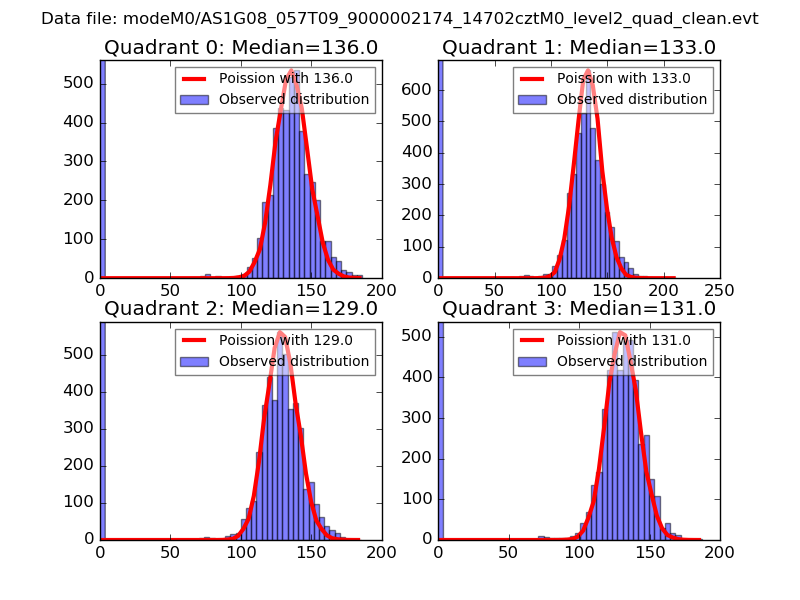 |
 |
| Quadrant-wise count rates Data is divided into 100 sec bins |
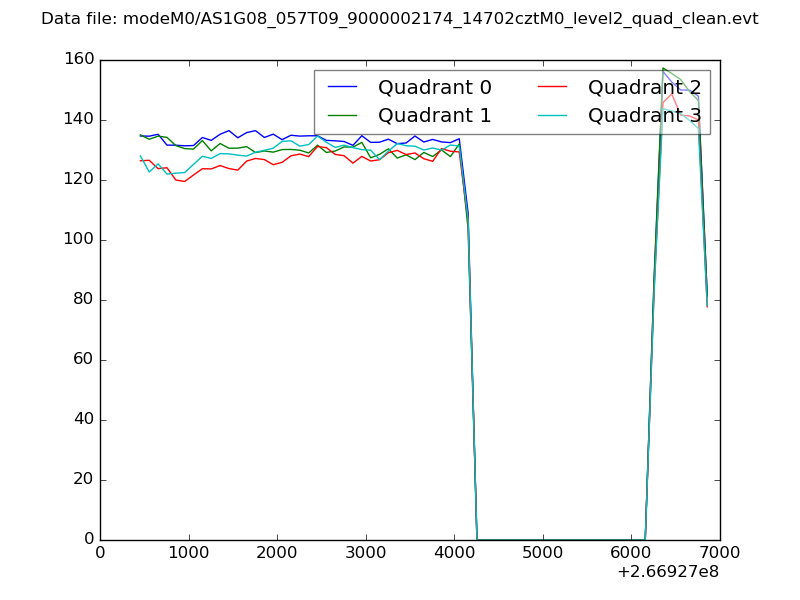 |
|
| Module-wise count rates for Quadrant A Data is divided into 100 sec bins |
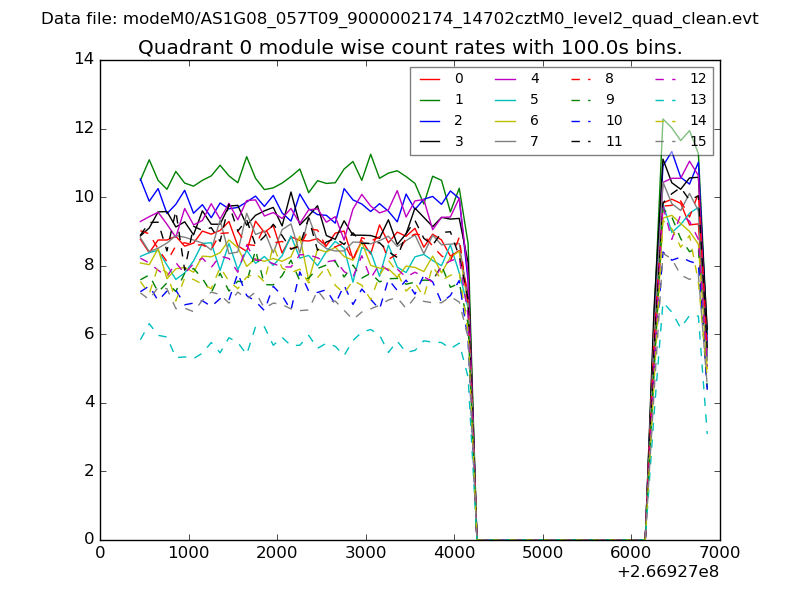 |
 |
| Module-wise count rates for Quadrant B Data is divided into 100 sec bins |
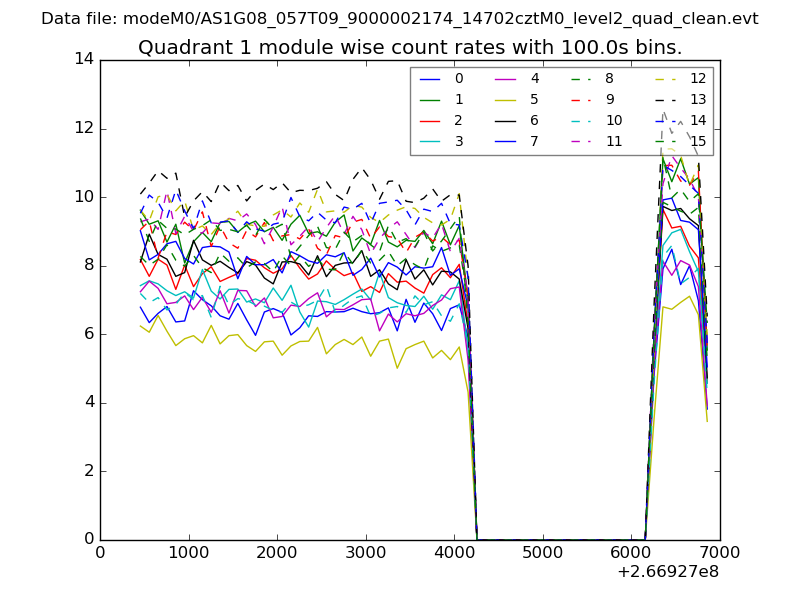 |
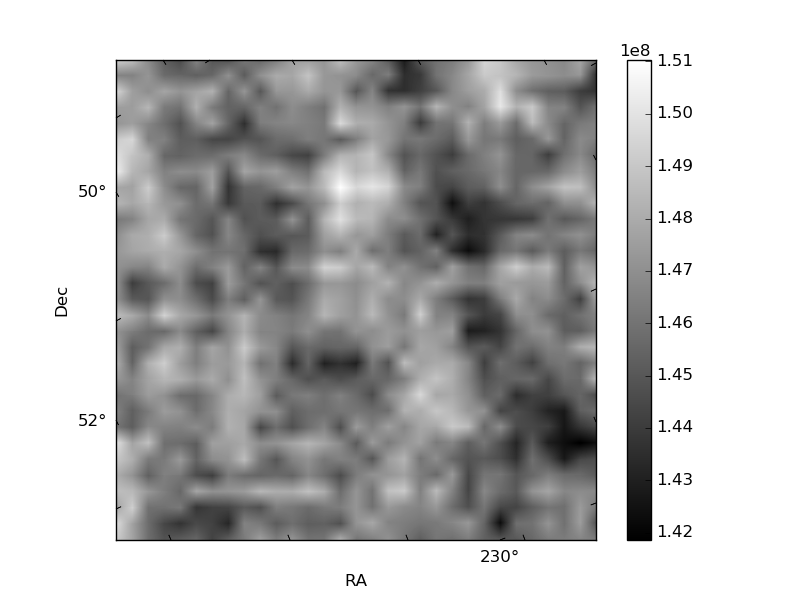 |
| Module-wise count rates for Quadrant C Data is divided into 100 sec bins |
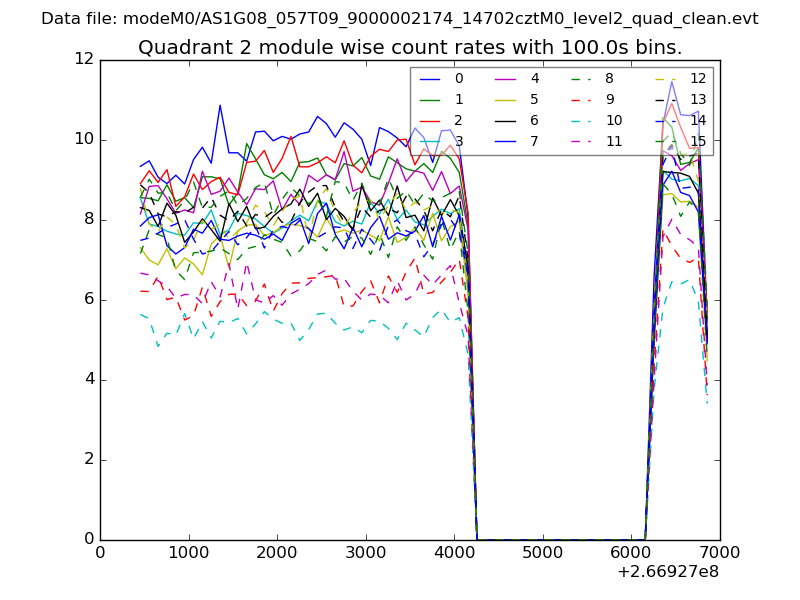 |
 |
| Module-wise count rates for Quadrant D Data is divided into 100 sec bins |
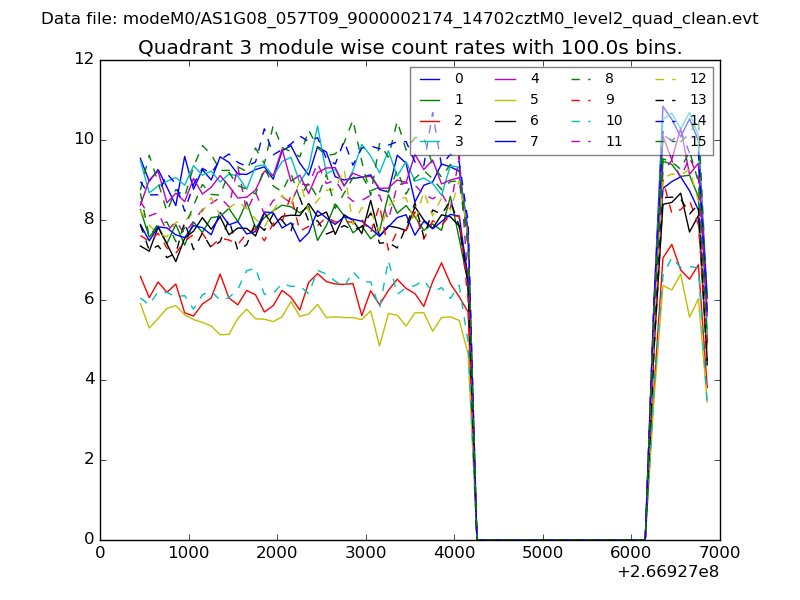 |
 |
| Parameter | Plot |
|---|---|
| CZT HV Monitor | 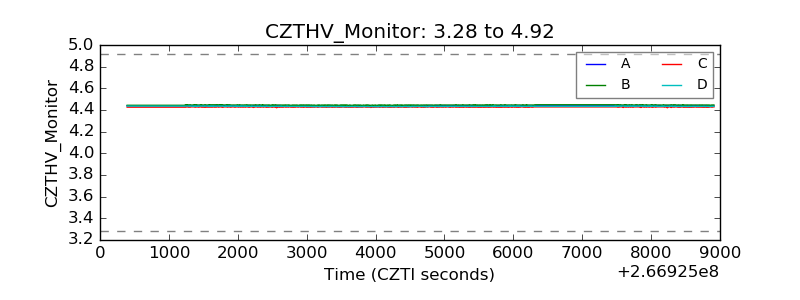 |
| D_VDD | 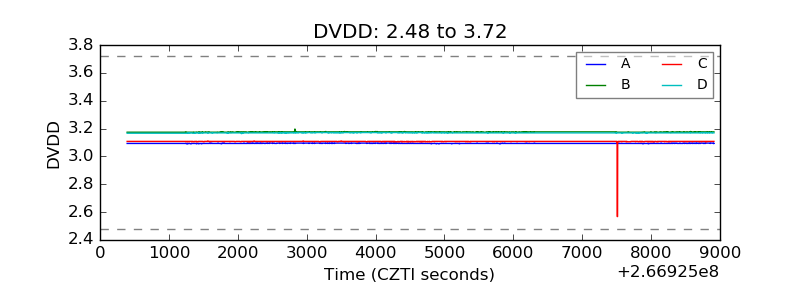 |
| Temperature 1 | 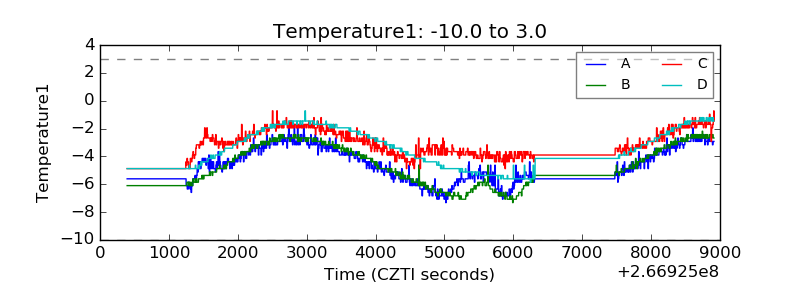 |
| Veto HV Monitor | 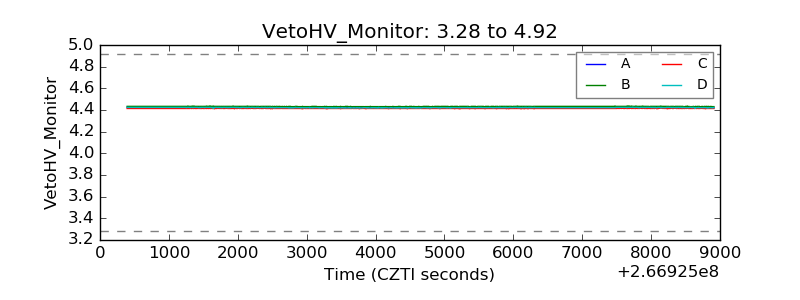 |
| Veto LLD | 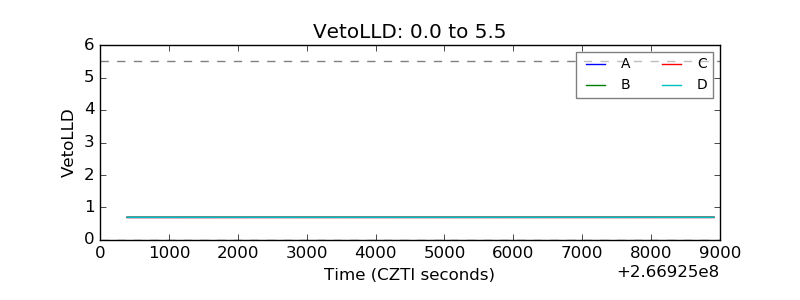 |
| Alpha Counter | 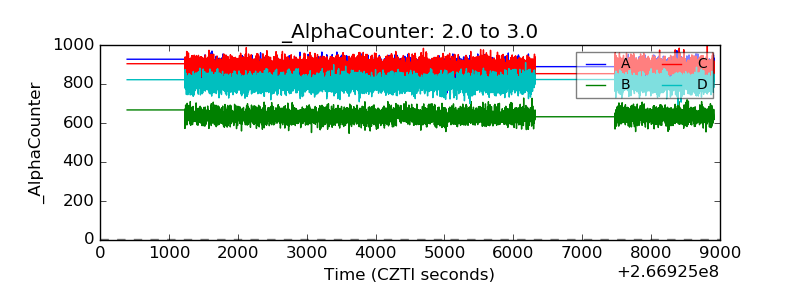 |
| _CPM_Rate | 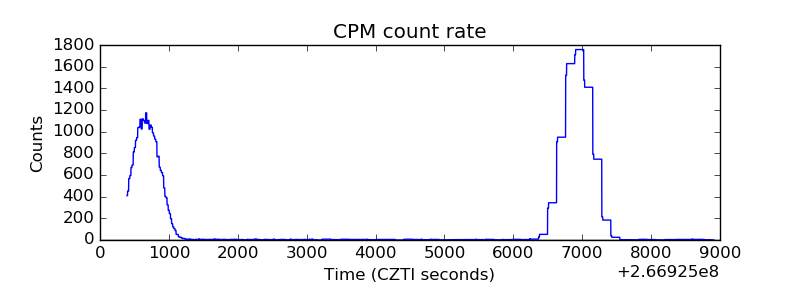 |
| CZT Counter |  |
| +2.5 Volts monitor |  |
| +5 Volts monitor | 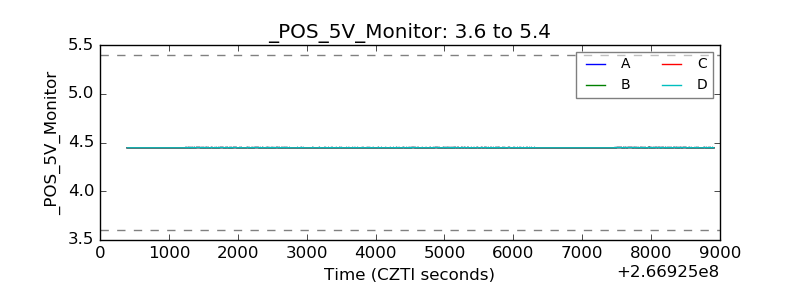 |
| _ROLL_ROT | 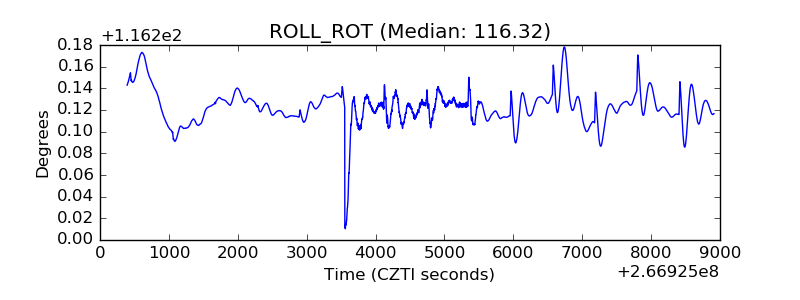 |
| _Roll_DEC | 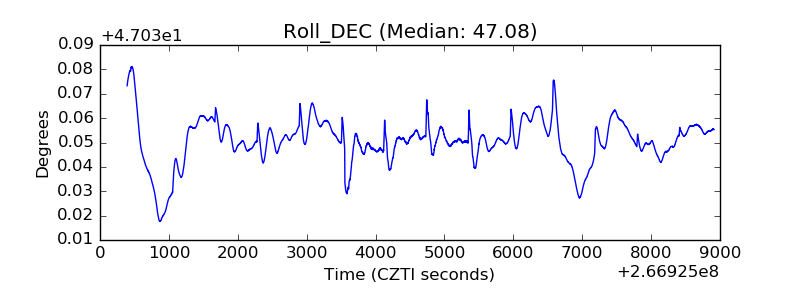 |
| _Roll_RA | 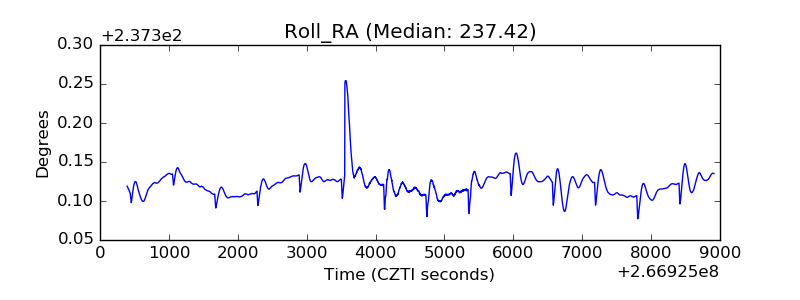 |
| Veto Counter | 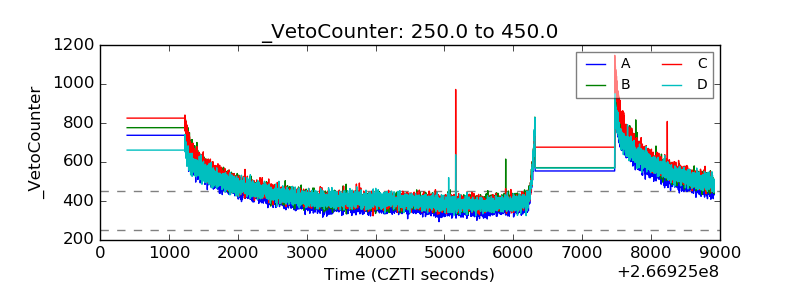 |