| Param | Original file | Final file |
|---|---|---|
| Filename | modeM0/AS1G08_057T09_9000002174_14704cztM0_level2.evt | modeM0/AS1G08_057T09_9000002174_14704cztM0_level2_quad_clean.evt |
| Size (bytes) | 461,407,680 | 104,515,200 |
| Size | 440.0 MB | 99.7 MB |
| Events in quadrant A | 3,183,375 | 702,458 |
| Events in quadrant B | 3,146,510 | 692,550 |
| Events in quadrant C | 4,058,719 | 676,139 |
| Events in quadrant D | 3,174,967 | 672,134 |
| Mode SS | |||
|---|---|---|---|
| Quadrant | BADHDUFLAG | Total packets | Discarded packets |
| A | 0 | 122 | 0 |
| B | 0 | 122 | 0 |
| C | 0 | 122 | 0 |
| D | 0 | 122 | 0 |
| Mode M0 | |||
|---|---|---|---|
| Quadrant | BADHDUFLAG | Total packets | Discarded packets |
| A | 0 | 13305 | 2 |
| B | 0 | 13218 | 1 |
| C | 0 | 16892 | 1 |
| D | 0 | 13256 | 1 |
| Mode M9 | |||
|---|---|---|---|
| Quadrant | BADHDUFLAG | Total packets | Discarded packets |
| A | 0 | 13 | 0 |
| B | 0 | 13 | 0 |
| C | 0 | 13 | 0 |
| D | 0 | 13 | 0 |
| Quadrant | Total seconds | Saturated seconds | Saturation percentage |
|---|---|---|---|
| A | 6048 | 72 | 1.190476% |
| B | 6048 | 66 | 1.091270% |
| C | 6048 | 67 | 1.107804% |
| D | 6048 | 50 | 0.826720% |
Noise dominated data is calculated using 1-second bins in cleaned event files. If a bin has >2000 counts, and if more than 50% of those come from <1% of pixels, then it is considered to be noise-dominated and hence unusable.
| Quadrant | # 1 sec bins | Bins with >0 counts | Bins with >2000 counts | High rate bins dominated by noise | Noise dominated (total time) | Noise dominated (detector-on time) | Marked lightcurve |
|---|---|---|---|---|---|---|---|
| A | 7309 | 6049 | 0 | 0 | 0.00% | 0.00% | 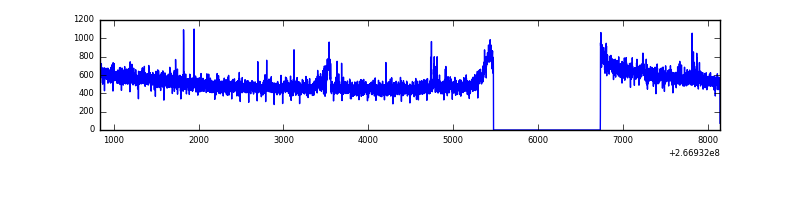 |
| B | 7309 | 6049 | 0 | 0 | 0.00% | 0.00% | 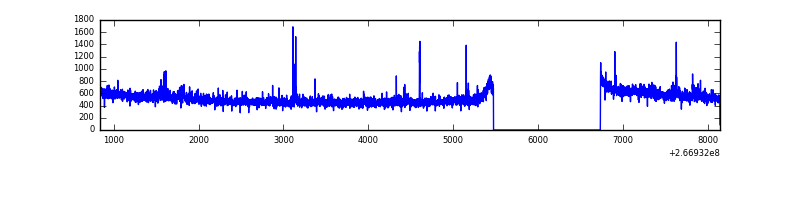 |
| C | 7309 | 6049 | 0 | 0 | 0.00% | 0.00% | 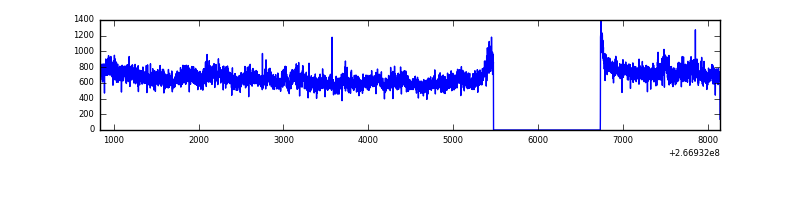 |
| D | 7309 | 6049 | 1 | 1 | 0.01% | 0.02% | 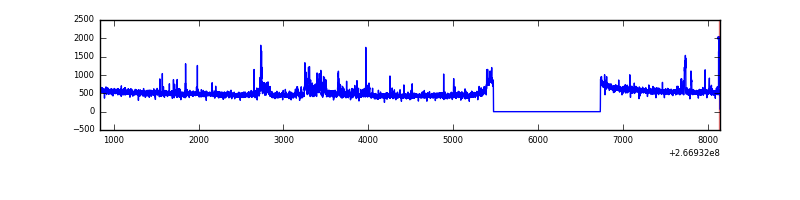 |
Top three noisy pixels from each quadrant. If the there are fewer than three noisy pixels in the level2.evt file, extra rows are filled as -1
| Pixel properties | Quadrant properties | ||||||
|---|---|---|---|---|---|---|---|
| Quadrant | DetID | PixID | Counts | Sigma | Mean | Median | Sigma |
| A | 12 | 189 | 57170 | 354.97 | 805 | 790 | 158.8 |
| A | 8 | 15 | 16136 | 96.62 | 805 | 790 | 158.8 |
| A | 3 | 1 | 10153 | 58.95 | 805 | 790 | 158.8 |
| B | 0 | 205 | 26537 | 174.54 | 789 | 774 | 147.6 |
| B | 0 | 214 | 19368 | 125.97 | 789 | 774 | 147.6 |
| B | 12 | 111 | 16768 | 108.36 | 789 | 774 | 147.6 |
| C | 3 | 233 | 1041458 | 5900.86 | 773 | 778 | 176.4 |
| C | 13 | 61 | 5396 | 26.18 | 773 | 778 | 176.4 |
| C | 3 | 234 | 2085 | 7.41 | 773 | 778 | 176.4 |
| D | 12 | 110 | 164800 | 895.12 | 781 | 764 | 183.3 |
| D | 2 | 234 | 21293 | 112.02 | 781 | 764 | 183.3 |
| D | 2 | 120 | 18093 | 94.56 | 781 | 764 | 183.3 |
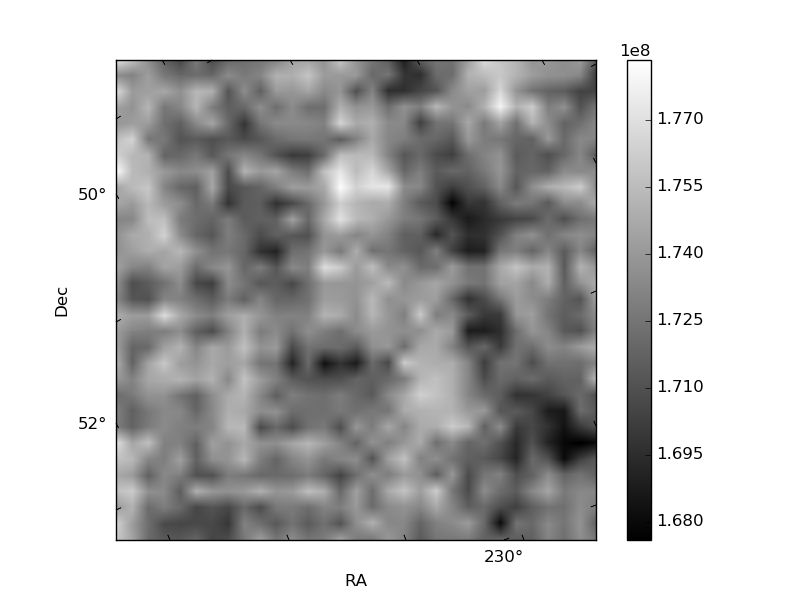
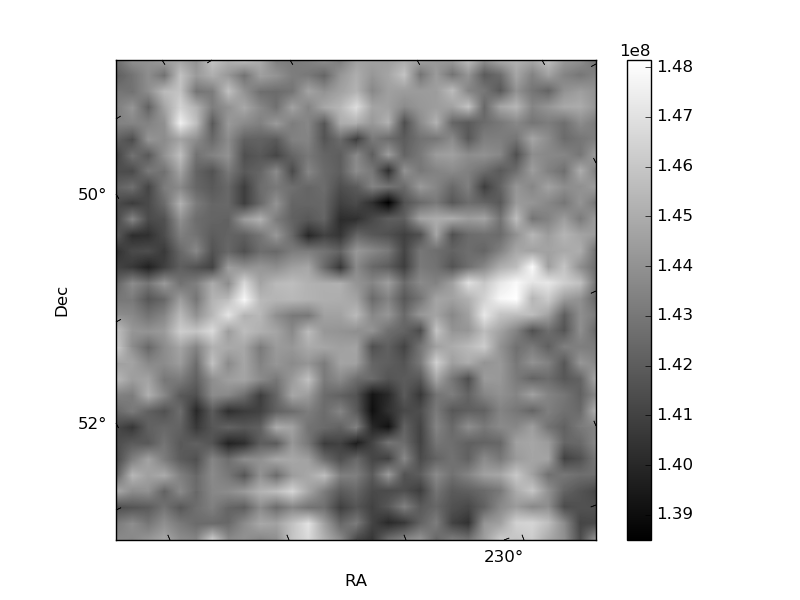
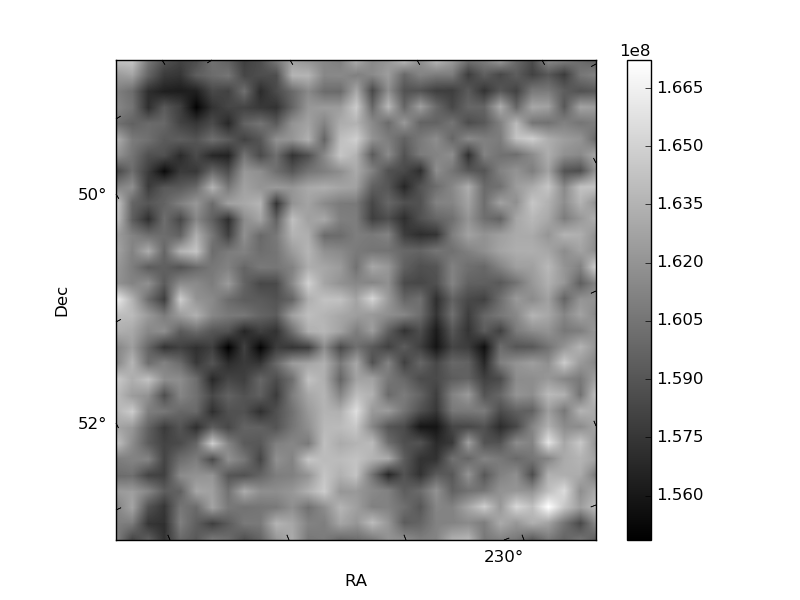
Histogram calculated using DETX and DETY for each event in the final _common_clean file
| Quadrant A |  |
 |
Quadrant B |
|---|---|---|---|
| Quadrant D |  |
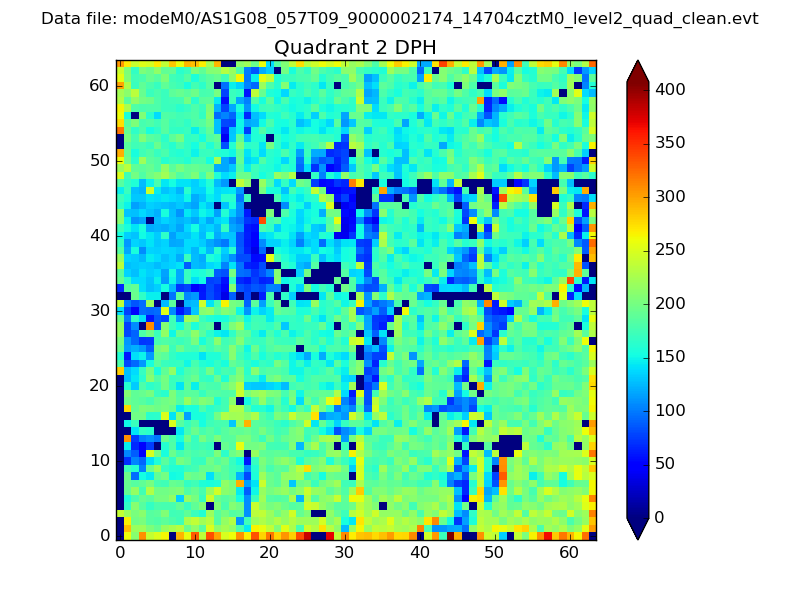 |
Quadrant C |
| Plot type | Count rate plots | Images |
|---|---|---|
| Comparison with Poisson distribution Blue bars denote a histogram of data divided into 1 sec bins. Red curve is a Poisson curve with rate = median count rate of data. |
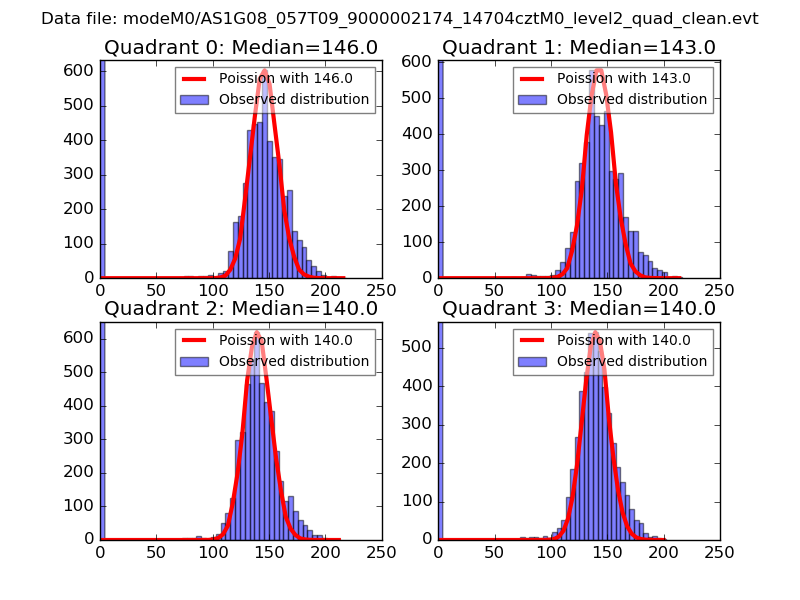 |
 |
| Quadrant-wise count rates Data is divided into 100 sec bins |
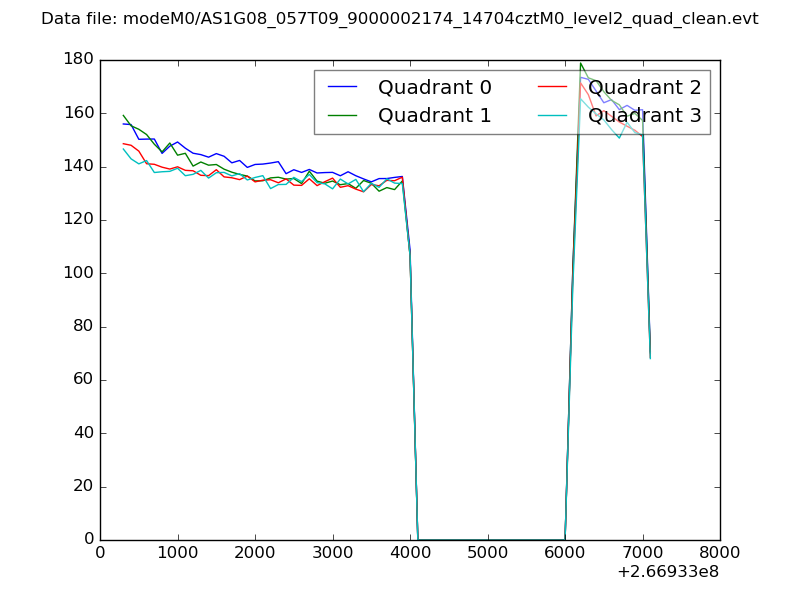 |
|
| Module-wise count rates for Quadrant A Data is divided into 100 sec bins |
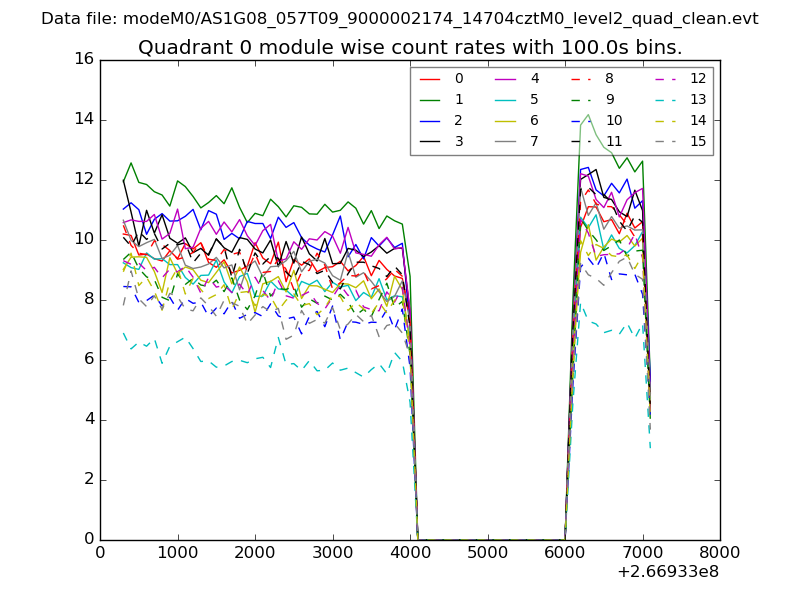 |
 |
| Module-wise count rates for Quadrant B Data is divided into 100 sec bins |
 |
 |
| Module-wise count rates for Quadrant C Data is divided into 100 sec bins |
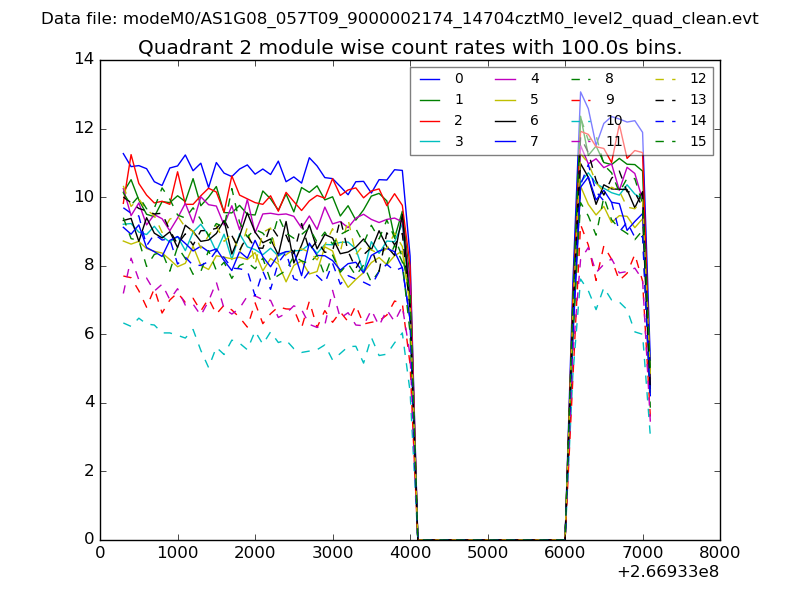 |
 |
| Module-wise count rates for Quadrant D Data is divided into 100 sec bins |
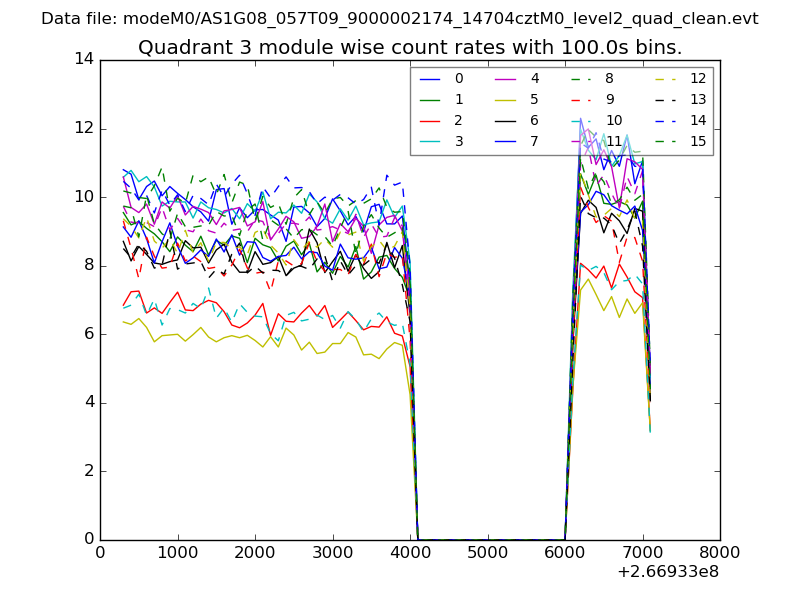 |
 |
| Parameter | Plot |
|---|---|
| CZT HV Monitor | 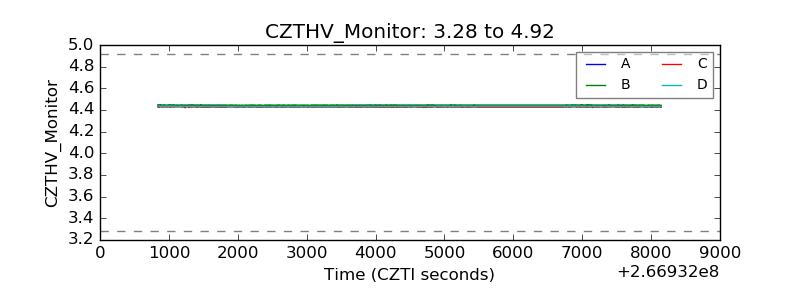 |
| D_VDD | 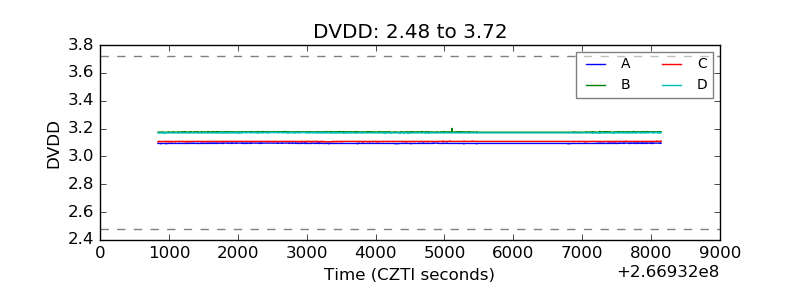 |
| Temperature 1 | 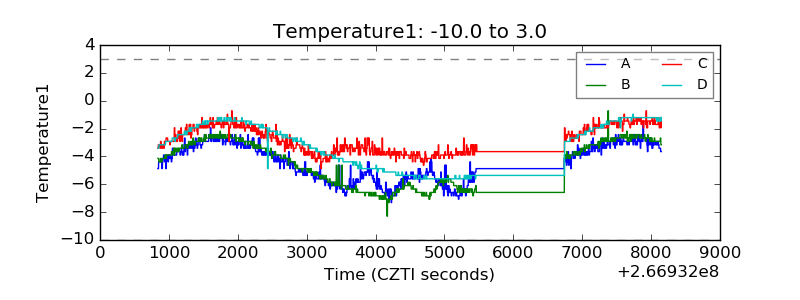 |
| Veto HV Monitor | 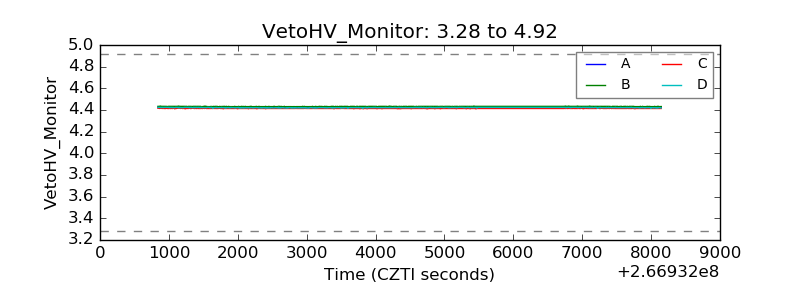 |
| Veto LLD | 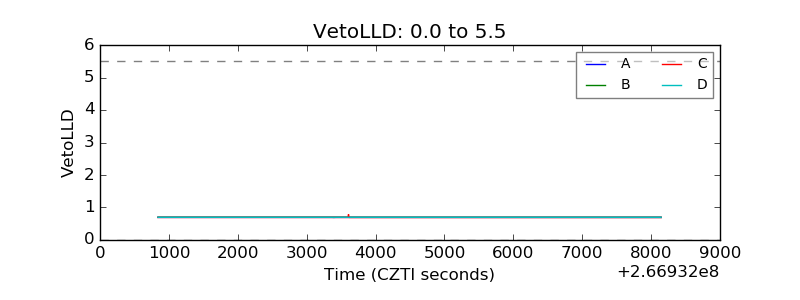 |
| Alpha Counter | 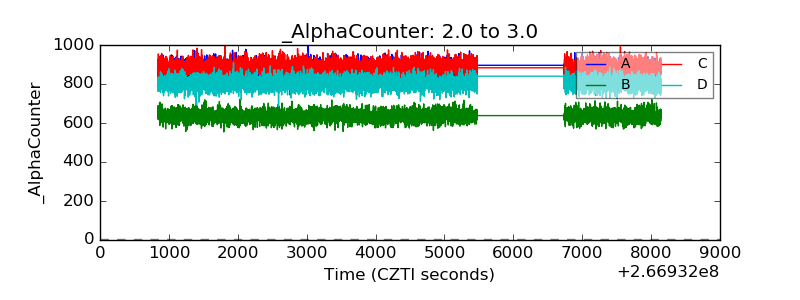 |
| _CPM_Rate | 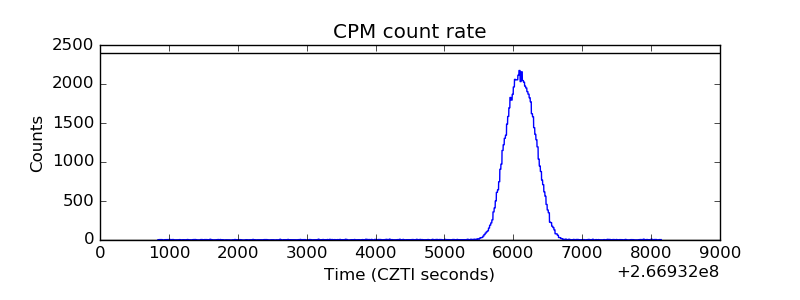 |
| CZT Counter | 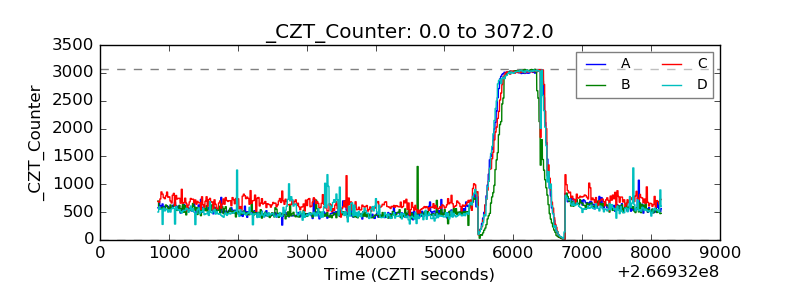 |
| +2.5 Volts monitor |  |
| +5 Volts monitor | 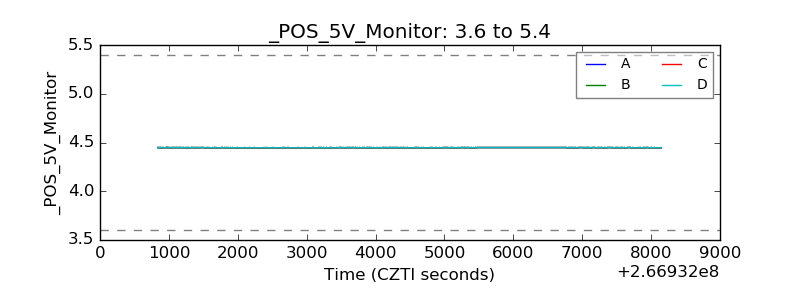 |
| _ROLL_ROT | 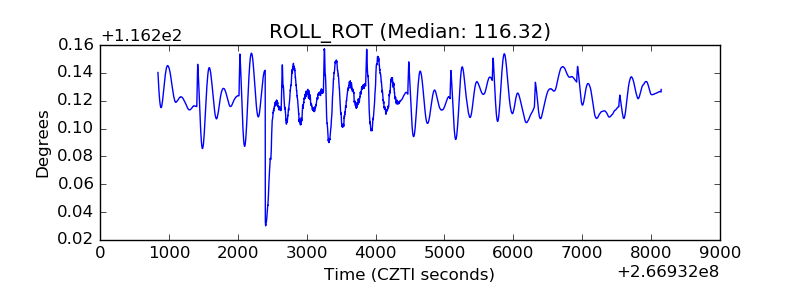 |
| _Roll_DEC | 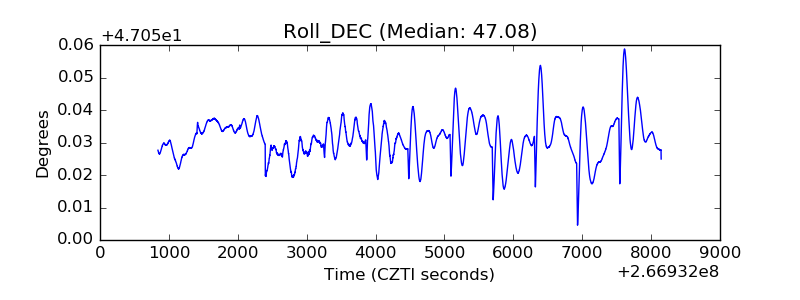 |
| _Roll_RA | 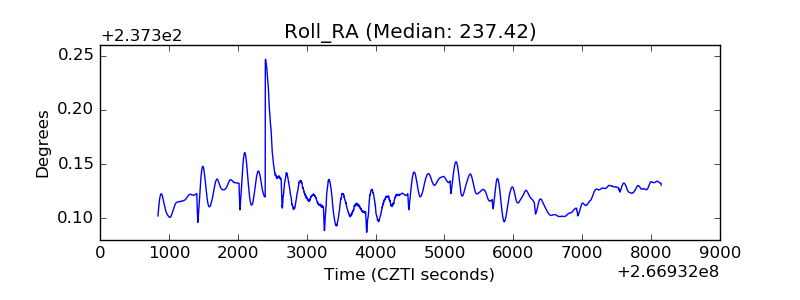 |
| Veto Counter | 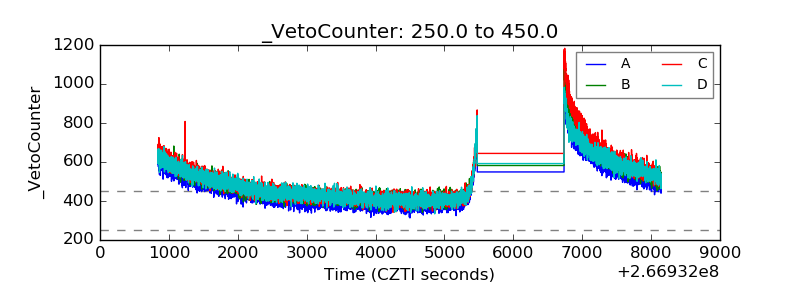 |