| Param | Original file | Final file |
|---|---|---|
| Filename | modeM0/AS1G08_057T09_9000002174_14705cztM0_level2.evt | modeM0/AS1G08_057T09_9000002174_14705cztM0_level2_quad_clean.evt |
| Size (bytes) | 496,624,320 | 116,311,680 |
| Size | 473.6 MB | 110.9 MB |
| Events in quadrant A | 3,394,422 | 787,648 |
| Events in quadrant B | 3,333,669 | 776,296 |
| Events in quadrant C | 4,624,253 | 763,969 |
| Events in quadrant D | 3,265,291 | 759,860 |
| Mode SS | |||
|---|---|---|---|
| Quadrant | BADHDUFLAG | Total packets | Discarded packets |
| A | 0 | 126 | 0 |
| B | 0 | 126 | 0 |
| C | 0 | 126 | 0 |
| D | 0 | 126 | 0 |
| Mode M0 | |||
|---|---|---|---|
| Quadrant | BADHDUFLAG | Total packets | Discarded packets |
| A | 0 | 14149 | 3 |
| B | 0 | 14006 | 2 |
| C | 0 | 18552 | 2 |
| D | 0 | 13754 | 2 |
| Mode M9 | |||
|---|---|---|---|
| Quadrant | BADHDUFLAG | Total packets | Discarded packets |
| A | 0 | 16 | 0 |
| B | 0 | 16 | 0 |
| C | 0 | 16 | 0 |
| D | 0 | 17 | 0 |
| Quadrant | Total seconds | Saturated seconds | Saturation percentage |
|---|---|---|---|
| A | 6236 | 105 | 1.683772% |
| B | 6236 | 97 | 1.555484% |
| C | 6236 | 131 | 2.100706% |
| D | 6236 | 86 | 1.379089% |
Noise dominated data is calculated using 1-second bins in cleaned event files. If a bin has >2000 counts, and if more than 50% of those come from <1% of pixels, then it is considered to be noise-dominated and hence unusable.
| Quadrant | # 1 sec bins | Bins with >0 counts | Bins with >2000 counts | High rate bins dominated by noise | Noise dominated (total time) | Noise dominated (detector-on time) | Marked lightcurve |
|---|---|---|---|---|---|---|---|
| A | 7527 | 6237 | 2 | 2 | 0.03% | 0.03% | 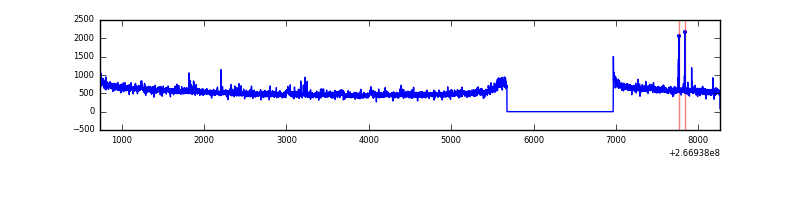 |
| B | 7527 | 6237 | 0 | 0 | 0.00% | 0.00% | 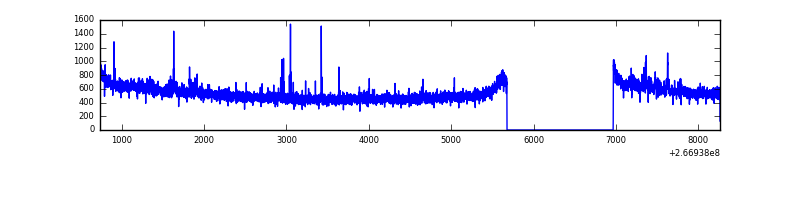 |
| C | 7527 | 6237 | 18 | 18 | 0.24% | 0.29% | 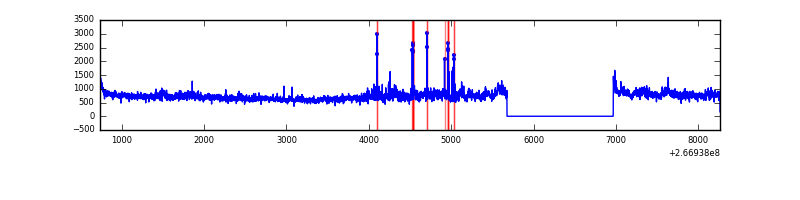 |
| D | 7527 | 6237 | 1 | 1 | 0.01% | 0.02% | 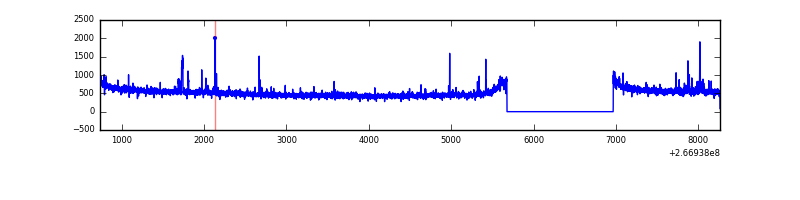 |
Top three noisy pixels from each quadrant. If the there are fewer than three noisy pixels in the level2.evt file, extra rows are filled as -1
| Pixel properties | Quadrant properties | ||||||
|---|---|---|---|---|---|---|---|
| Quadrant | DetID | PixID | Counts | Sigma | Mean | Median | Sigma |
| A | 12 | 189 | 69053 | 403.07 | 854 | 839 | 169.2 |
| A | 9 | 143 | 17591 | 98.99 | 854 | 839 | 169.2 |
| A | 8 | 15 | 14551 | 81.02 | 854 | 839 | 169.2 |
| B | 0 | 205 | 24021 | 149.03 | 838 | 822 | 155.7 |
| B | 0 | 214 | 20448 | 126.08 | 838 | 822 | 155.7 |
| B | 12 | 111 | 17512 | 107.22 | 838 | 822 | 155.7 |
| C | 3 | 233 | 1394899 | 7388.17 | 827 | 832 | 188.7 |
| C | 13 | 61 | 5882 | 26.76 | 827 | 832 | 188.7 |
| C | 0 | 207 | 2883 | 10.87 | 827 | 832 | 188.7 |
| D | 12 | 110 | 34284 | 166.4 | 834 | 815 | 201.1 |
| D | 1 | 255 | 23948 | 115.01 | 834 | 815 | 201.1 |
| D | 2 | 234 | 23369 | 112.14 | 834 | 815 | 201.1 |
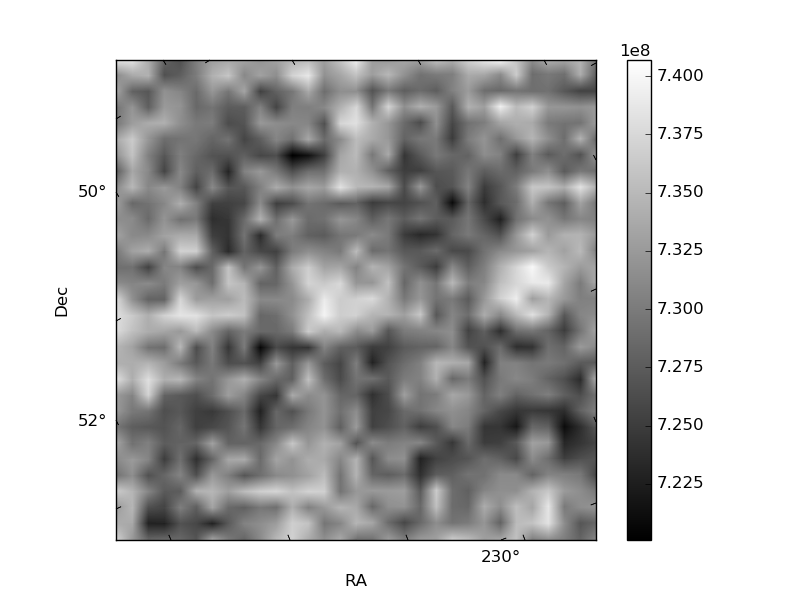
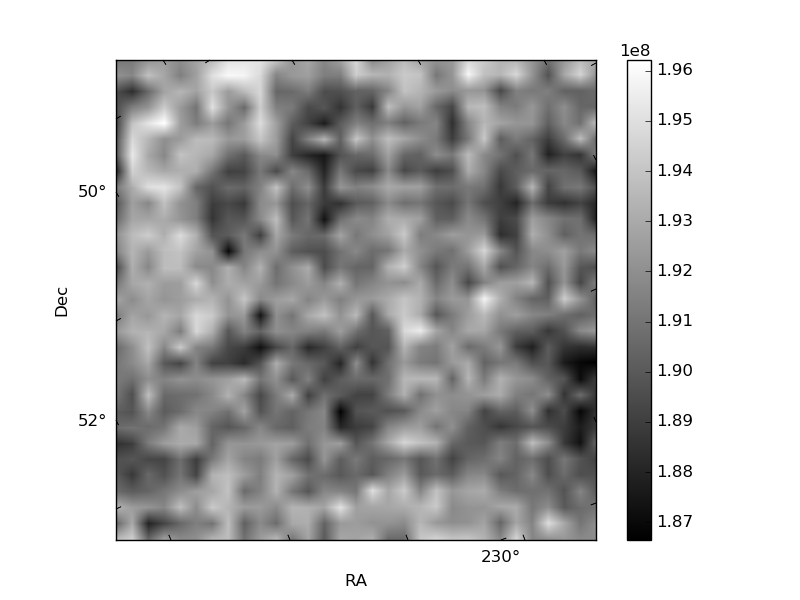
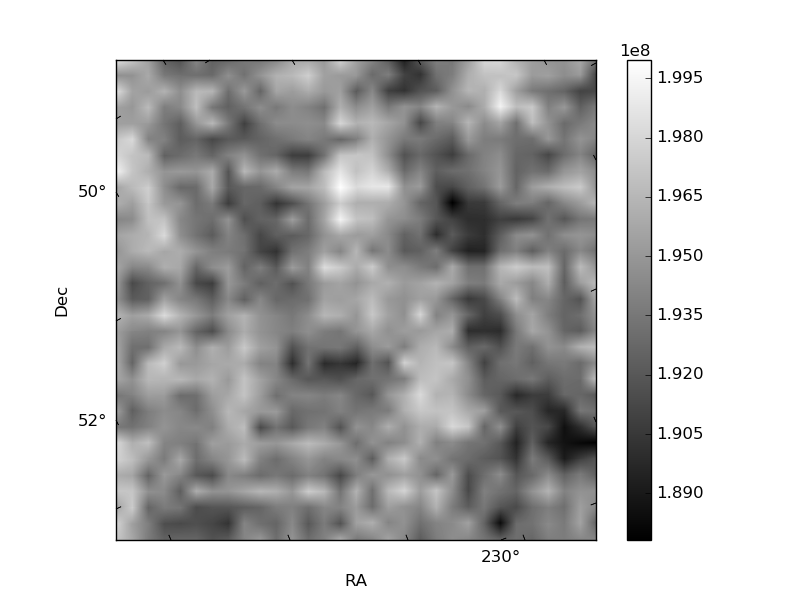
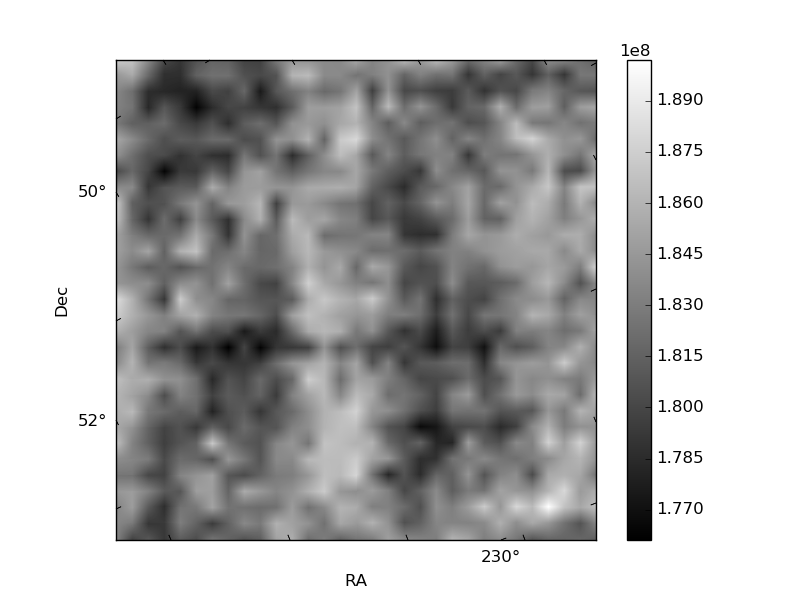
Histogram calculated using DETX and DETY for each event in the final _common_clean file
| Quadrant A | 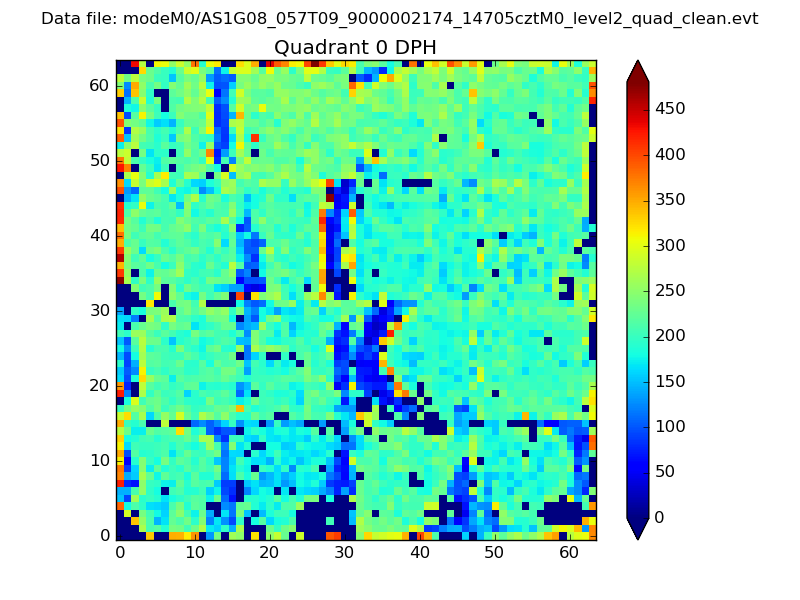 |
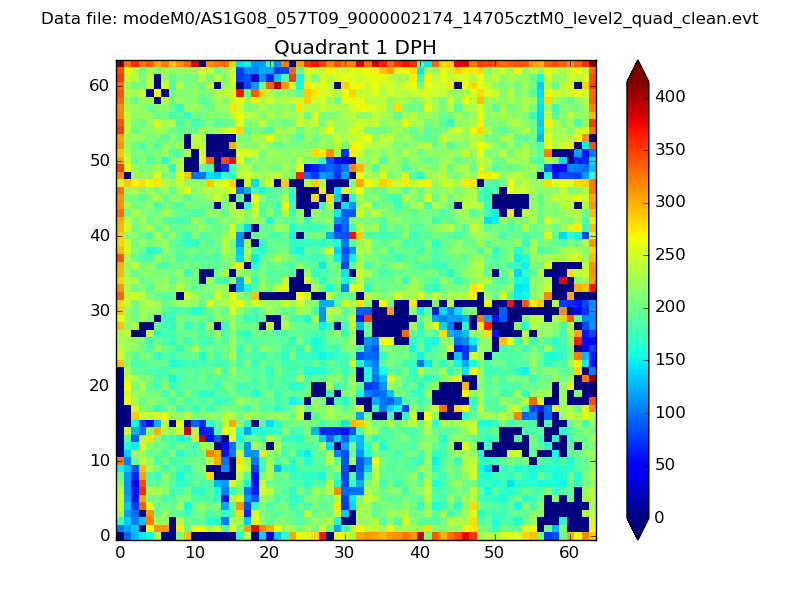 |
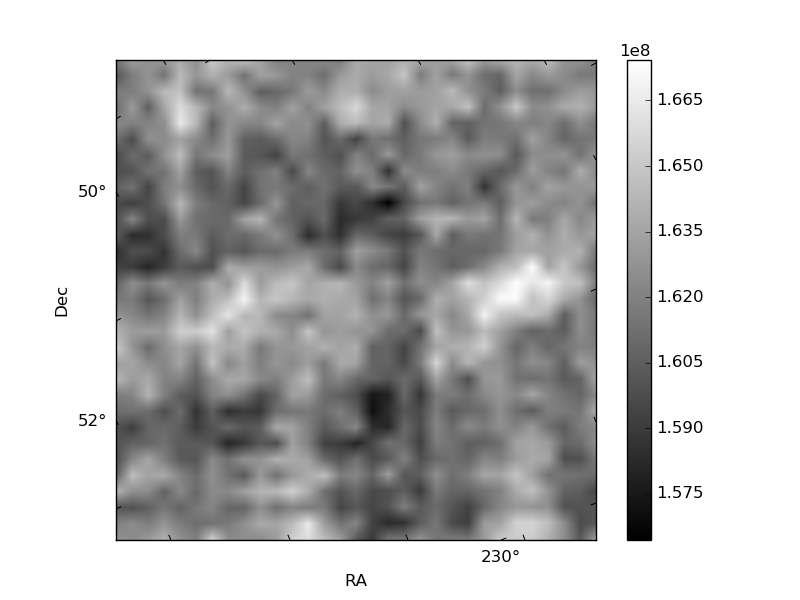
Quadrant B |
|---|---|---|---|
| Quadrant D | 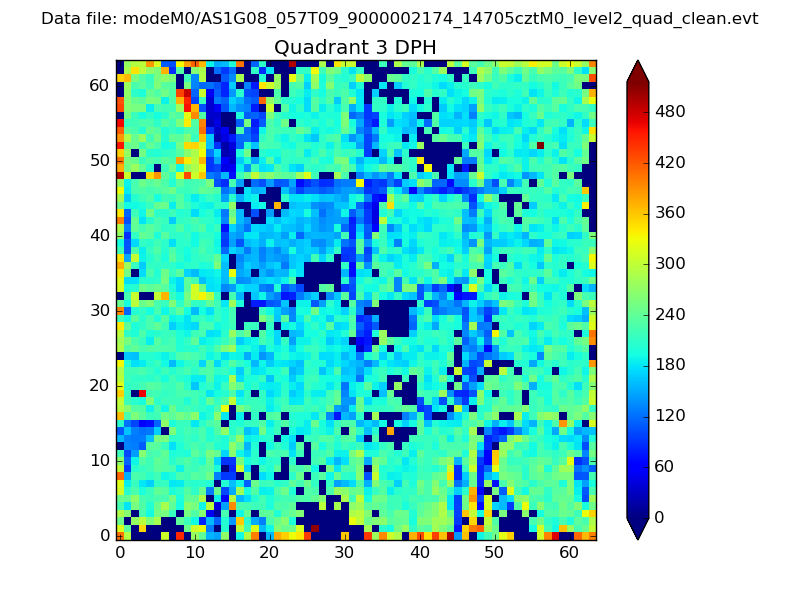 |
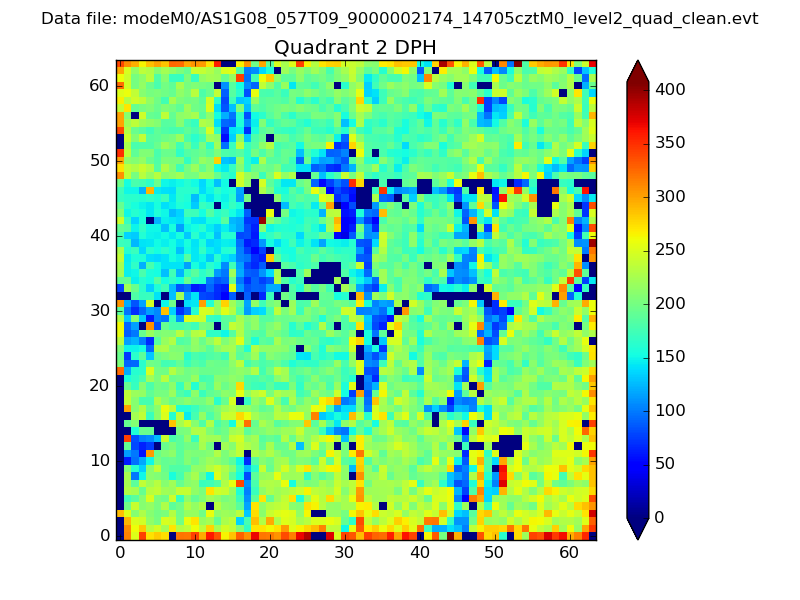 |
Quadrant C |
| Plot type | Count rate plots | Images |
|---|---|---|
| Comparison with Poisson distribution Blue bars denote a histogram of data divided into 1 sec bins. Red curve is a Poisson curve with rate = median count rate of data. |
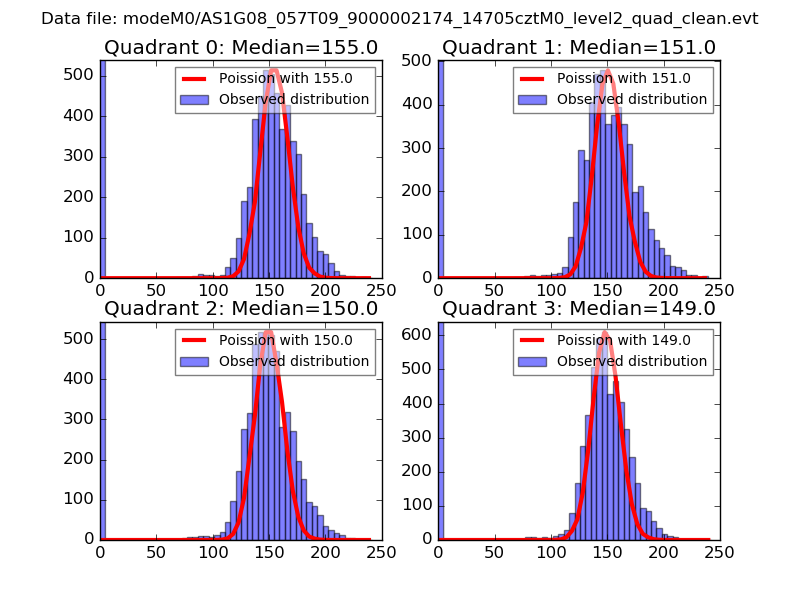 |
 |
| Quadrant-wise count rates Data is divided into 100 sec bins |
 |
|
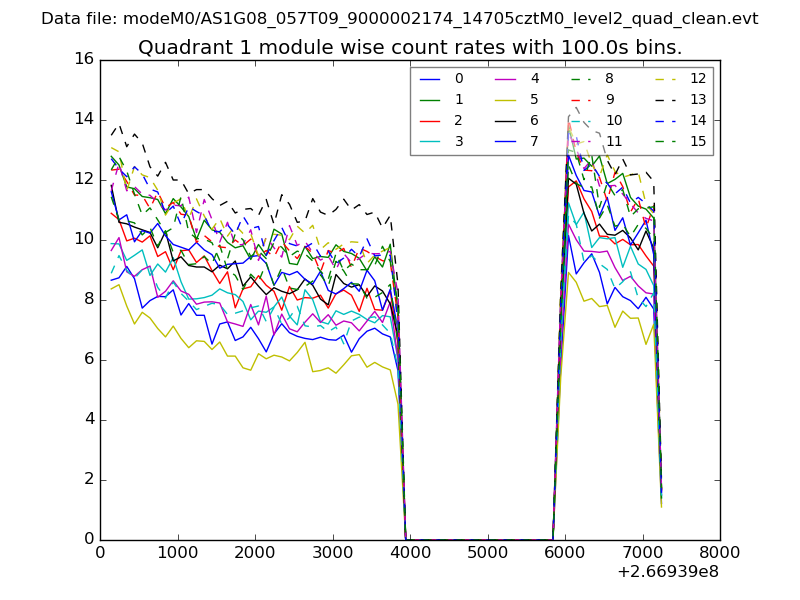
| Module-wise count rates for Quadrant A Data is divided into 100 sec bins |
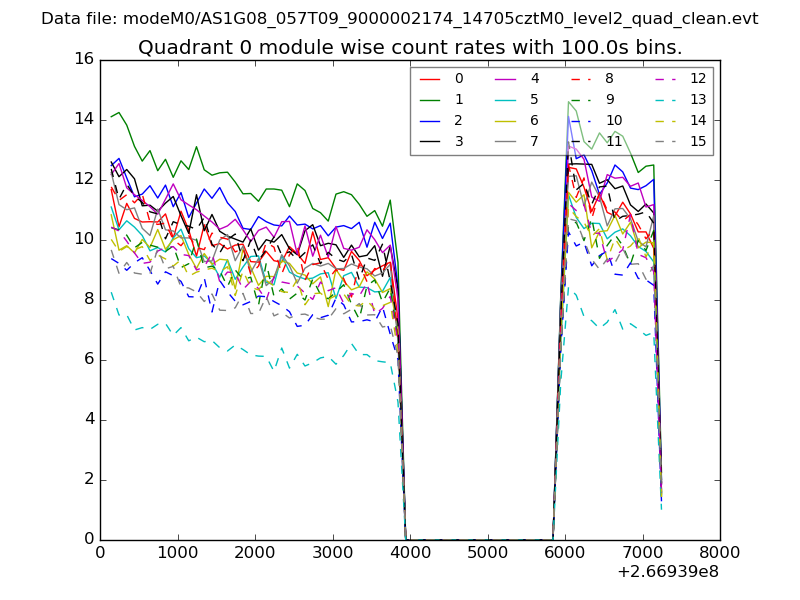 |
 |
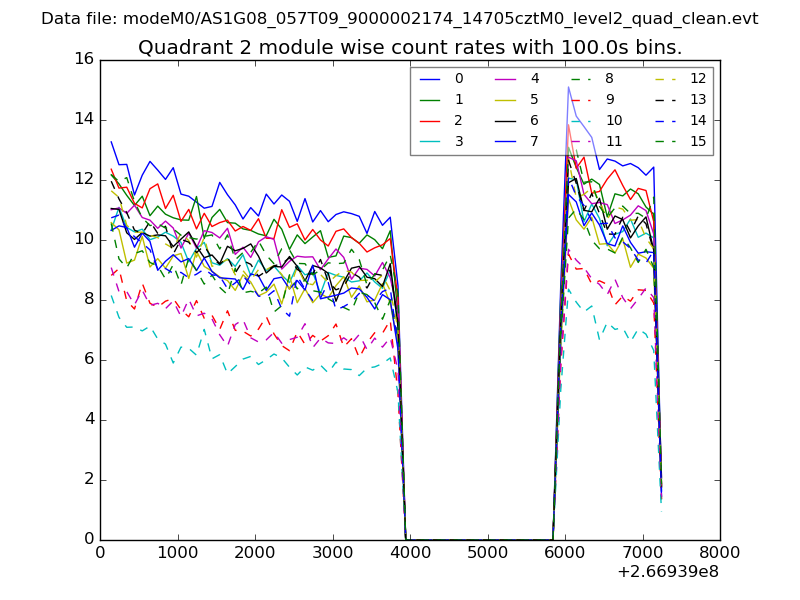
| Module-wise count rates for Quadrant B Data is divided into 100 sec bins |
 |
 |
| Module-wise count rates for Quadrant C Data is divided into 100 sec bins |
 |
 |
| Module-wise count rates for Quadrant D Data is divided into 100 sec bins |
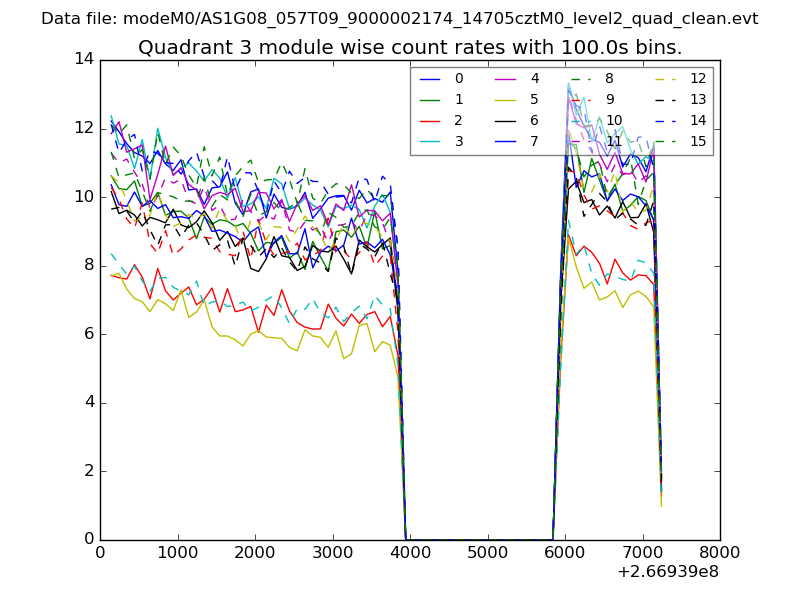 |
 |
| Parameter | Plot |
|---|---|
| CZT HV Monitor | 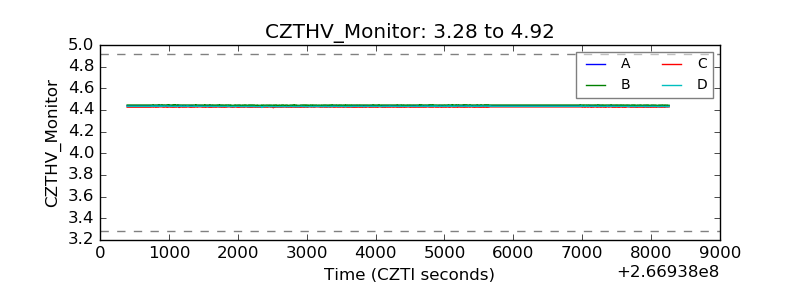 |
| D_VDD | 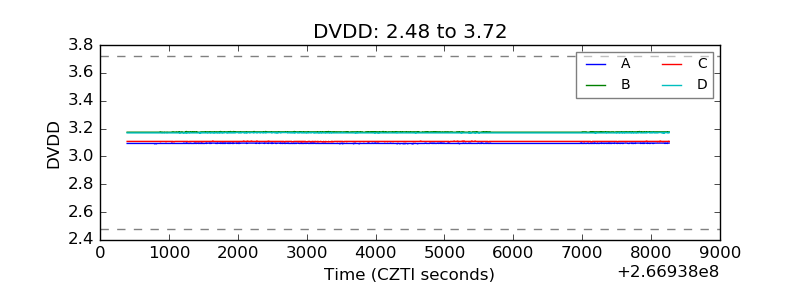 |
| Temperature 1 | 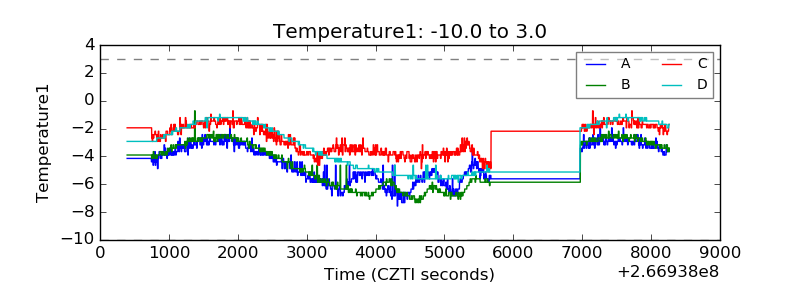 |
| Veto HV Monitor | 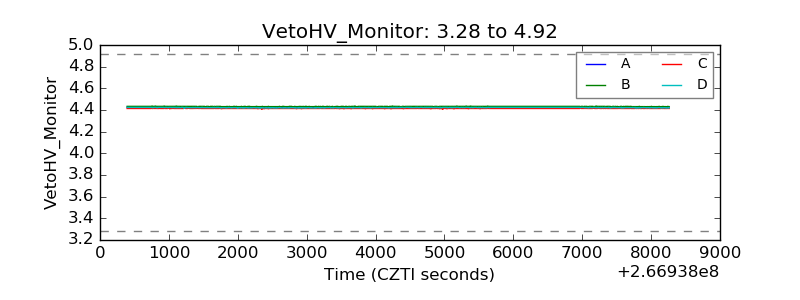 |
| Veto LLD | 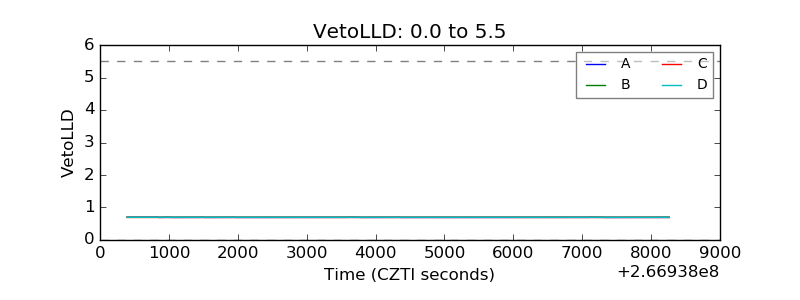 |
| Alpha Counter |  |
| _CPM_Rate | 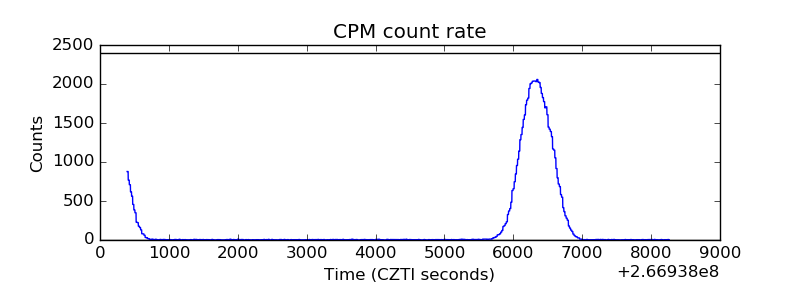 |
| CZT Counter | 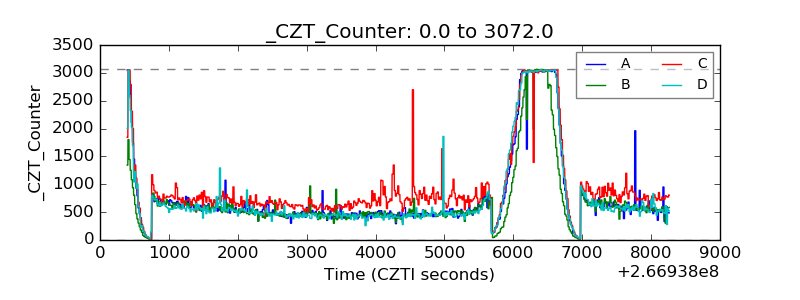 |
| +2.5 Volts monitor |  |
| +5 Volts monitor |  |
| _ROLL_ROT | 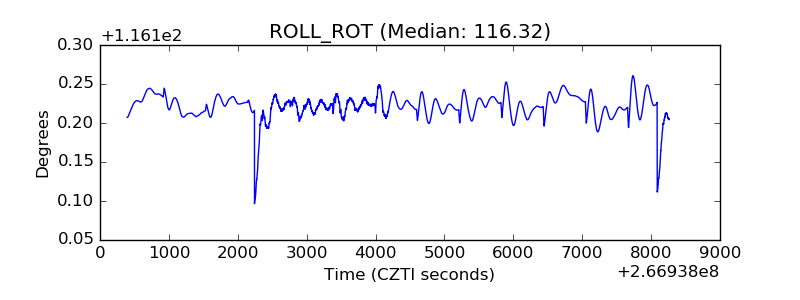 |
| _Roll_DEC | 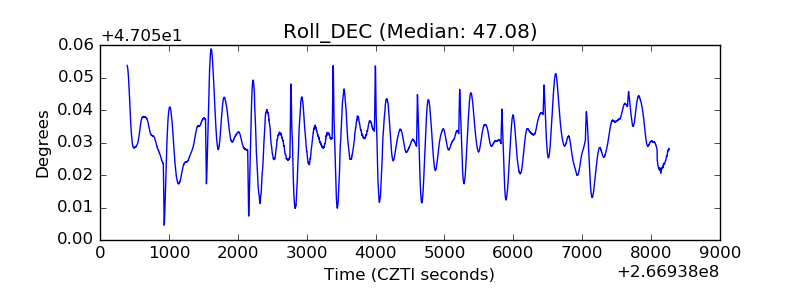 |
| _Roll_RA | 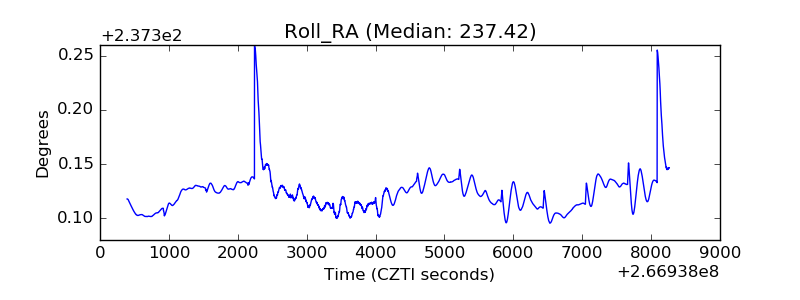 |
| Veto Counter | 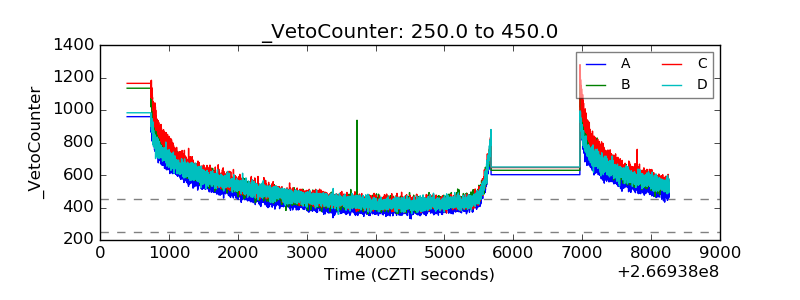 |