| Param | Original file | Final file |
|---|---|---|
| Filename | modeM0/AS1G08_057T09_9000002174_14707cztM0_level2.evt | modeM0/AS1G08_057T09_9000002174_14707cztM0_level2_quad_clean.evt |
| Size (bytes) | 440,674,560 | 101,750,400 |
| Size | 420.3 MB | 97.0 MB |
| Events in quadrant A | 3,151,937 | 669,921 |
| Events in quadrant B | 3,134,175 | 661,928 |
| Events in quadrant C | 3,583,875 | 664,803 |
| Events in quadrant D | 3,053,939 | 651,530 |
| Mode SS | |||
|---|---|---|---|
| Quadrant | BADHDUFLAG | Total packets | Discarded packets |
| A | 0 | 126 | 0 |
| B | 0 | 126 | 0 |
| C | 0 | 126 | 0 |
| D | 0 | 126 | 0 |
| Mode M0 | |||
|---|---|---|---|
| Quadrant | BADHDUFLAG | Total packets | Discarded packets |
| A | 0 | 13382 | 3 |
| B | 0 | 13246 | 2 |
| C | 0 | 14636 | 2 |
| D | 0 | 13201 | 2 |
| Mode M9 | |||
|---|---|---|---|
| Quadrant | BADHDUFLAG | Total packets | Discarded packets |
| A | 0 | 13 | 0 |
| B | 0 | 13 | 0 |
| C | 0 | 13 | 0 |
| D | 0 | 14 | 0 |
| Quadrant | Total seconds | Saturated seconds | Saturation percentage |
|---|---|---|---|
| A | 6210 | 48 | 0.772947% |
| B | 6210 | 65 | 1.046699% |
| C | 6210 | 73 | 1.175523% |
| D | 6210 | 49 | 0.789050% |
Noise dominated data is calculated using 1-second bins in cleaned event files. If a bin has >2000 counts, and if more than 50% of those come from <1% of pixels, then it is considered to be noise-dominated and hence unusable.
| Quadrant | # 1 sec bins | Bins with >0 counts | Bins with >2000 counts | High rate bins dominated by noise | Noise dominated (total time) | Noise dominated (detector-on time) | Marked lightcurve |
|---|---|---|---|---|---|---|---|
| A | 7426 | 6212 | 2 | 2 | 0.03% | 0.03% | 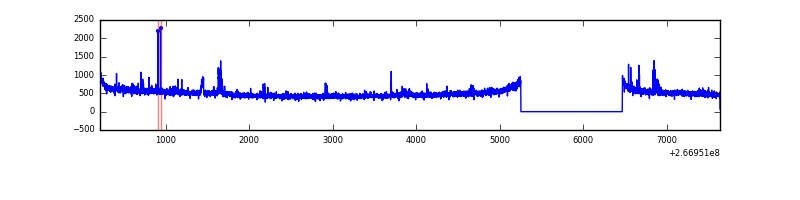 |
| B | 7426 | 6211 | 3 | 3 | 0.04% | 0.05% | 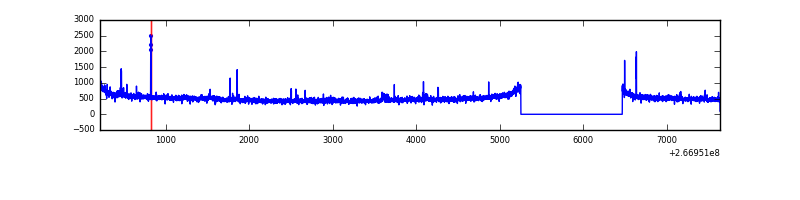 |
| C | 7426 | 6211 | 0 | 0 | 0.00% | 0.00% | 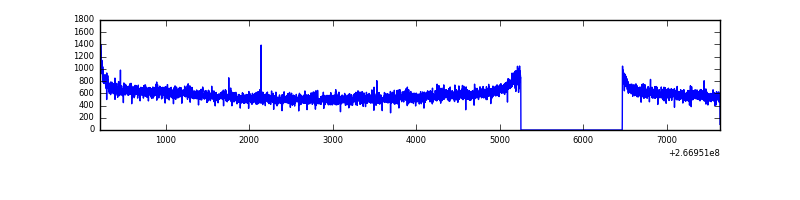 |
| D | 7426 | 6212 | 2 | 2 | 0.03% | 0.03% | 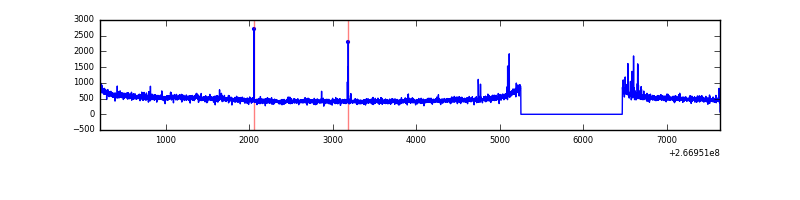 |
Top three noisy pixels from each quadrant. If the there are fewer than three noisy pixels in the level2.evt file, extra rows are filled as -1
| Pixel properties | Quadrant properties | ||||||
|---|---|---|---|---|---|---|---|
| Quadrant | DetID | PixID | Counts | Sigma | Mean | Median | Sigma |
| A | 12 | 189 | 42016 | 259.82 | 792 | 776 | 158.7 |
| A | 3 | 1 | 29154 | 178.78 | 792 | 776 | 158.7 |
| A | 8 | 15 | 14045 | 83.6 | 792 | 776 | 158.7 |
| B | 0 | 214 | 23678 | 155.98 | 786 | 768 | 146.9 |
| B | 10 | 247 | 17732 | 115.49 | 786 | 768 | 146.9 |
| B | 12 | 111 | 16854 | 109.52 | 786 | 768 | 146.9 |
| C | 3 | 233 | 536639 | 3014.86 | 781 | 788 | 177.7 |
| C | 13 | 61 | 5390 | 25.89 | 781 | 788 | 177.7 |
| C | 3 | 234 | 2151 | 7.67 | 781 | 788 | 177.7 |
| D | 13 | 172 | 28213 | 133.02 | 777 | 763 | 206.4 |
| D | 2 | 152 | 22244 | 104.1 | 777 | 763 | 206.4 |
| D | 2 | 234 | 21921 | 102.53 | 777 | 763 | 206.4 |
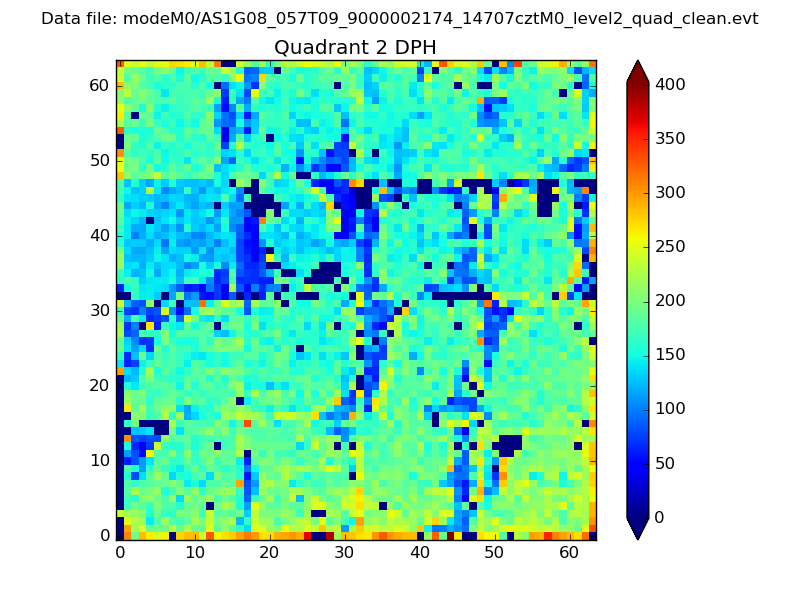
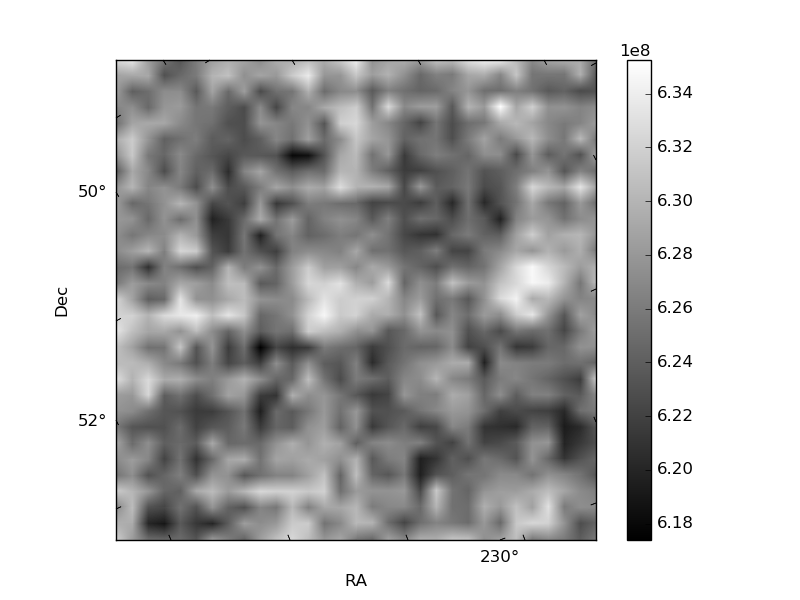
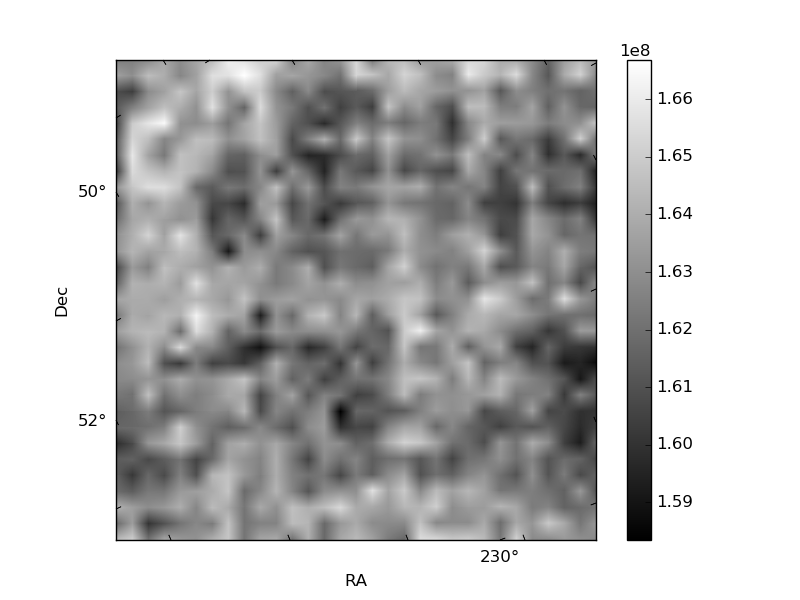
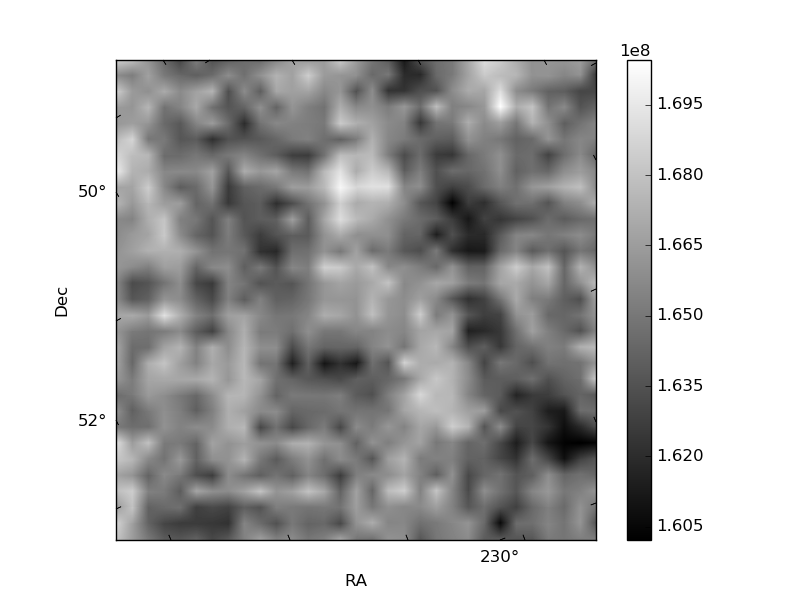
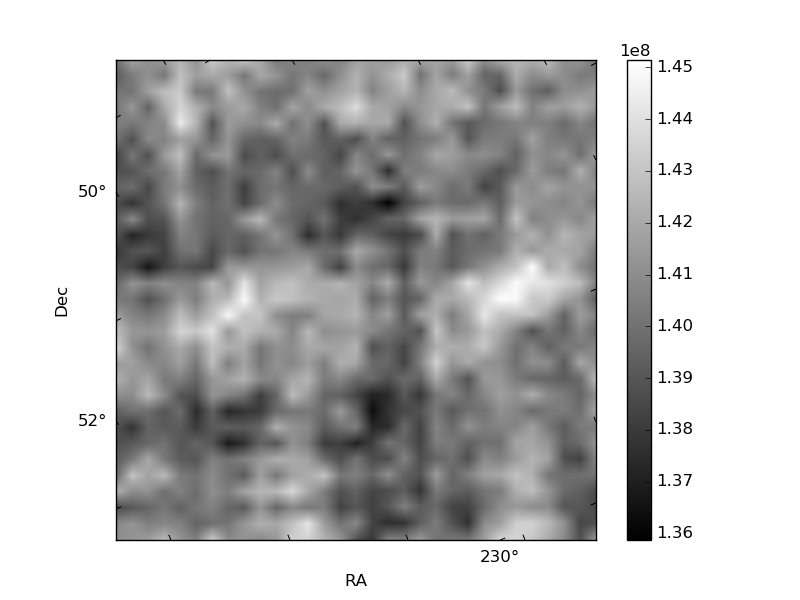
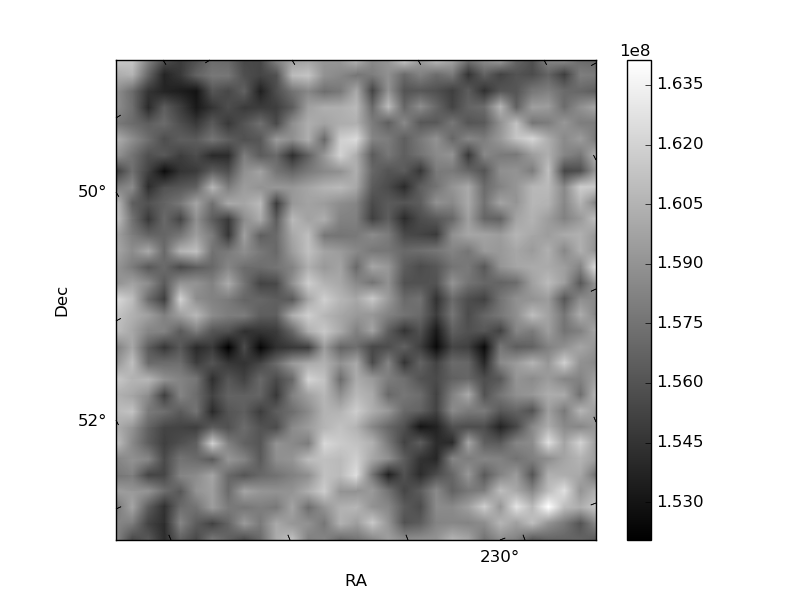
Histogram calculated using DETX and DETY for each event in the final _common_clean file
| Quadrant A | 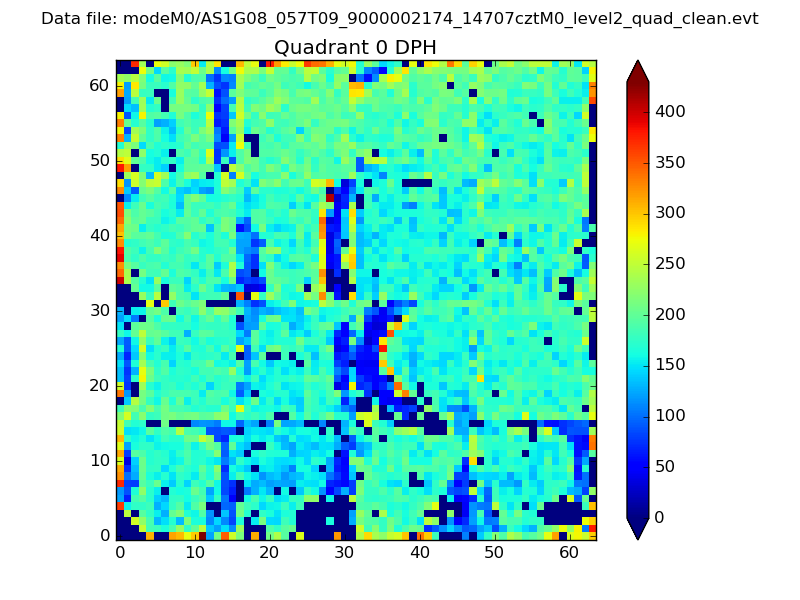 |
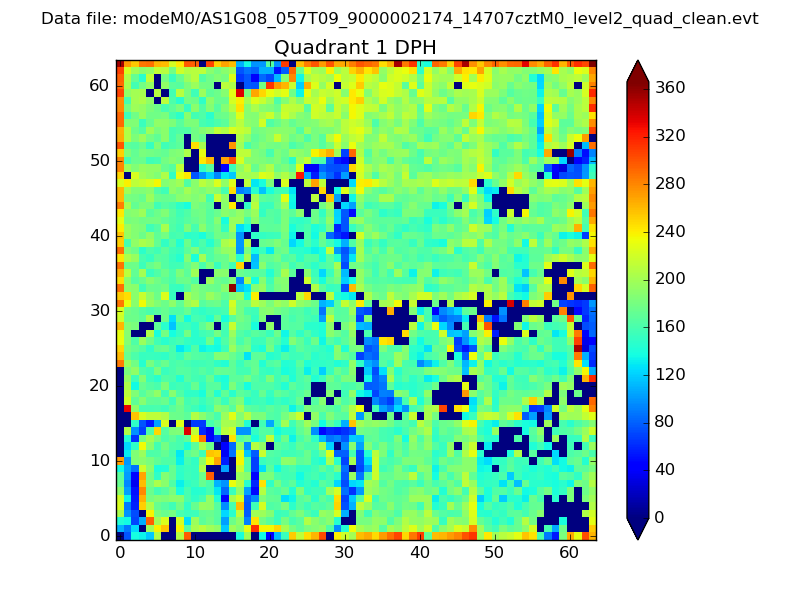 |
Quadrant B |
|---|---|---|---|
| Quadrant D | 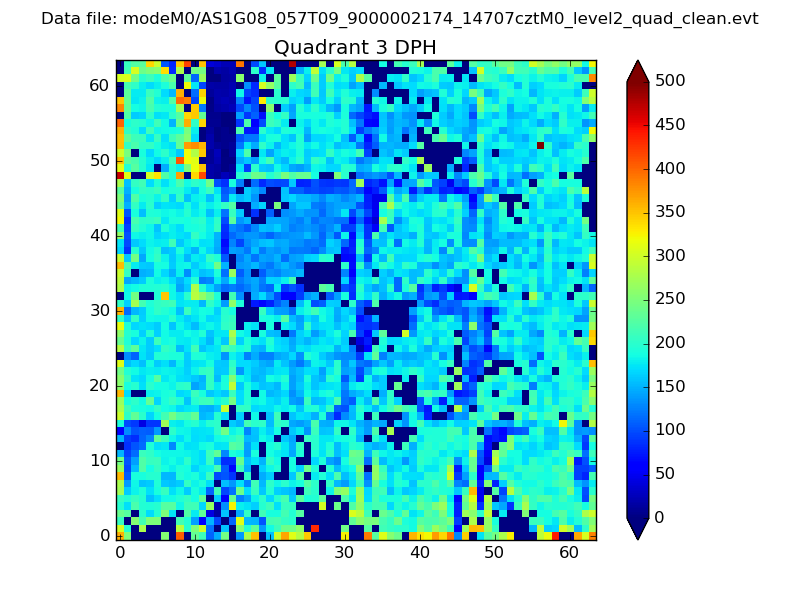 |
 |
Quadrant C |
| Plot type | Count rate plots | Images |
|---|---|---|
| Comparison with Poisson distribution Blue bars denote a histogram of data divided into 1 sec bins. Red curve is a Poisson curve with rate = median count rate of data. |
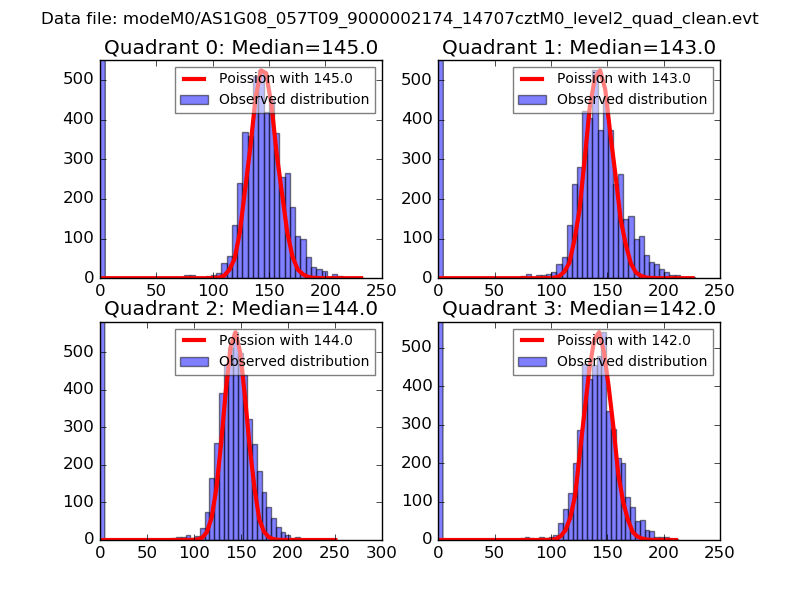 |
 |
| Quadrant-wise count rates Data is divided into 100 sec bins |
 |
|
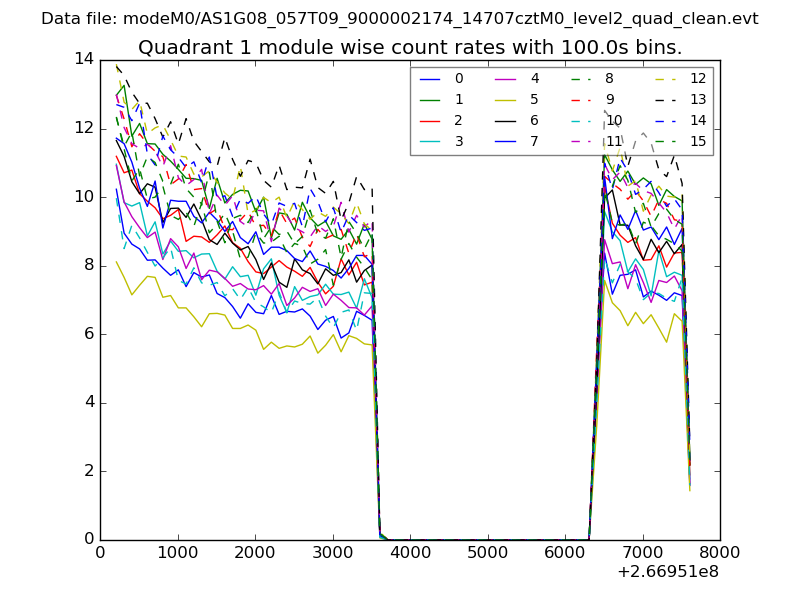
| Module-wise count rates for Quadrant A Data is divided into 100 sec bins |
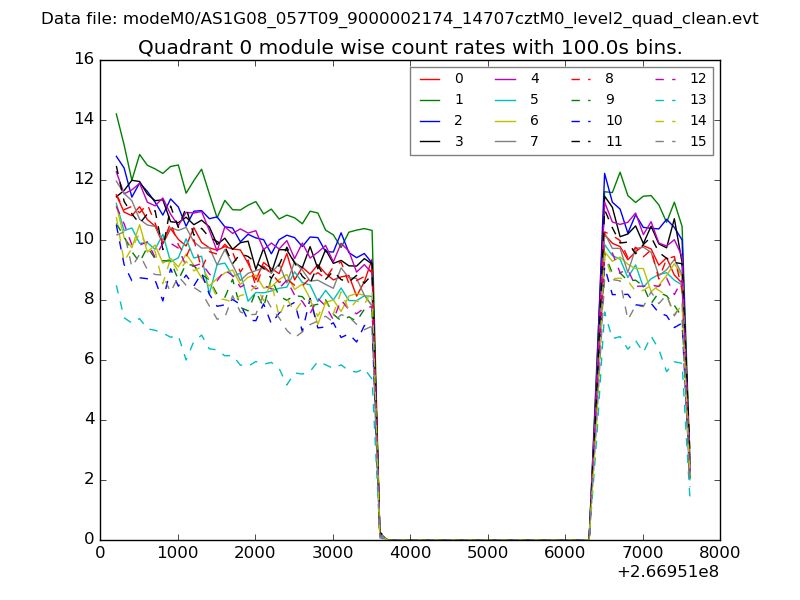 |
 |
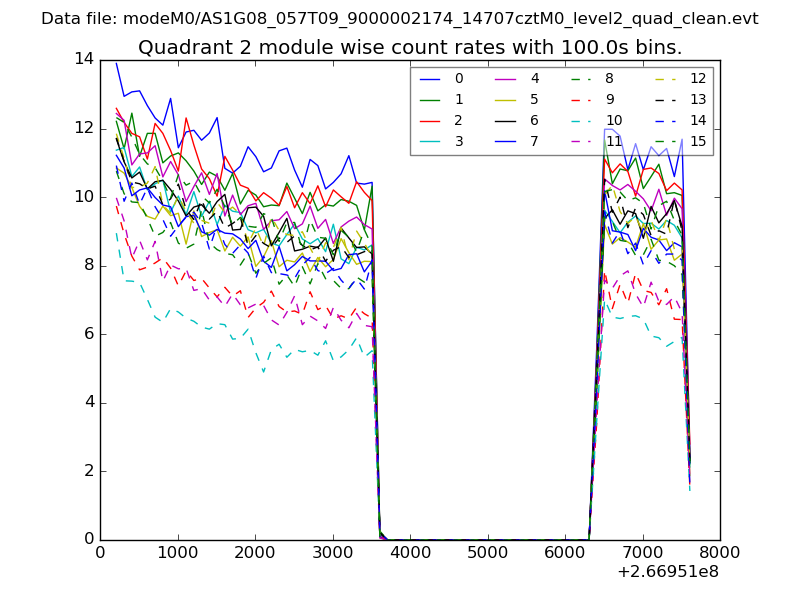
| Module-wise count rates for Quadrant B Data is divided into 100 sec bins |
 |
 |
| Module-wise count rates for Quadrant C Data is divided into 100 sec bins |
 |
 |
| Module-wise count rates for Quadrant D Data is divided into 100 sec bins |
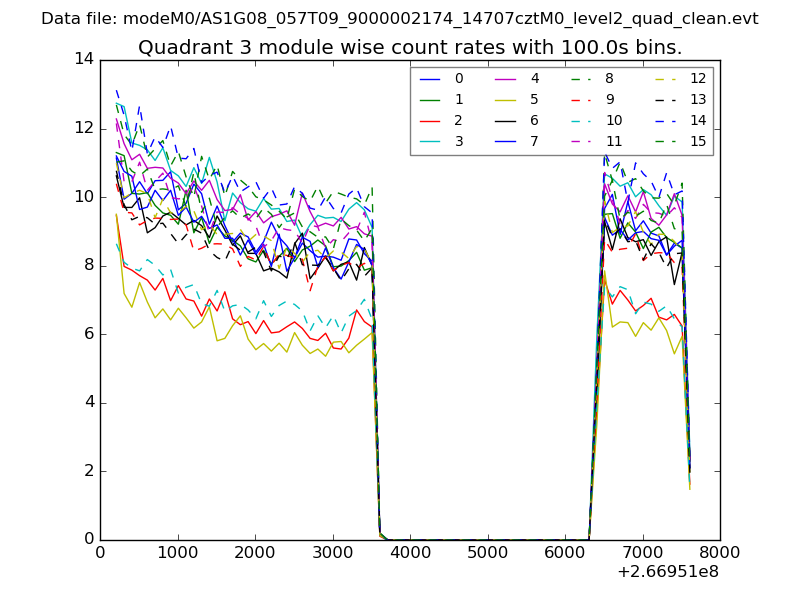 |
 |
| Parameter | Plot |
|---|---|
| CZT HV Monitor | 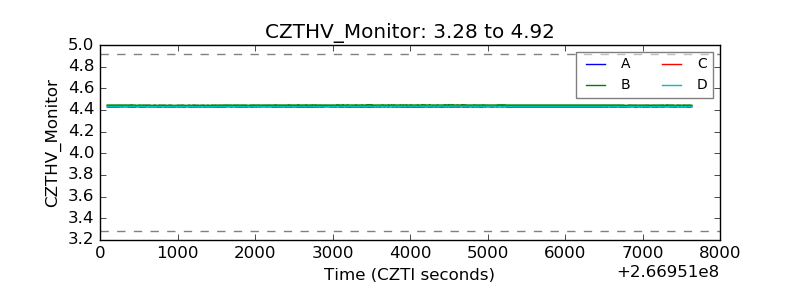 |
| D_VDD | 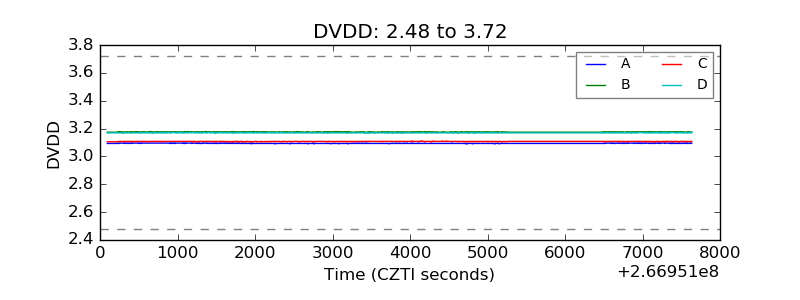 |
| Temperature 1 |  |
| Veto HV Monitor | 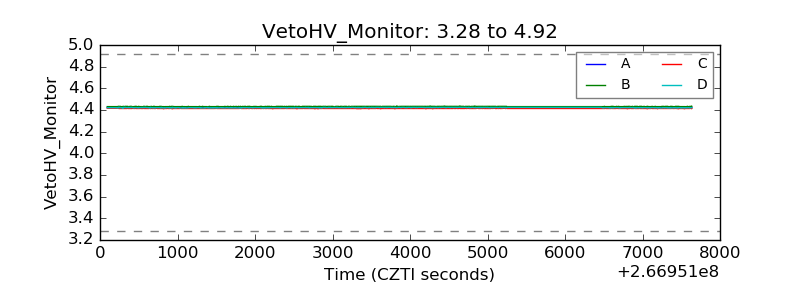 |
| Veto LLD | 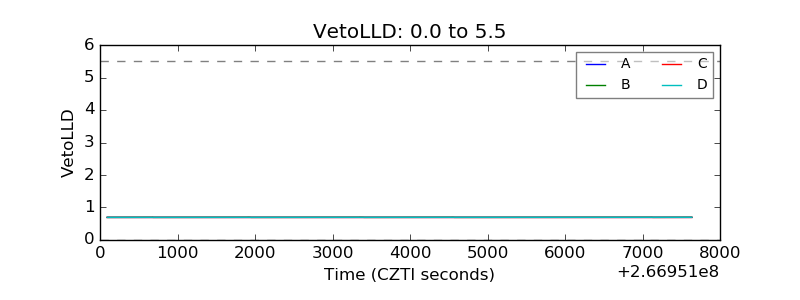 |
| Alpha Counter | 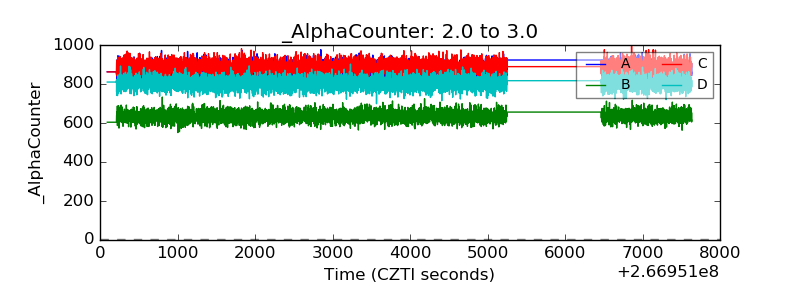 |
| _CPM_Rate | 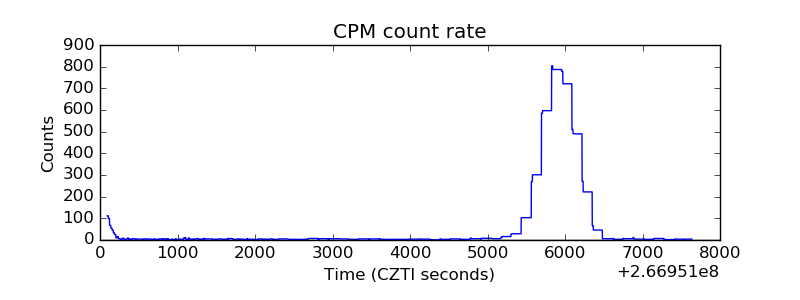 |
| CZT Counter | 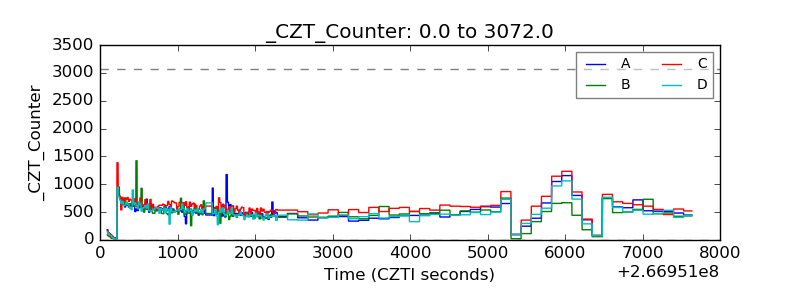 |
| +2.5 Volts monitor |  |
| +5 Volts monitor |  |
| _ROLL_ROT | 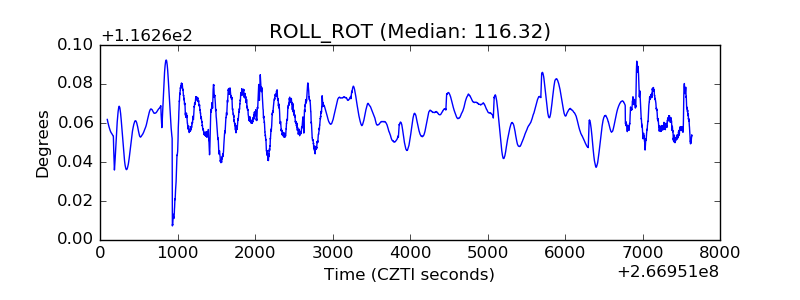 |
| _Roll_DEC | 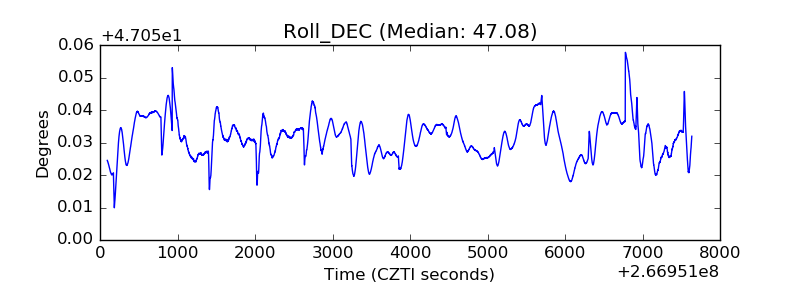 |
| _Roll_RA | 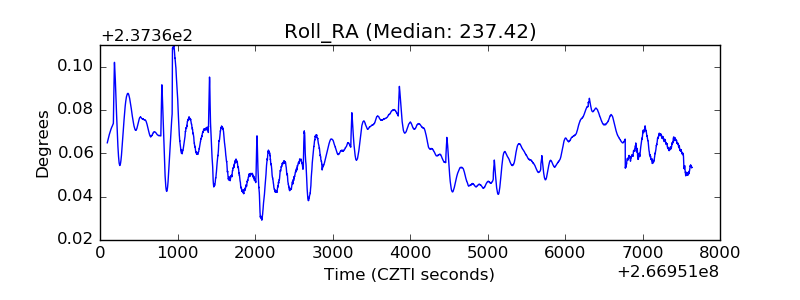 |
| Veto Counter | 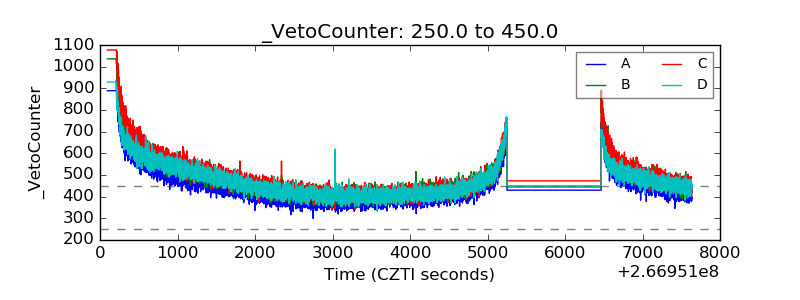 |