| Param | Original file | Final file |
|---|---|---|
| Filename | modeM0/AS1G08_057T09_9000002174_14708cztM0_level2.evt | modeM0/AS1G08_057T09_9000002174_14708cztM0_level2_quad_clean.evt |
| Size (bytes) | 449,933,760 | 95,990,400 |
| Size | 429.1 MB | 91.5 MB |
| Events in quadrant A | 3,173,406 | 619,976 |
| Events in quadrant B | 3,156,594 | 611,249 |
| Events in quadrant C | 3,777,080 | 611,339 |
| Events in quadrant D | 3,070,858 | 604,496 |
| Mode SS | |||
|---|---|---|---|
| Quadrant | BADHDUFLAG | Total packets | Discarded packets |
| A | 0 | 134 | 0 |
| B | 0 | 134 | 0 |
| C | 0 | 134 | 0 |
| D | 0 | 134 | 0 |
| Mode M0 | |||
|---|---|---|---|
| Quadrant | BADHDUFLAG | Total packets | Discarded packets |
| A | 0 | 13743 | 3 |
| B | 0 | 13780 | 2 |
| C | 0 | 15359 | 2 |
| D | 0 | 13750 | 2 |
| Mode M9 | |||
|---|---|---|---|
| Quadrant | BADHDUFLAG | Total packets | Discarded packets |
| A | 0 | 16 | 0 |
| B | 0 | 16 | 0 |
| C | 0 | 16 | 0 |
| D | 0 | 17 | 0 |
| Quadrant | Total seconds | Saturated seconds | Saturation percentage |
|---|---|---|---|
| A | 6598 | 19 | 0.287966% |
| B | 6598 | 27 | 0.409215% |
| C | 6598 | 33 | 0.500152% |
| D | 6598 | 21 | 0.318278% |
Noise dominated data is calculated using 1-second bins in cleaned event files. If a bin has >2000 counts, and if more than 50% of those come from <1% of pixels, then it is considered to be noise-dominated and hence unusable.
| Quadrant | # 1 sec bins | Bins with >0 counts | Bins with >2000 counts | High rate bins dominated by noise | Noise dominated (total time) | Noise dominated (detector-on time) | Marked lightcurve |
|---|---|---|---|---|---|---|---|
| A | 7574 | 6600 | 0 | 0 | 0.00% | 0.00% | 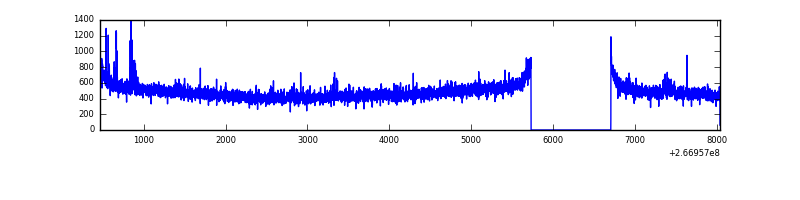 |
| B | 7574 | 6600 | 1 | 1 | 0.01% | 0.02% | 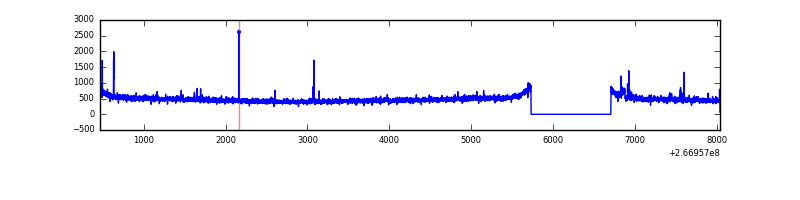 |
| C | 7574 | 6600 | 0 | 0 | 0.00% | 0.00% | 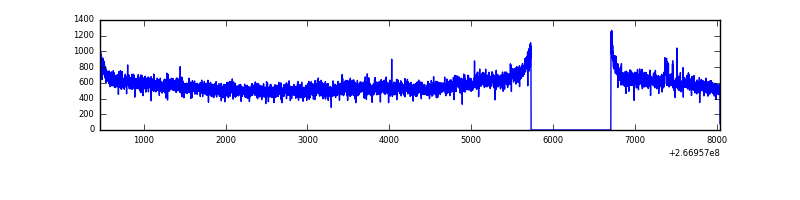 |
| D | 7574 | 6600 | 4 | 4 | 0.05% | 0.06% | 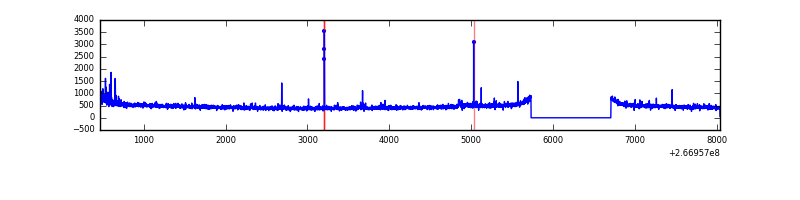 |
Top three noisy pixels from each quadrant. If the there are fewer than three noisy pixels in the level2.evt file, extra rows are filled as -1
| Pixel properties | Quadrant properties | ||||||
|---|---|---|---|---|---|---|---|
| Quadrant | DetID | PixID | Counts | Sigma | Mean | Median | Sigma |
| A | 3 | 1 | 25700 | 154.29 | 802 | 783 | 161.5 |
| A | 1 | 162 | 22908 | 137.0 | 802 | 783 | 161.5 |
| A | 11 | 29 | 11915 | 68.93 | 802 | 783 | 161.5 |
| B | 12 | 111 | 17455 | 110.02 | 797 | 775 | 151.6 |
| B | 0 | 228 | 16572 | 104.2 | 797 | 775 | 151.6 |
| B | 11 | 111 | 14915 | 93.27 | 797 | 775 | 151.6 |
| C | 3 | 233 | 698660 | 3839.84 | 788 | 793 | 181.7 |
| C | 3 | 234 | 6504 | 31.42 | 788 | 793 | 181.7 |
| C | 13 | 61 | 5521 | 26.01 | 788 | 793 | 181.7 |
| D | 13 | 172 | 30489 | 151.18 | 785 | 768 | 196.6 |
| D | 2 | 234 | 24028 | 118.31 | 785 | 768 | 196.6 |
| D | 2 | 152 | 15587 | 75.38 | 785 | 768 | 196.6 |
Histogram calculated using DETX and DETY for each event in the final _common_clean file
| Quadrant A |  |
 |
Quadrant B |
|---|---|---|---|
| Quadrant D | 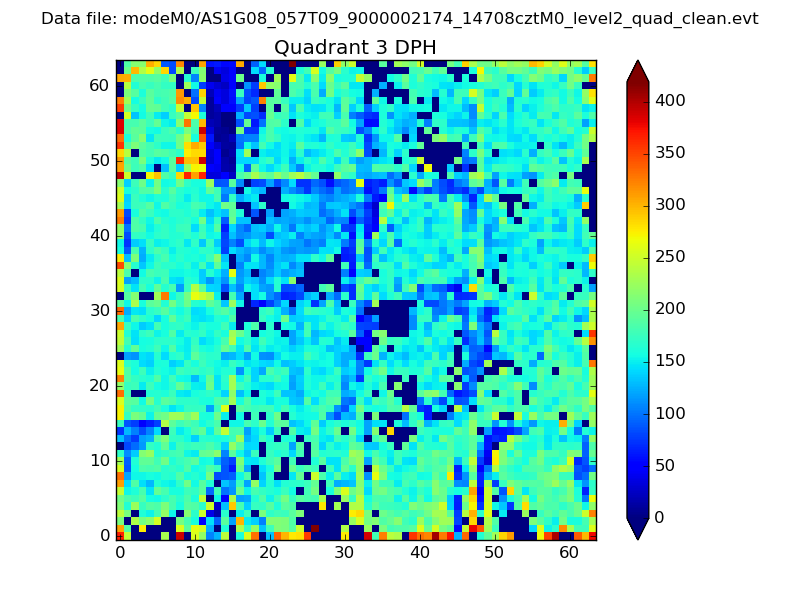 |
 |
Quadrant C |
| Plot type | Count rate plots | Images |
|---|---|---|
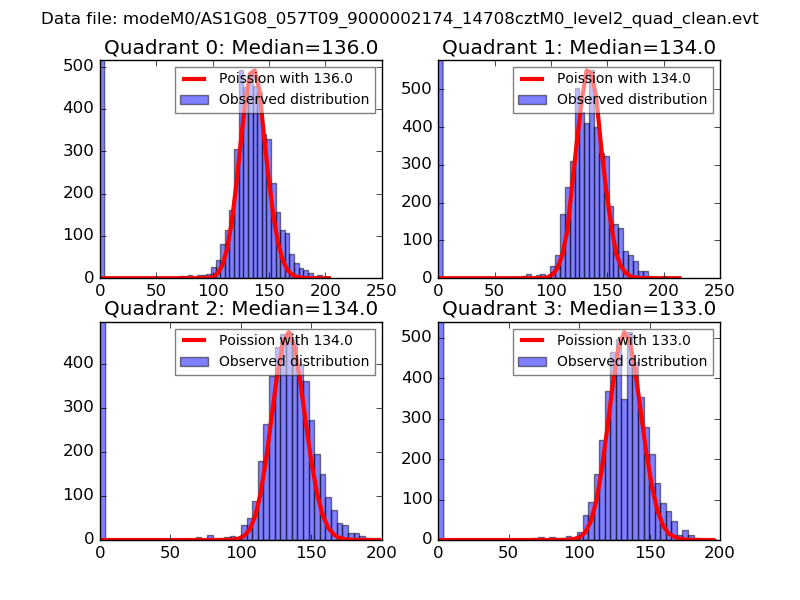
| Comparison with Poisson distribution Blue bars denote a histogram of data divided into 1 sec bins. Red curve is a Poisson curve with rate = median count rate of data. |
 |
 |
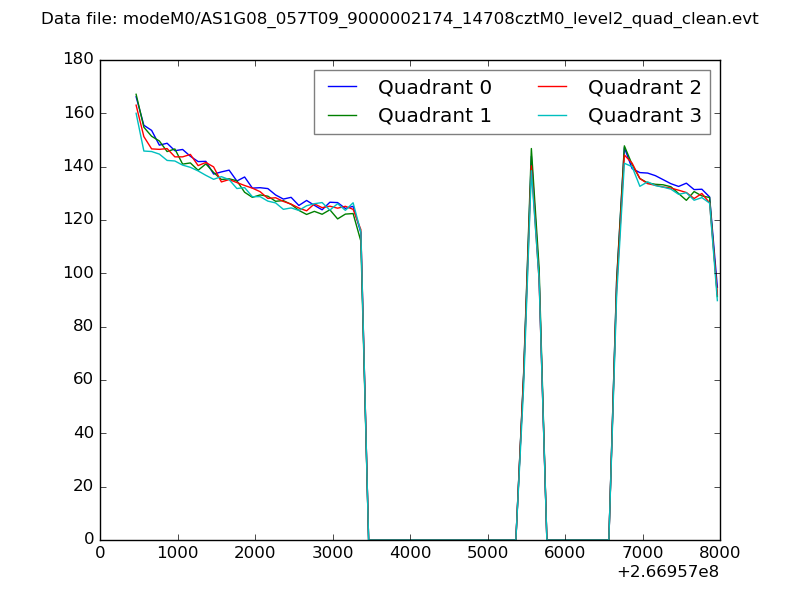
| Quadrant-wise count rates Data is divided into 100 sec bins |
 |
|
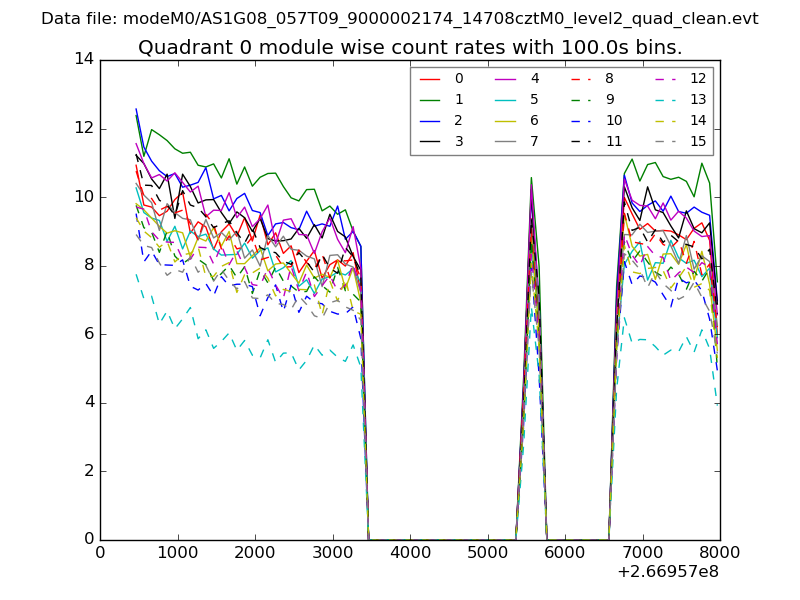
| Module-wise count rates for Quadrant A Data is divided into 100 sec bins |
 |
 |
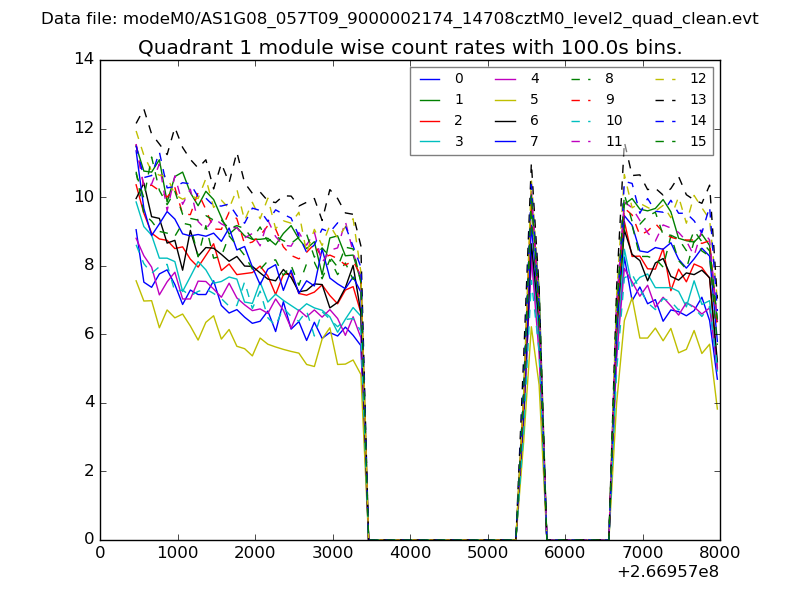
| Module-wise count rates for Quadrant B Data is divided into 100 sec bins |
 |
 |
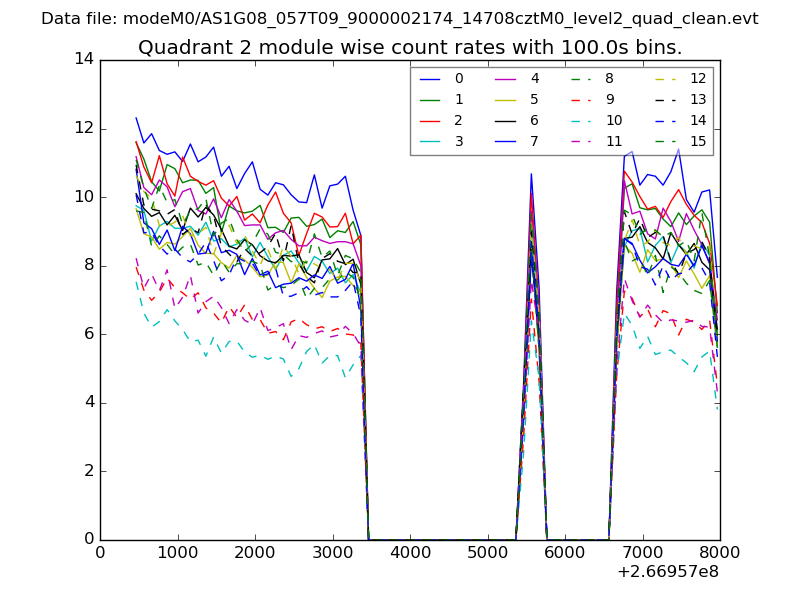
| Module-wise count rates for Quadrant C Data is divided into 100 sec bins |
 |
 |
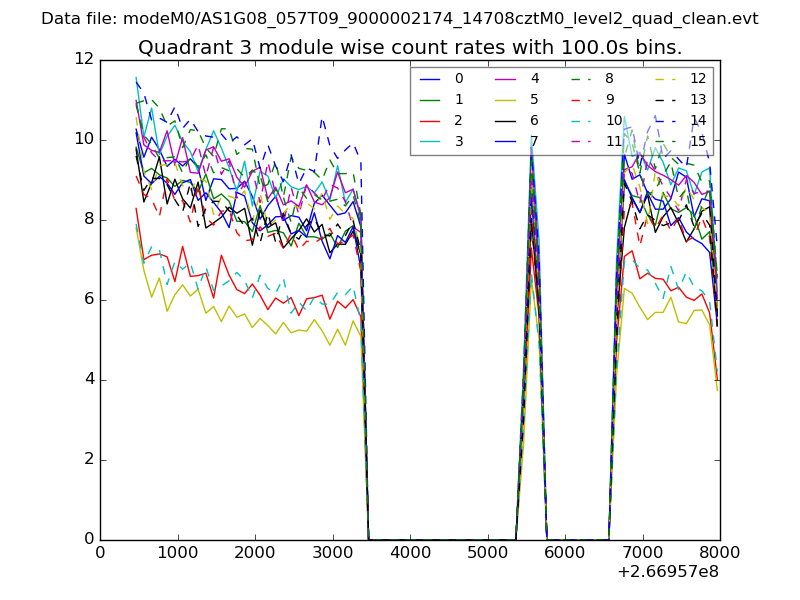
| Module-wise count rates for Quadrant D Data is divided into 100 sec bins |
 |
 |
| Parameter | Plot |
|---|---|
| CZT HV Monitor | 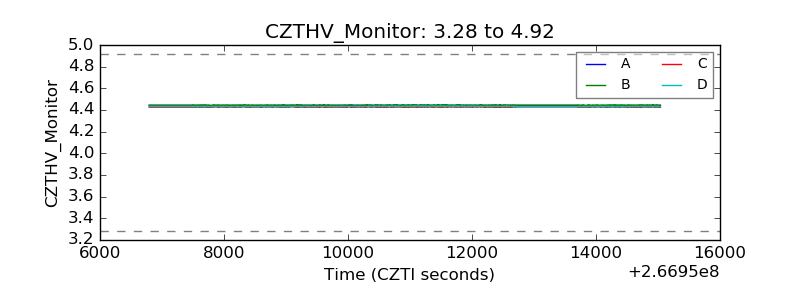 |
| D_VDD | 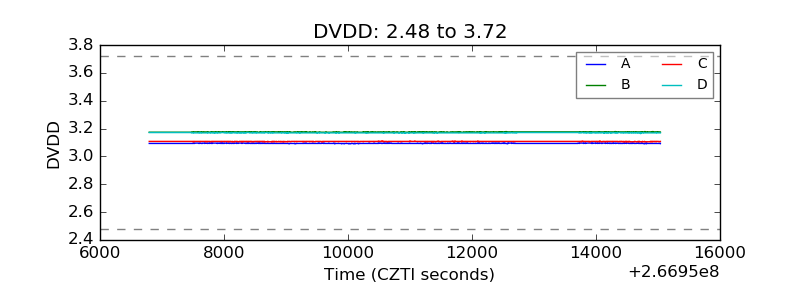 |
| Temperature 1 | 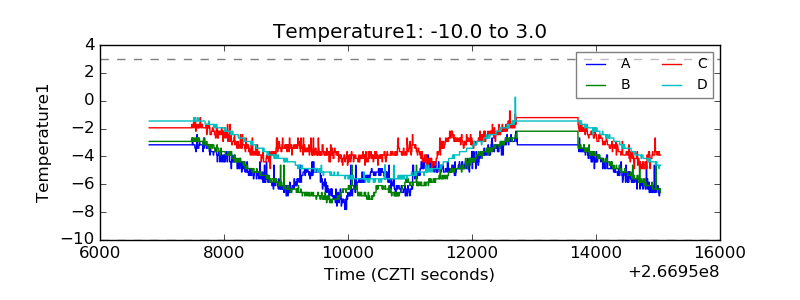 |
| Veto HV Monitor | 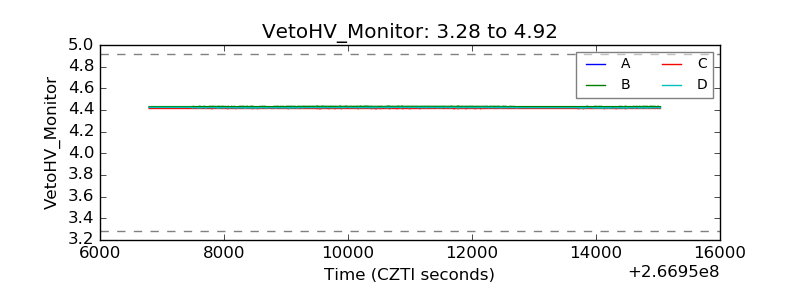 |
| Veto LLD | 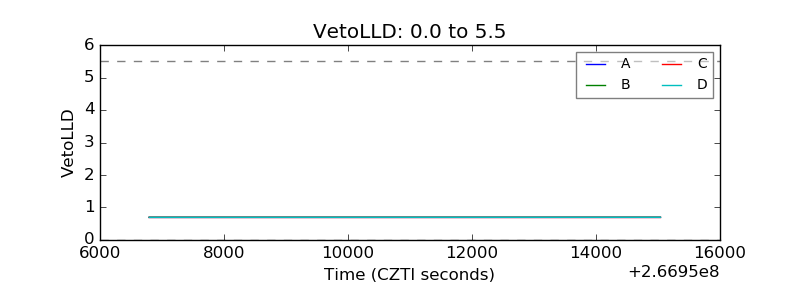 |
| Alpha Counter | 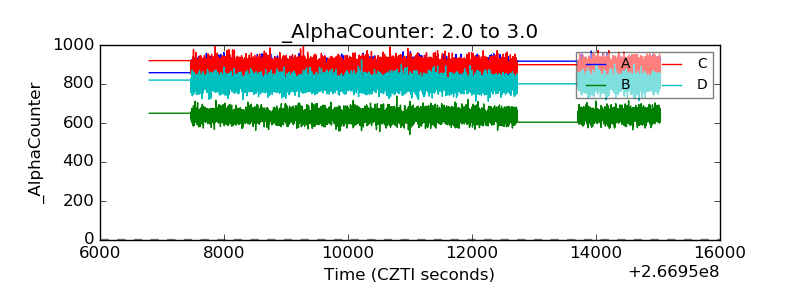 |
| _CPM_Rate | 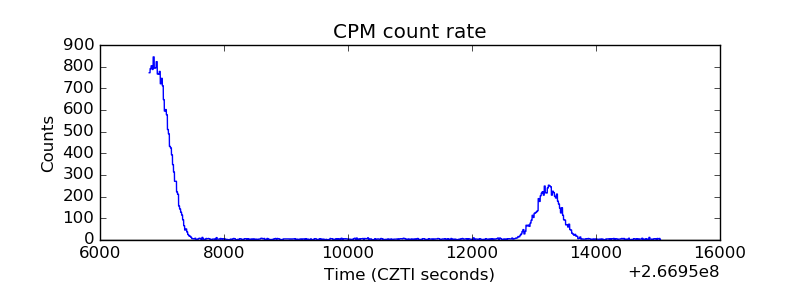 |
| CZT Counter | 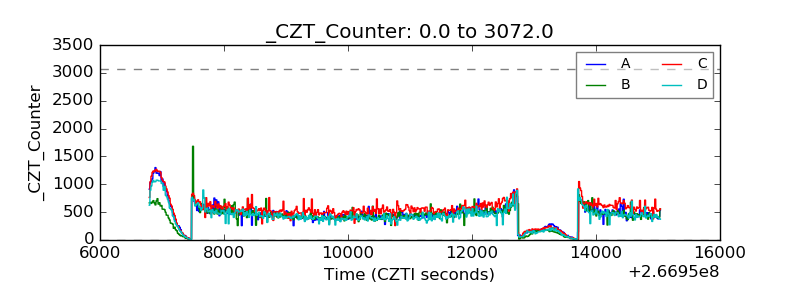 |
| +2.5 Volts monitor |  |
| +5 Volts monitor | 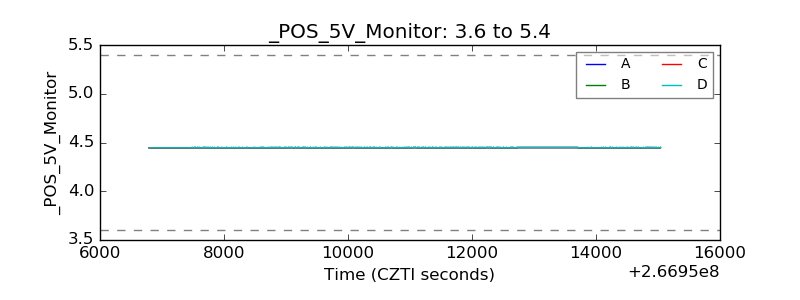 |
| _ROLL_ROT | 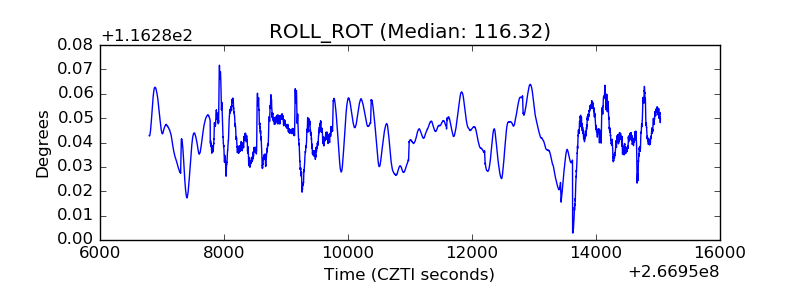 |
| _Roll_DEC | 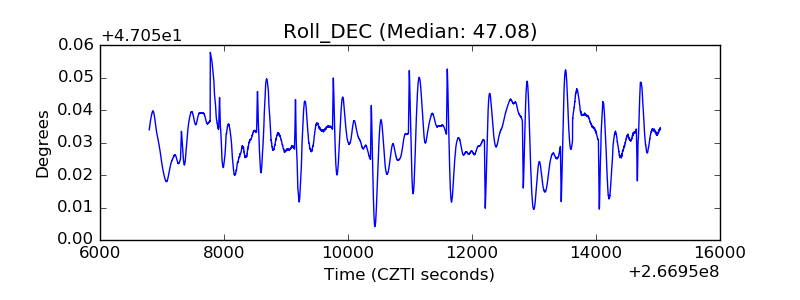 |
| _Roll_RA | 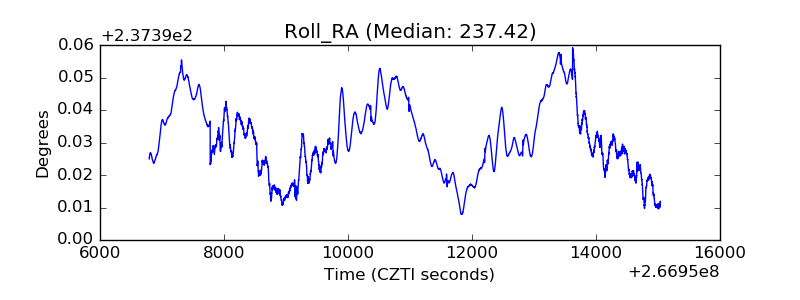 |
| Veto Counter | 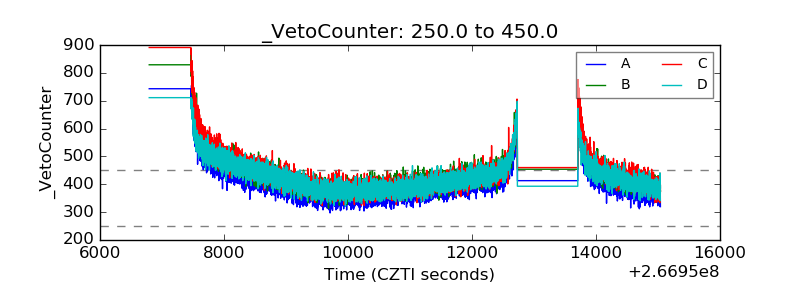 |