| Param | Original file | Final file |
|---|---|---|
| Filename | modeM0/AS1G08_057T09_9000002174_14709cztM0_level2.evt | modeM0/AS1G08_057T09_9000002174_14709cztM0_level2_quad_clean.evt |
| Size (bytes) | 468,250,560 | 99,011,520 |
| Size | 446.6 MB | 94.4 MB |
| Events in quadrant A | 3,336,588 | 638,976 |
| Events in quadrant B | 3,349,459 | 627,977 |
| Events in quadrant C | 3,925,414 | 627,013 |
| Events in quadrant D | 3,099,114 | 622,135 |
| Mode SS | |||
|---|---|---|---|
| Quadrant | BADHDUFLAG | Total packets | Discarded packets |
| A | 0 | 140 | 0 |
| B | 0 | 140 | 0 |
| C | 0 | 140 | 0 |
| D | 0 | 140 | 0 |
| Mode M0 | |||
|---|---|---|---|
| Quadrant | BADHDUFLAG | Total packets | Discarded packets |
| A | 0 | 14442 | 3 |
| B | 0 | 14669 | 2 |
| C | 0 | 16130 | 2 |
| D | 0 | 14222 | 2 |
| Mode M9 | |||
|---|---|---|---|
| Quadrant | BADHDUFLAG | Total packets | Discarded packets |
| A | 0 | 8 | 0 |
| B | 0 | 8 | 0 |
| C | 0 | 8 | 0 |
| D | 0 | 9 | 0 |
| Quadrant | Total seconds | Saturated seconds | Saturation percentage |
|---|---|---|---|
| A | 6927 | 29 | 0.418652% |
| B | 6927 | 34 | 0.490833% |
| C | 6927 | 39 | 0.563014% |
| D | 6927 | 8 | 0.115490% |
Noise dominated data is calculated using 1-second bins in cleaned event files. If a bin has >2000 counts, and if more than 50% of those come from <1% of pixels, then it is considered to be noise-dominated and hence unusable.
| Quadrant | # 1 sec bins | Bins with >0 counts | Bins with >2000 counts | High rate bins dominated by noise | Noise dominated (total time) | Noise dominated (detector-on time) | Marked lightcurve |
|---|---|---|---|---|---|---|---|
| A | 7518 | 6929 | 4 | 4 | 0.05% | 0.06% | 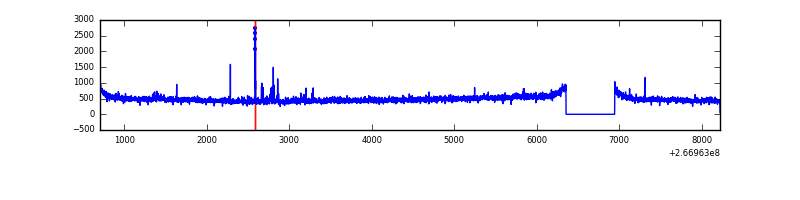 |
| B | 7518 | 6929 | 3 | 3 | 0.04% | 0.04% | 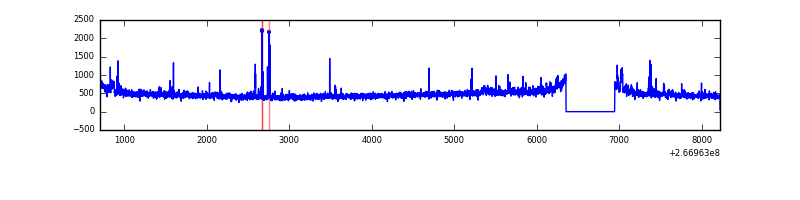 |
| C | 7518 | 6929 | 1 | 1 | 0.01% | 0.01% | 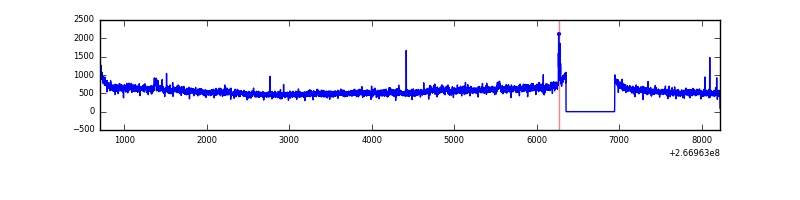 |
| D | 7518 | 6929 | 0 | 0 | 0.00% | 0.00% | 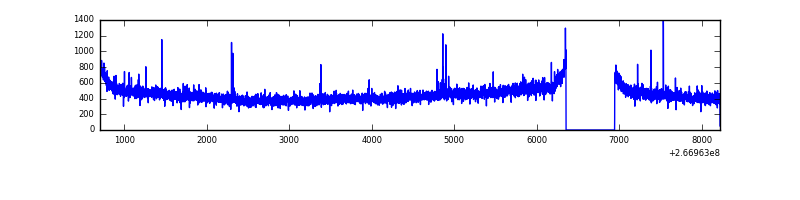 |
Top three noisy pixels from each quadrant. If the there are fewer than three noisy pixels in the level2.evt file, extra rows are filled as -1
| Pixel properties | Quadrant properties | ||||||
|---|---|---|---|---|---|---|---|
| Quadrant | DetID | PixID | Counts | Sigma | Mean | Median | Sigma |
| A | 8 | 15 | 60098 | 351.82 | 826 | 809 | 168.5 |
| A | 9 | 143 | 36429 | 211.37 | 826 | 809 | 168.5 |
| A | 1 | 162 | 26417 | 151.96 | 826 | 809 | 168.5 |
| B | 0 | 85 | 51129 | 320.03 | 822 | 800 | 157.3 |
| B | 4 | 173 | 30867 | 191.19 | 822 | 800 | 157.3 |
| B | 12 | 111 | 18621 | 113.32 | 822 | 800 | 157.3 |
| C | 3 | 233 | 729493 | 3877.75 | 809 | 811 | 187.9 |
| C | 14 | 234 | 26318 | 135.74 | 809 | 811 | 187.9 |
| C | 13 | 61 | 5703 | 26.03 | 809 | 811 | 187.9 |
| D | 2 | 234 | 25910 | 117.8 | 804 | 786 | 213.3 |
| D | 13 | 172 | 10843 | 47.15 | 804 | 786 | 213.3 |
| D | 2 | 152 | 9903 | 42.75 | 804 | 786 | 213.3 |
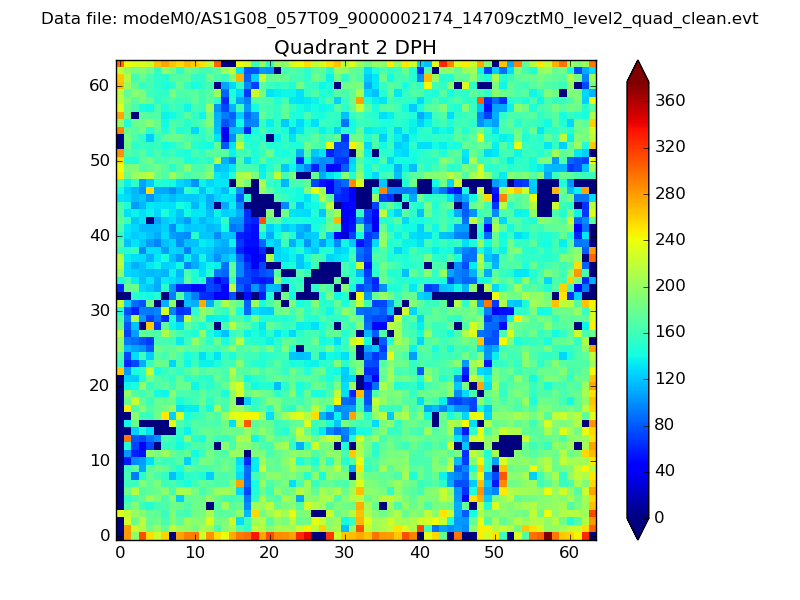
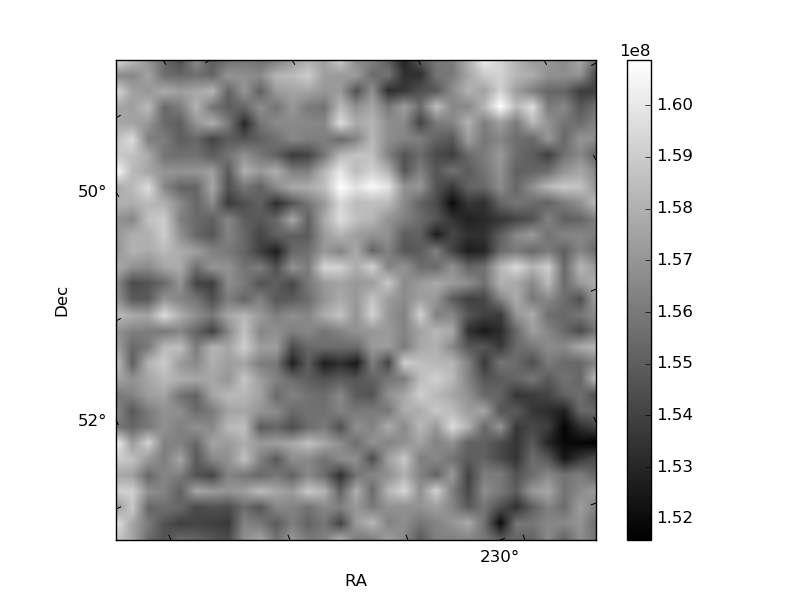
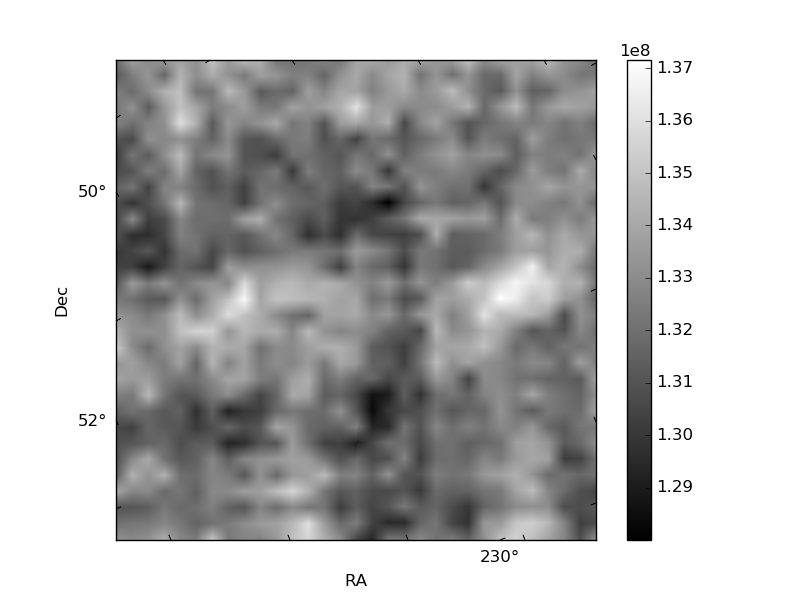
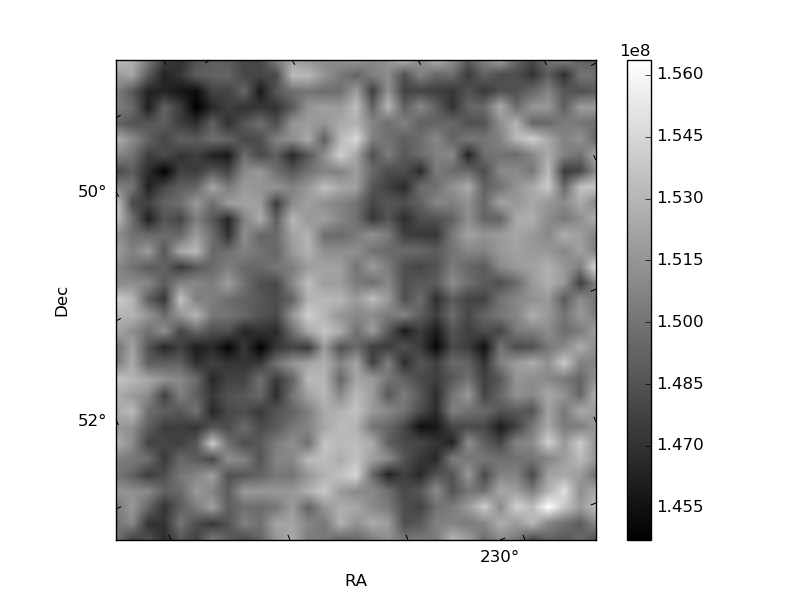
Histogram calculated using DETX and DETY for each event in the final _common_clean file
| Quadrant A | 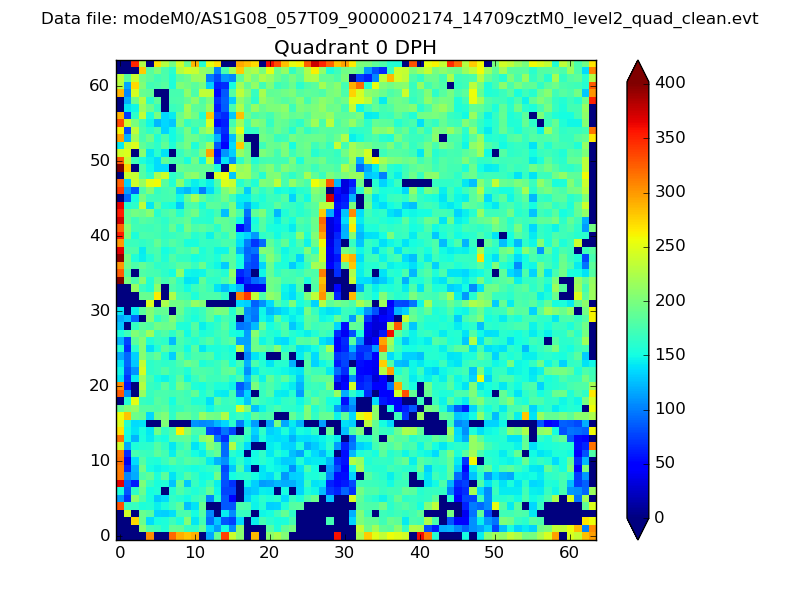 |
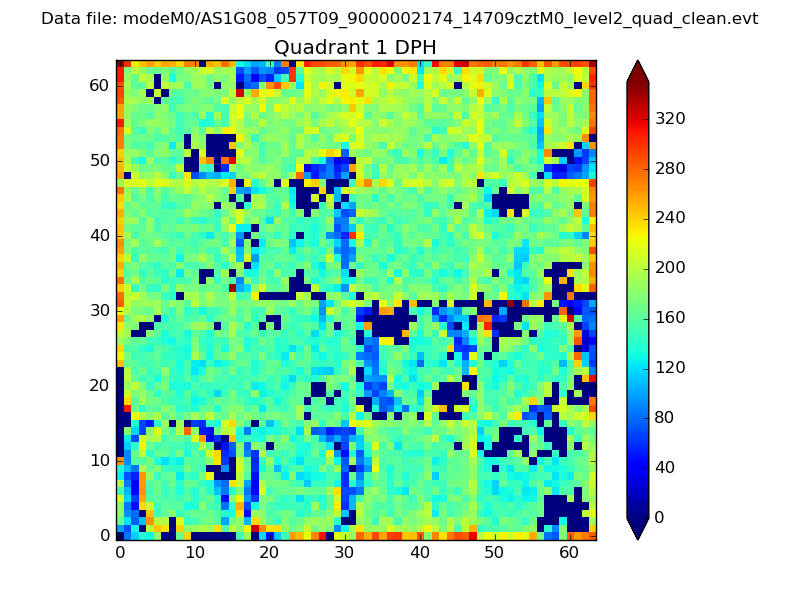 |
Quadrant B |
|---|---|---|---|
| Quadrant D | 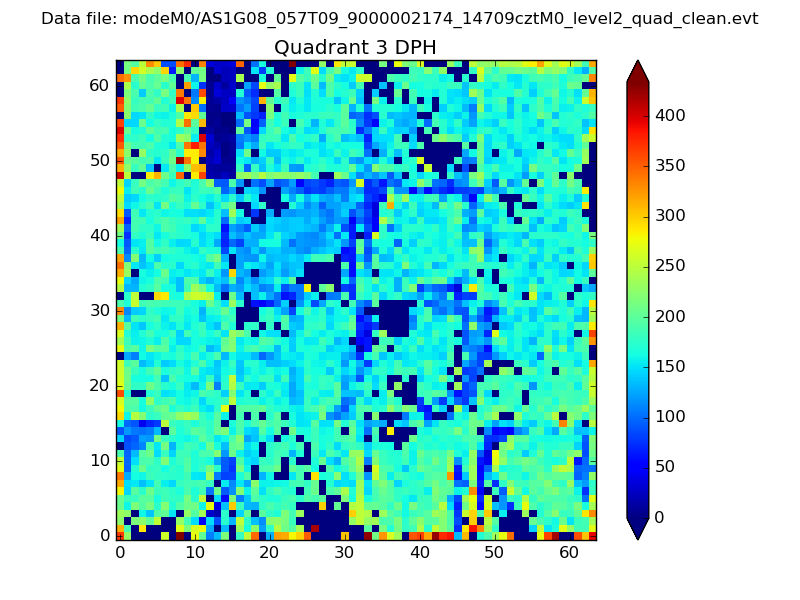 |
 |
Quadrant C |
| Plot type | Count rate plots | Images |
|---|---|---|
| Comparison with Poisson distribution Blue bars denote a histogram of data divided into 1 sec bins. Red curve is a Poisson curve with rate = median count rate of data. |
 |
 |
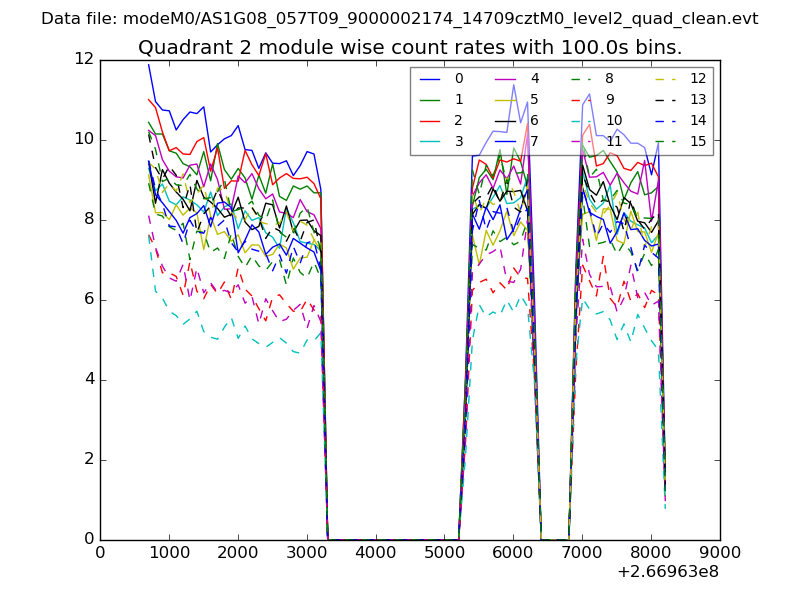
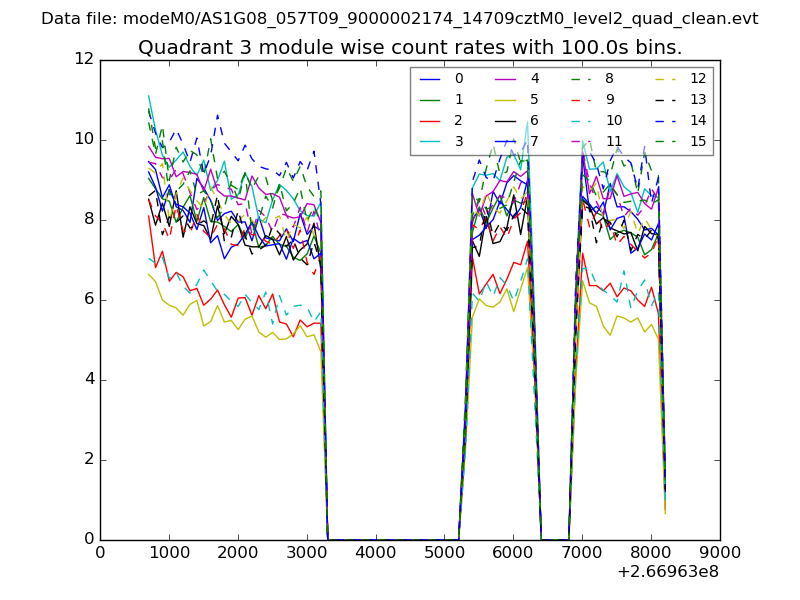
| Quadrant-wise count rates Data is divided into 100 sec bins |
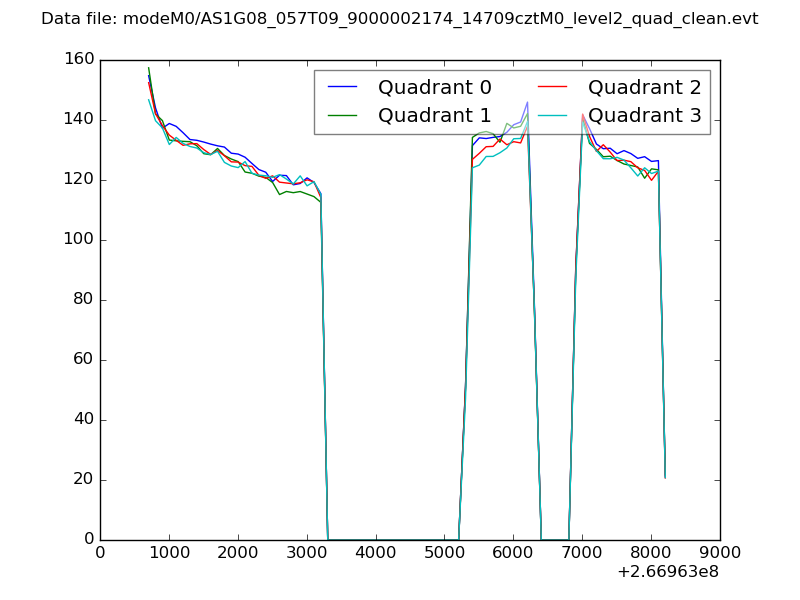 |
|
| Module-wise count rates for Quadrant A Data is divided into 100 sec bins |
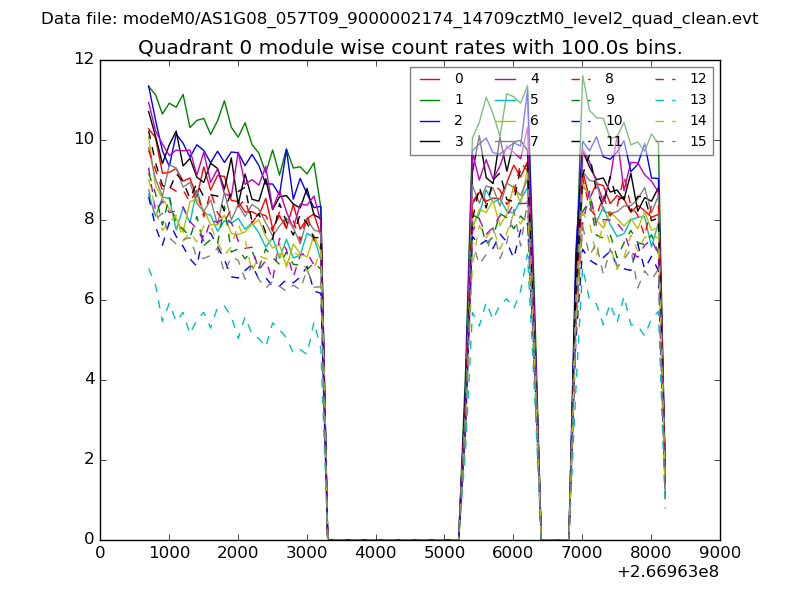 |
 |
| Module-wise count rates for Quadrant B Data is divided into 100 sec bins |
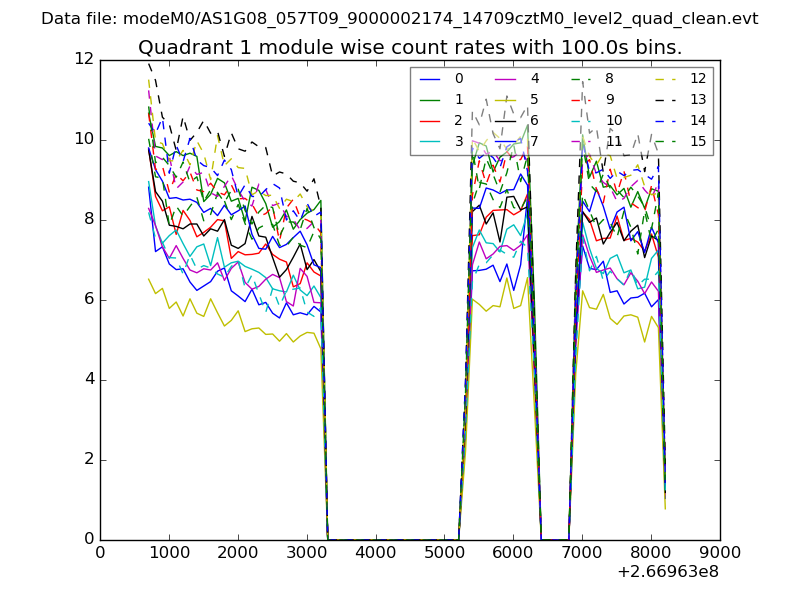 |
 |
| Module-wise count rates for Quadrant C Data is divided into 100 sec bins |
 |
 |
| Module-wise count rates for Quadrant D Data is divided into 100 sec bins |
 |
 |
| Parameter | Plot |
|---|---|
| CZT HV Monitor | 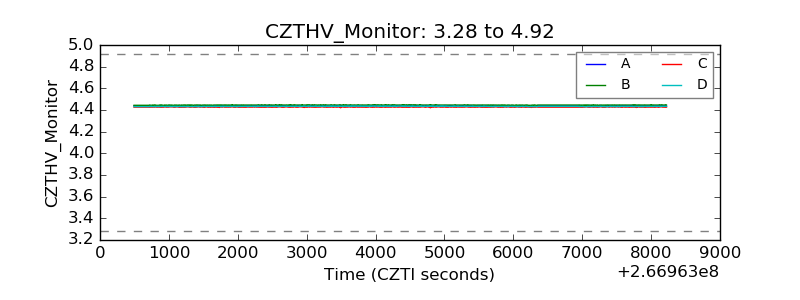 |
| D_VDD |  |
| Temperature 1 | 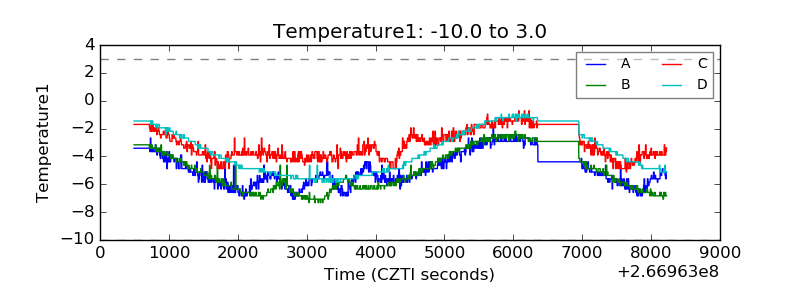 |
| Veto HV Monitor | 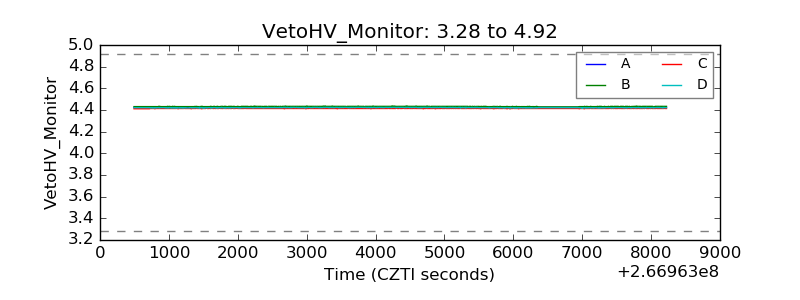 |
| Veto LLD | 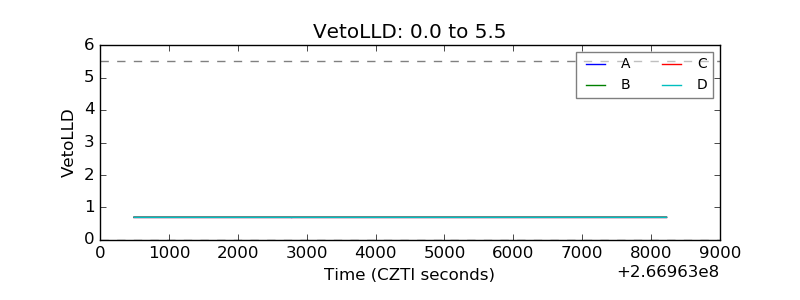 |
| Alpha Counter | 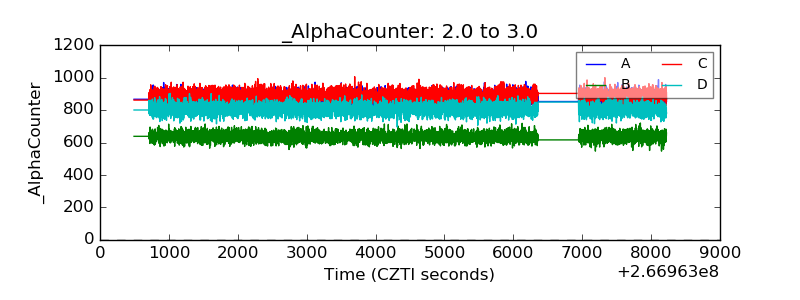 |
| _CPM_Rate | 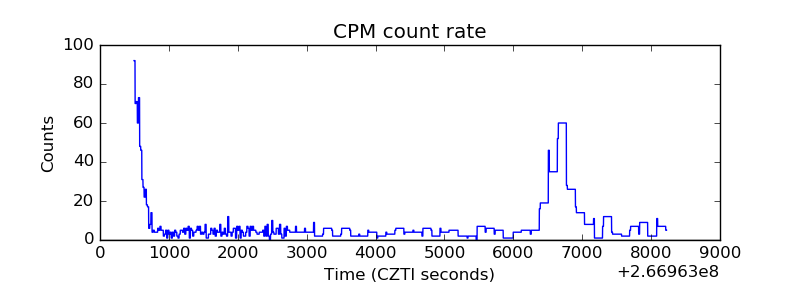 |
| CZT Counter | 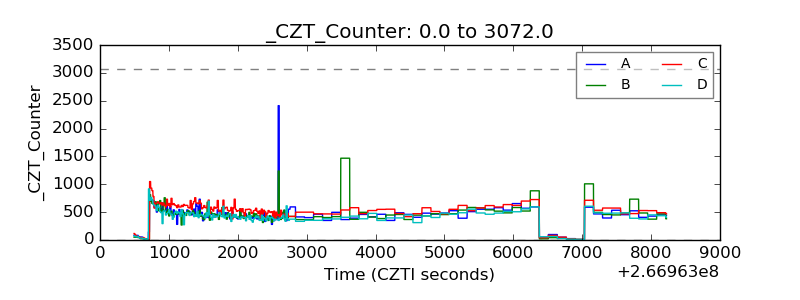 |
| +2.5 Volts monitor |  |
| +5 Volts monitor |  |
| _ROLL_ROT | 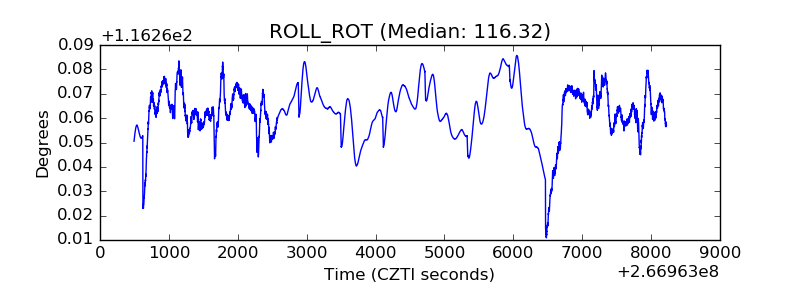 |
| _Roll_DEC | 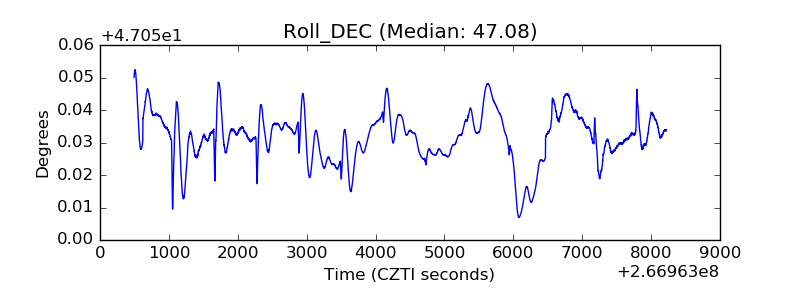 |
| _Roll_RA |  |
| Veto Counter | 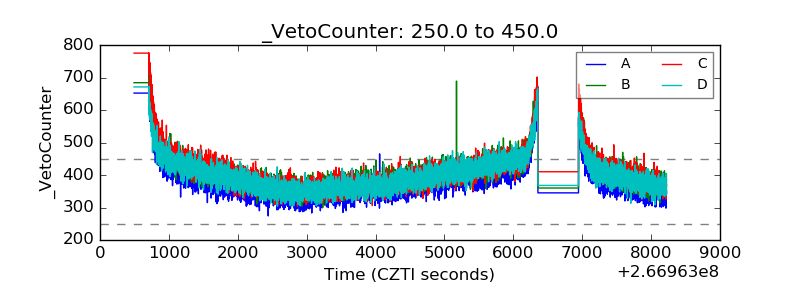 |