| Param | Original file | Final file |
|---|---|---|
| Filename | modeM0/AS1G08_057T09_9000002174_14710cztM0_level2.evt | modeM0/AS1G08_057T09_9000002174_14710cztM0_level2_quad_clean.evt |
| Size (bytes) | 521,686,080 | 113,929,920 |
| Size | 497.5 MB | 108.7 MB |
| Events in quadrant A | 3,693,604 | 739,728 |
| Events in quadrant B | 3,762,149 | 726,898 |
| Events in quadrant C | 4,276,730 | 723,984 |
| Events in quadrant D | 3,541,223 | 721,412 |
| Mode SS | |||
|---|---|---|---|
| Quadrant | BADHDUFLAG | Total packets | Discarded packets |
| A | 0 | 160 | 0 |
| B | 0 | 160 | 0 |
| C | 0 | 160 | 0 |
| D | 0 | 160 | 0 |
| Mode M0 | |||
|---|---|---|---|
| Quadrant | BADHDUFLAG | Total packets | Discarded packets |
| A | 0 | 16178 | 3 |
| B | 0 | 16451 | 2 |
| C | 0 | 17537 | 2 |
| D | 0 | 16169 | 2 |
| Mode M9 | |||
|---|---|---|---|
| Quadrant | BADHDUFLAG | Total packets | Discarded packets |
| A | 0 | 9 | 0 |
| B | 0 | 9 | 0 |
| C | 0 | 9 | 0 |
| D | 0 | 9 | 0 |
| Quadrant | Total seconds | Saturated seconds | Saturation percentage |
|---|---|---|---|
| A | 7745 | 35 | 0.451904% |
| B | 7745 | 69 | 0.890897% |
| C | 7745 | 50 | 0.645578% |
| D | 7745 | 25 | 0.322789% |
Noise dominated data is calculated using 1-second bins in cleaned event files. If a bin has >2000 counts, and if more than 50% of those come from <1% of pixels, then it is considered to be noise-dominated and hence unusable.
| Quadrant | # 1 sec bins | Bins with >0 counts | Bins with >2000 counts | High rate bins dominated by noise | Noise dominated (total time) | Noise dominated (detector-on time) | Marked lightcurve |
|---|---|---|---|---|---|---|---|
| A | 8611 | 7749 | 2 | 2 | 0.02% | 0.03% | 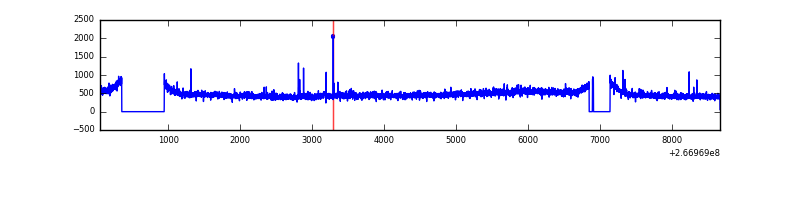 |
| B | 8611 | 7749 | 5 | 5 | 0.06% | 0.06% | 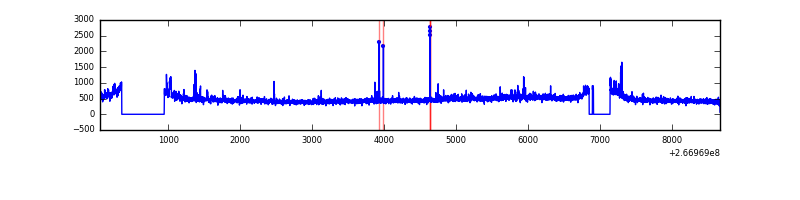 |
| C | 8611 | 7749 | 1 | 1 | 0.01% | 0.01% | 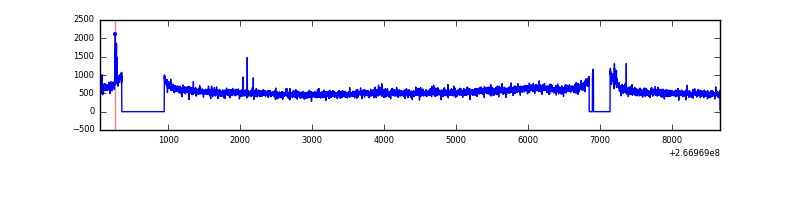 |
| D | 8611 | 7748 | 11 | 11 | 0.13% | 0.14% | 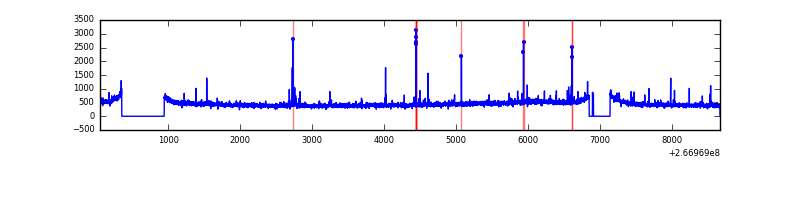 |
Top three noisy pixels from each quadrant. If the there are fewer than three noisy pixels in the level2.evt file, extra rows are filled as -1
| Pixel properties | Quadrant properties | ||||||
|---|---|---|---|---|---|---|---|
| Quadrant | DetID | PixID | Counts | Sigma | Mean | Median | Sigma |
| A | 8 | 15 | 52928 | 277.8 | 926 | 908 | 187.3 |
| A | 1 | 162 | 26923 | 138.93 | 926 | 908 | 187.3 |
| A | 11 | 29 | 25408 | 130.84 | 926 | 908 | 187.3 |
| B | 0 | 85 | 61050 | 339.6 | 922 | 898 | 177.1 |
| B | 0 | 214 | 28052 | 153.3 | 922 | 898 | 177.1 |
| B | 12 | 111 | 21058 | 113.82 | 922 | 898 | 177.1 |
| C | 3 | 233 | 689252 | 3258.24 | 907 | 910 | 211.3 |
| C | 14 | 234 | 24707 | 112.64 | 907 | 910 | 211.3 |
| C | 8 | 128 | 13383 | 59.04 | 907 | 910 | 211.3 |
| D | 9 | 1 | 32280 | 141.04 | 902 | 876 | 222.7 |
| D | 2 | 234 | 29990 | 130.75 | 902 | 876 | 222.7 |
| D | 13 | 122 | 28584 | 124.44 | 902 | 876 | 222.7 |
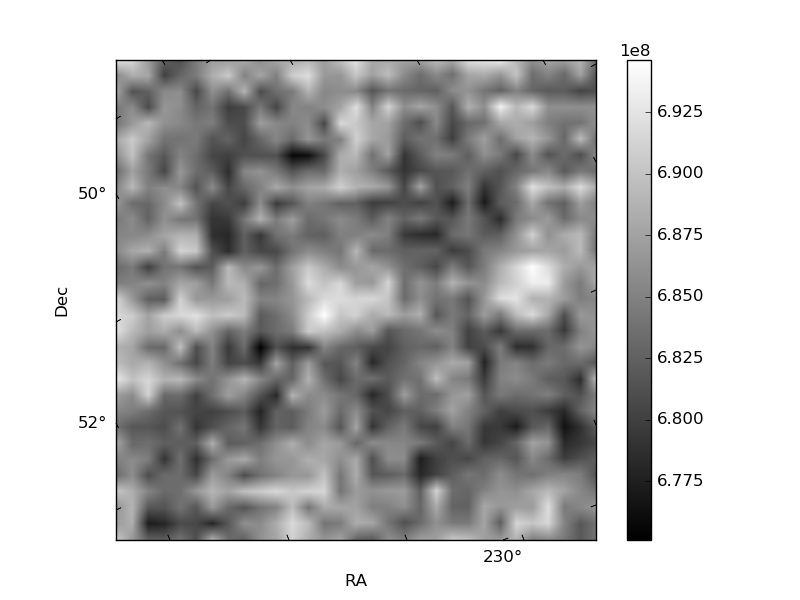
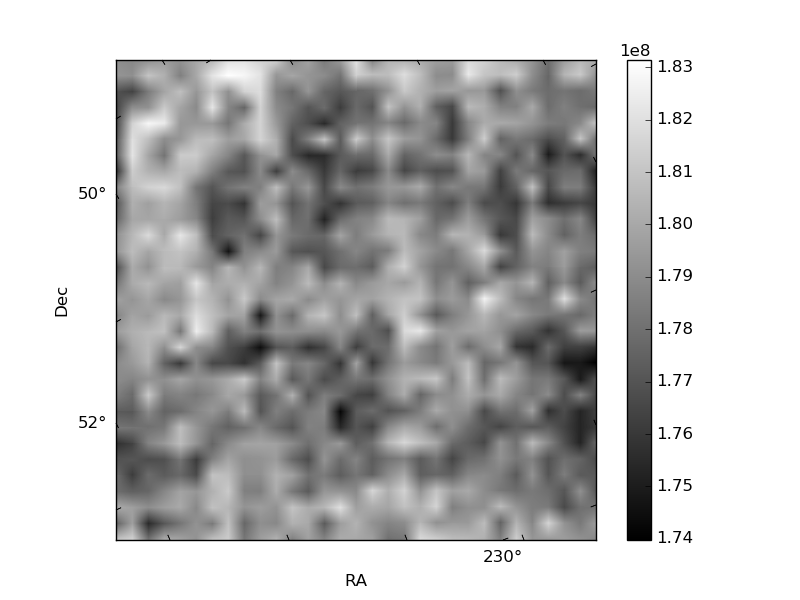
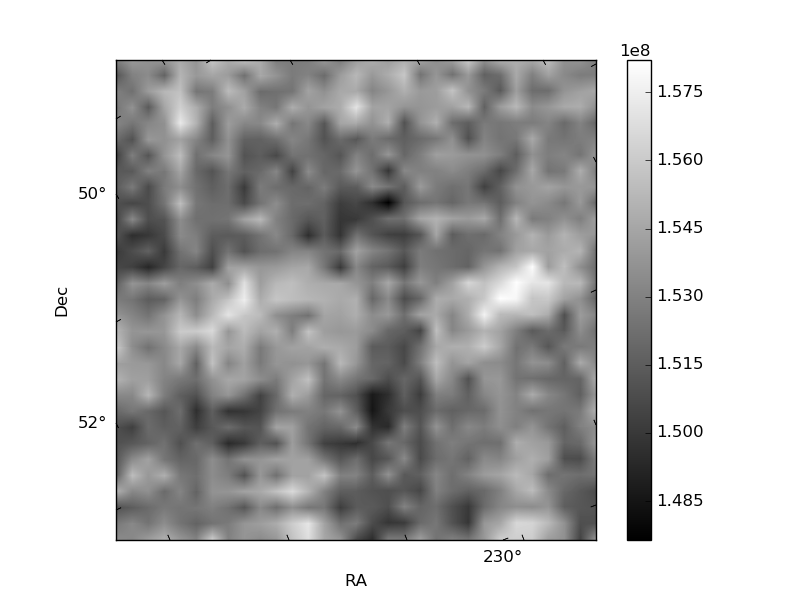
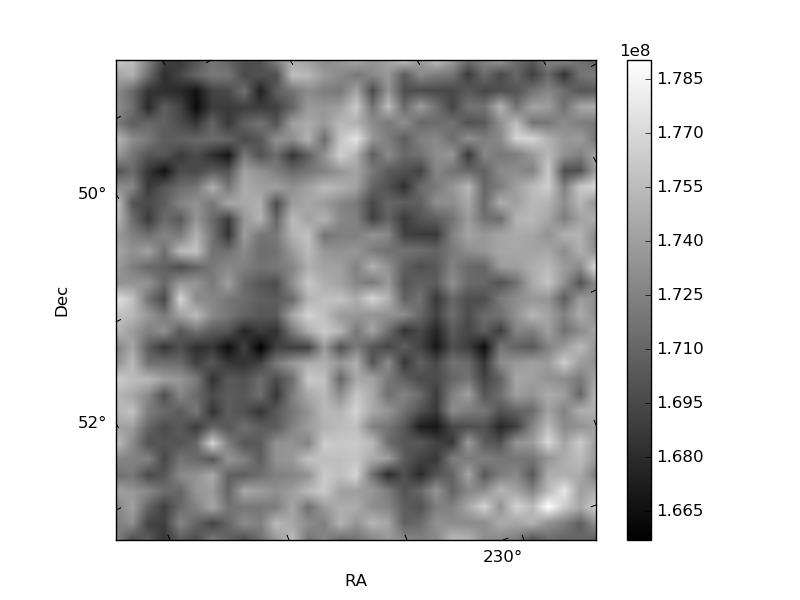
Histogram calculated using DETX and DETY for each event in the final _common_clean file
| Quadrant A | 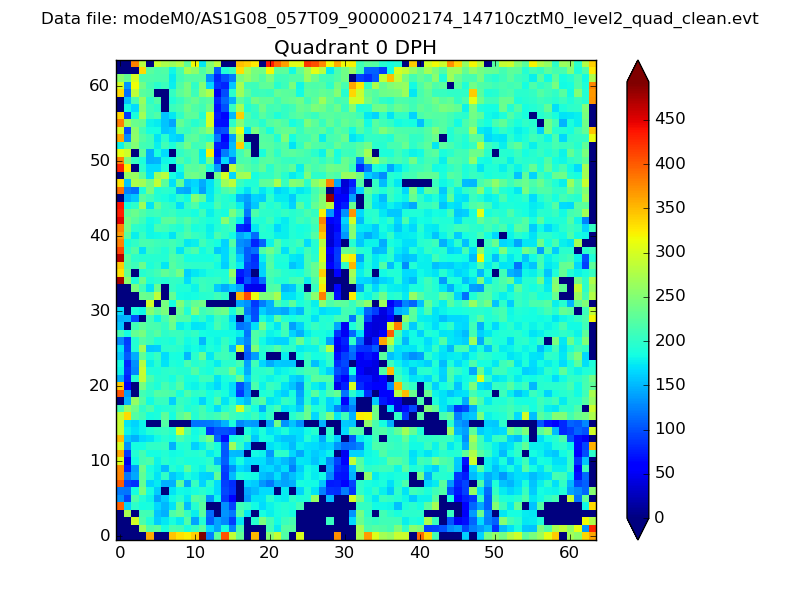 |
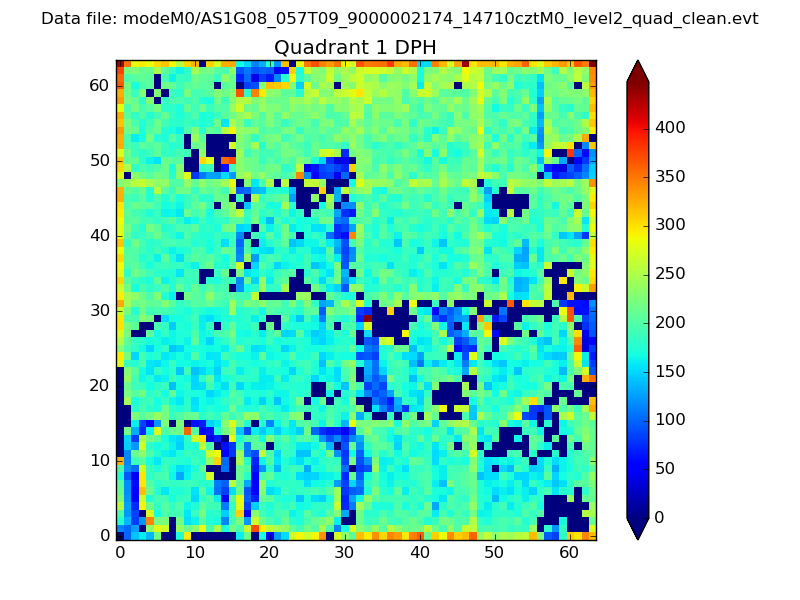 |
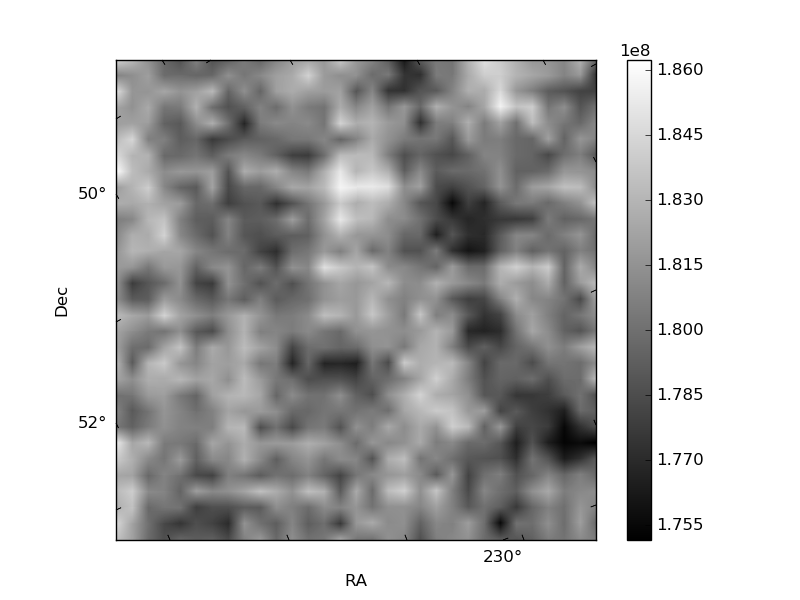
Quadrant B |
|---|---|---|---|
| Quadrant D | 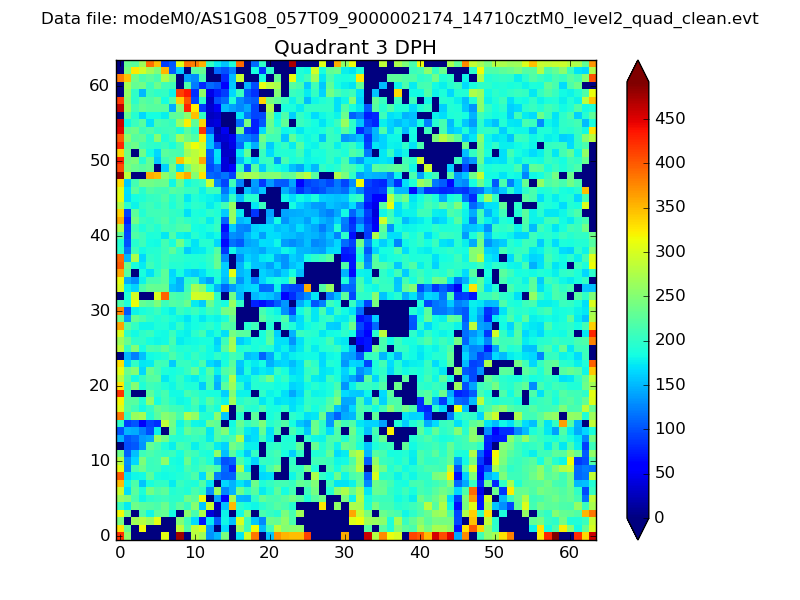 |
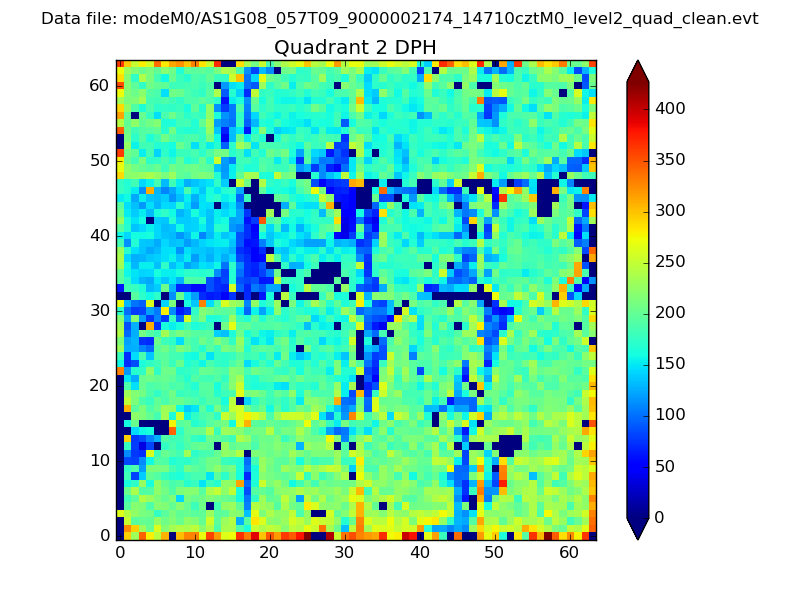 |
Quadrant C |
| Plot type | Count rate plots | Images |
|---|---|---|
| Comparison with Poisson distribution Blue bars denote a histogram of data divided into 1 sec bins. Red curve is a Poisson curve with rate = median count rate of data. |
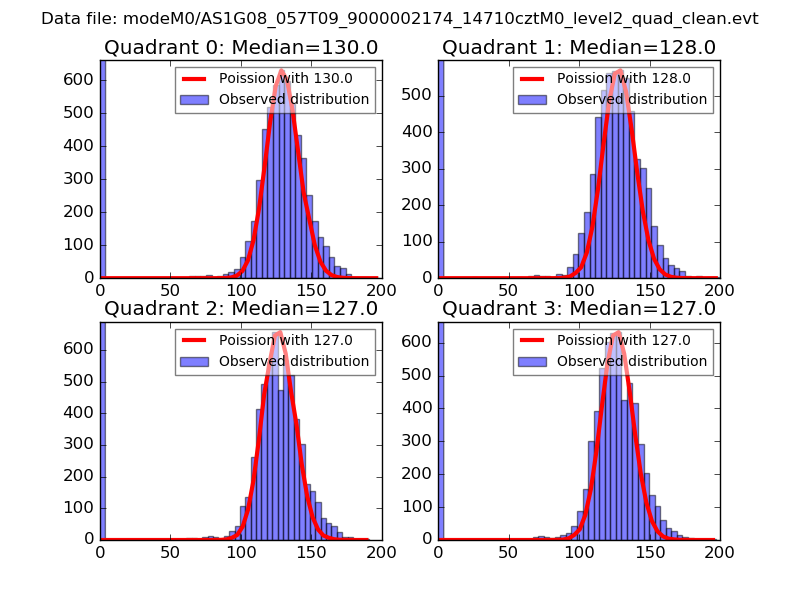 |
 |
| Quadrant-wise count rates Data is divided into 100 sec bins |
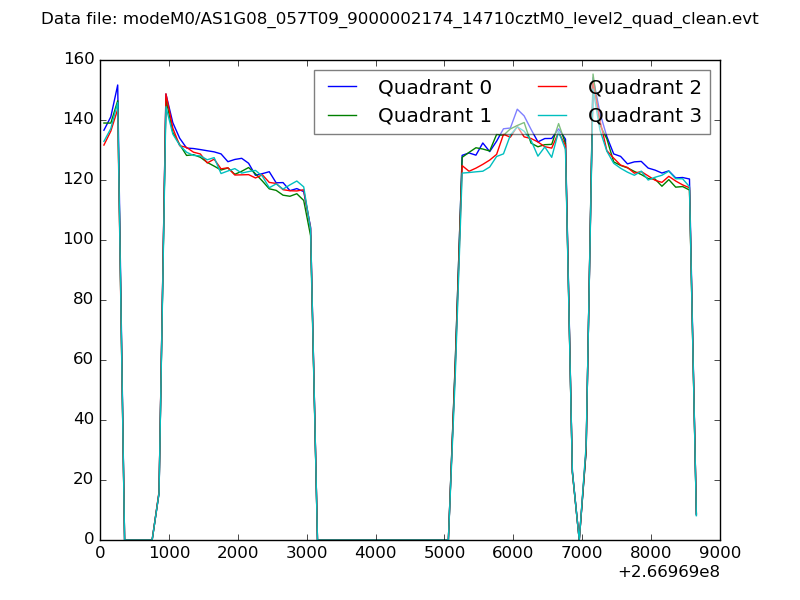 |
|
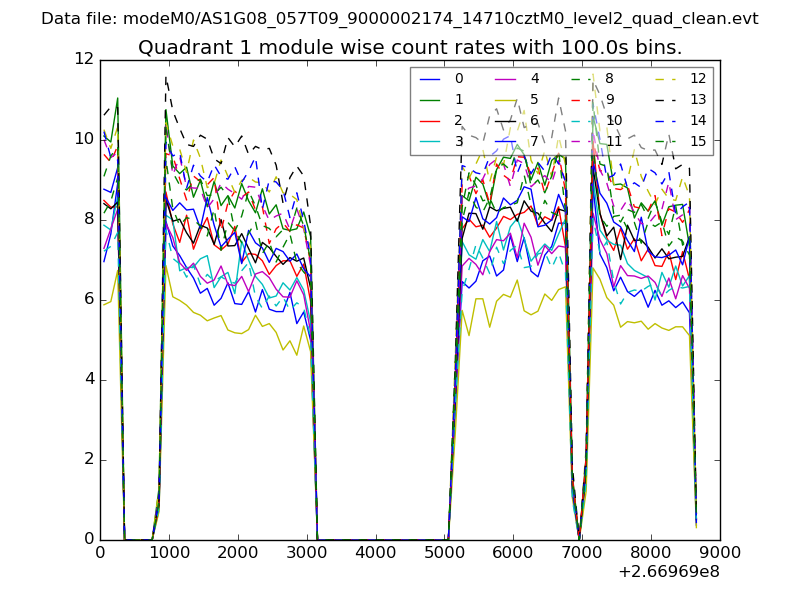
| Module-wise count rates for Quadrant A Data is divided into 100 sec bins |
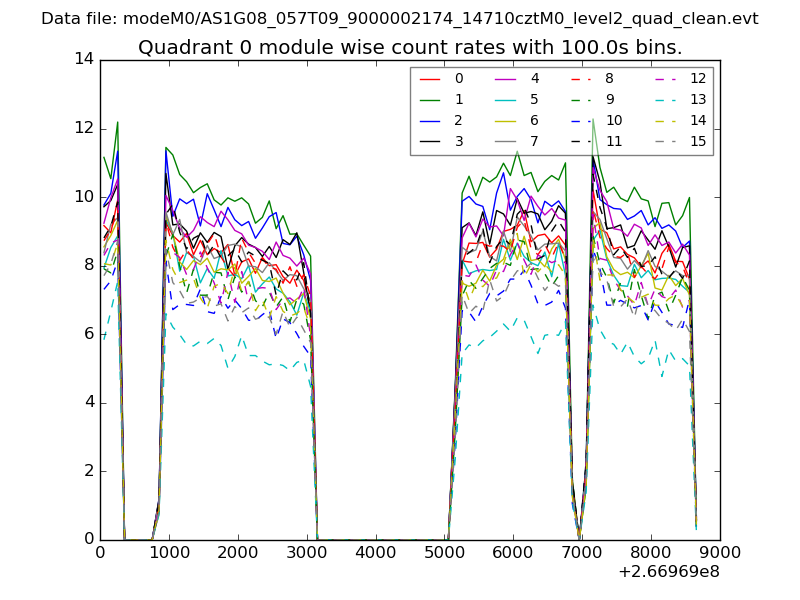 |
 |
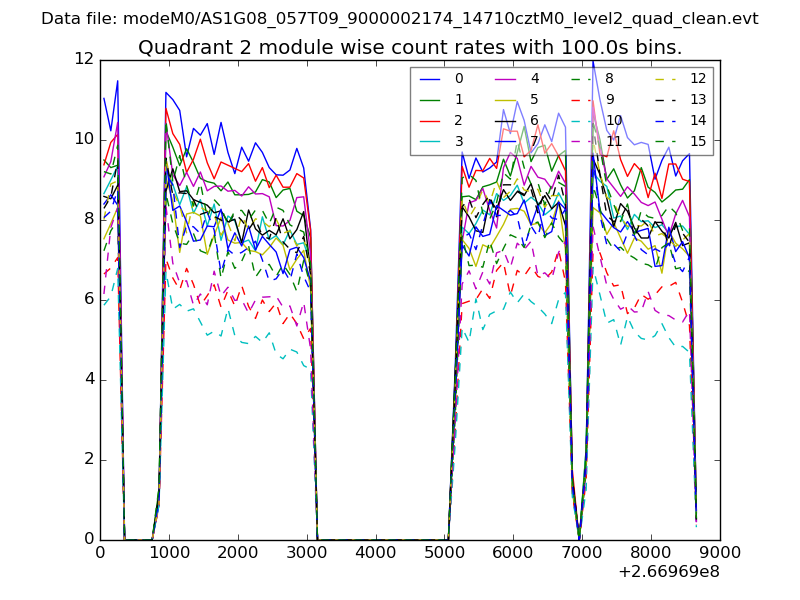
| Module-wise count rates for Quadrant B Data is divided into 100 sec bins |
 |
 |
| Module-wise count rates for Quadrant C Data is divided into 100 sec bins |
 |
 |
| Module-wise count rates for Quadrant D Data is divided into 100 sec bins |
 |
 |
| Parameter | Plot |
|---|---|
| CZT HV Monitor | 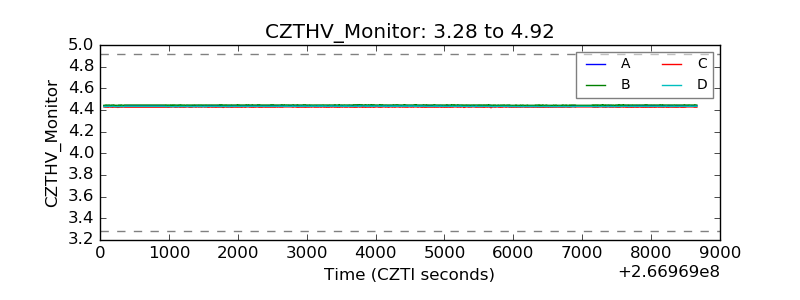 |
| D_VDD | 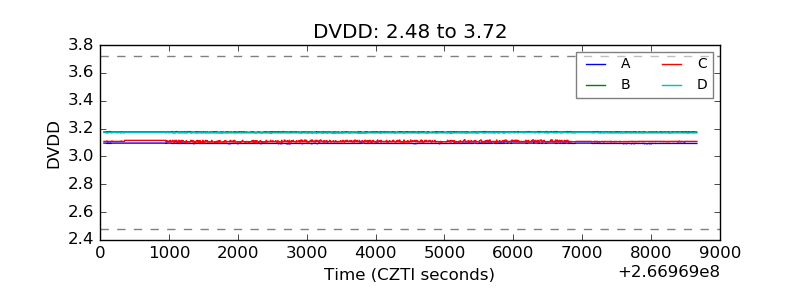 |
| Temperature 1 | 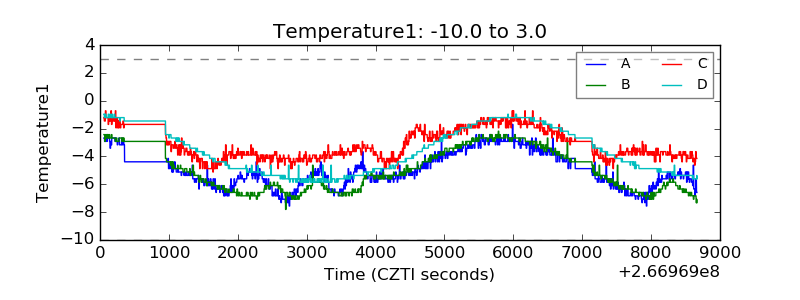 |
| Veto HV Monitor | 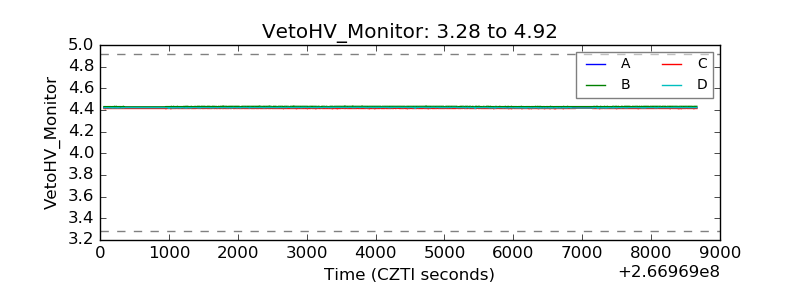 |
| Veto LLD | 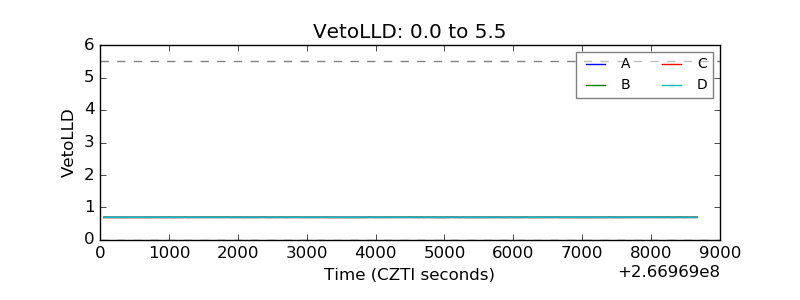 |
| Alpha Counter | 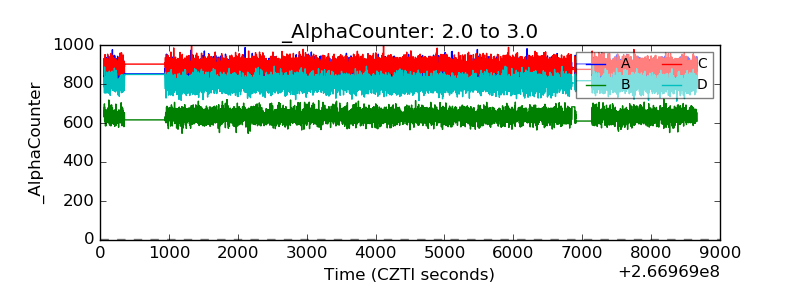 |
| _CPM_Rate |  |
| CZT Counter | 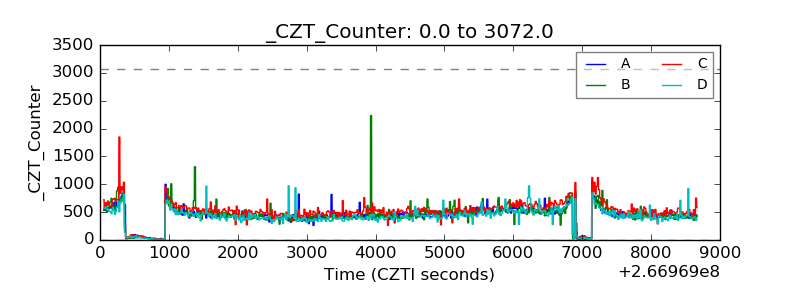 |
| +2.5 Volts monitor |  |
| +5 Volts monitor | 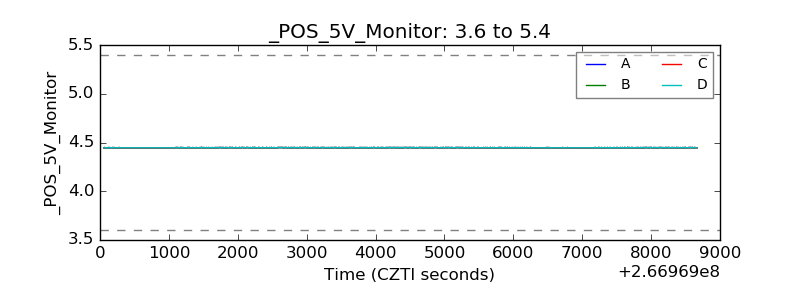 |
| _ROLL_ROT | 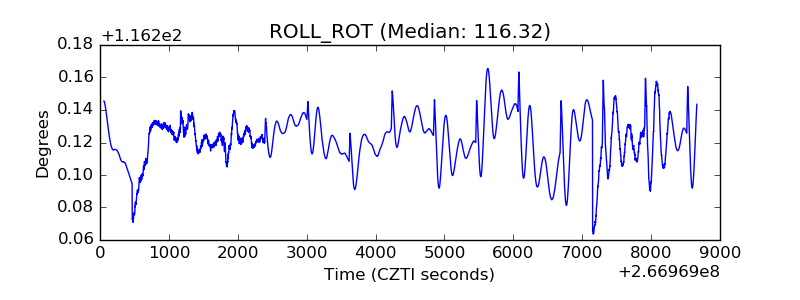 |
| _Roll_DEC | 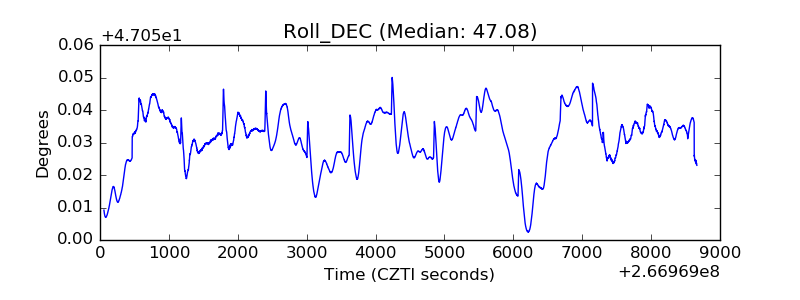 |
| _Roll_RA | 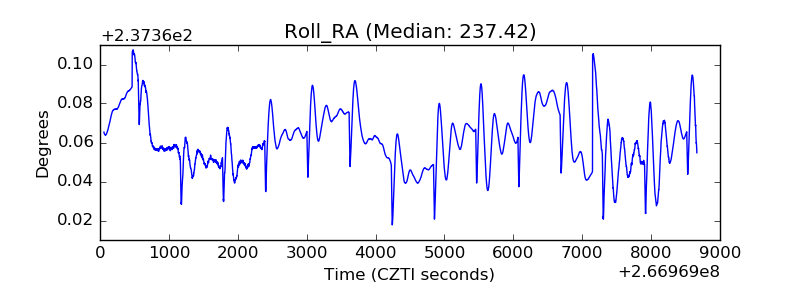 |
| Veto Counter |  |