| Param | Original file | Final file |
|---|---|---|
| Filename | modeM0/AS1G08_057T09_9000002174_14711cztM0_level2.evt | modeM0/AS1G08_057T09_9000002174_14711cztM0_level2_quad_clean.evt |
| Size (bytes) | 340,044,480 | 65,482,560 |
| Size | 324.3 MB | 62.4 MB |
| Events in quadrant A | 2,409,987 | 409,980 |
| Events in quadrant B | 2,430,659 | 404,555 |
| Events in quadrant C | 2,812,940 | 402,055 |
| Events in quadrant D | 2,286,901 | 398,550 |
| Mode SS | |||
|---|---|---|---|
| Quadrant | BADHDUFLAG | Total packets | Discarded packets |
| A | 0 | 108 | 0 |
| B | 0 | 108 | 0 |
| C | 0 | 108 | 0 |
| D | 0 | 108 | 0 |
| Mode M0 | |||
|---|---|---|---|
| Quadrant | BADHDUFLAG | Total packets | Discarded packets |
| A | 0 | 10762 | 1 |
| B | 0 | 10813 | 1 |
| C | 0 | 11338 | 1 |
| D | 0 | 10738 | 1 |
| Mode M9 | |||
|---|---|---|---|
| Quadrant | BADHDUFLAG | Total packets | Discarded packets |
| A | 0 | 3 | 0 |
| B | 0 | 3 | 0 |
| C | 0 | 3 | 0 |
| D | 0 | 3 | 0 |
| Quadrant | Total seconds | Saturated seconds | Saturation percentage |
|---|---|---|---|
| A | 5252 | 20 | 0.380807% |
| B | 5252 | 40 | 0.761615% |
| C | 5252 | 25 | 0.476009% |
| D | 5252 | 6 | 0.114242% |
Noise dominated data is calculated using 1-second bins in cleaned event files. If a bin has >2000 counts, and if more than 50% of those come from <1% of pixels, then it is considered to be noise-dominated and hence unusable.
| Quadrant | # 1 sec bins | Bins with >0 counts | Bins with >2000 counts | High rate bins dominated by noise | Noise dominated (total time) | Noise dominated (detector-on time) | Marked lightcurve |
|---|---|---|---|---|---|---|---|
| A | 5528 | 5255 | 0 | 0 | 0.00% | 0.00% | 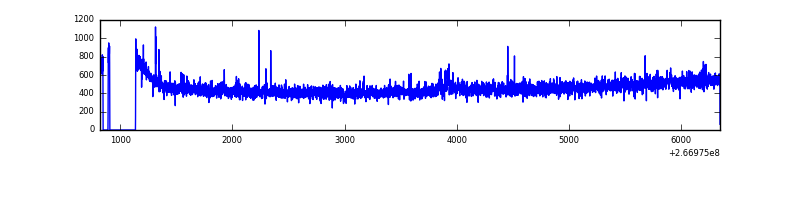 |
| B | 5528 | 5255 | 1 | 1 | 0.02% | 0.02% | 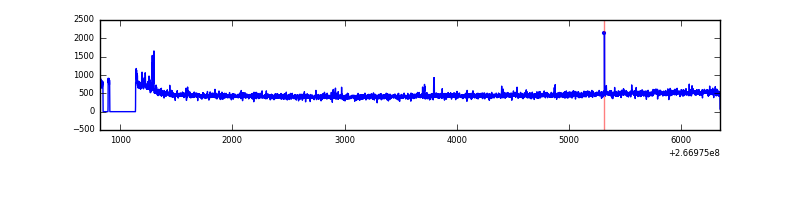 |
| C | 5528 | 5255 | 0 | 0 | 0.00% | 0.00% | 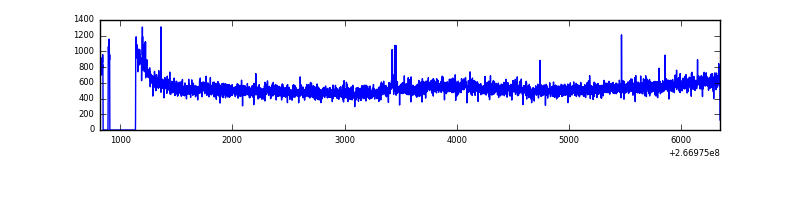 |
| D | 5528 | 5254 | 0 | 0 | 0.00% | 0.00% | 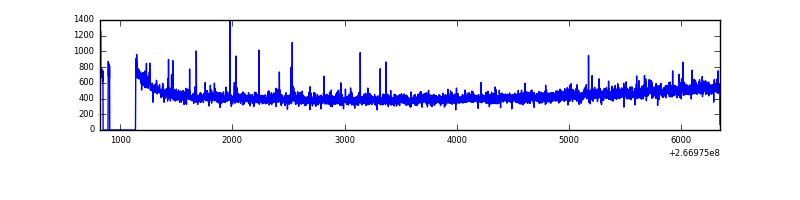 |
Top three noisy pixels from each quadrant. If the there are fewer than three noisy pixels in the level2.evt file, extra rows are filled as -1
| Pixel properties | Quadrant properties | ||||||
|---|---|---|---|---|---|---|---|
| Quadrant | DetID | PixID | Counts | Sigma | Mean | Median | Sigma |
| A | 12 | 189 | 27289 | 216.36 | 610 | 599 | 123.4 |
| A | 1 | 162 | 14909 | 116.0 | 610 | 599 | 123.4 |
| A | 8 | 15 | 10287 | 78.54 | 610 | 599 | 123.4 |
| B | 0 | 85 | 16542 | 136.61 | 608 | 591 | 116.8 |
| B | 12 | 111 | 14271 | 117.16 | 608 | 591 | 116.8 |
| B | 0 | 214 | 13844 | 113.51 | 608 | 591 | 116.8 |
| C | 3 | 233 | 495989 | 3587.36 | 593 | 599 | 138.1 |
| C | 13 | 61 | 4210 | 26.15 | 593 | 599 | 138.1 |
| C | 3 | 234 | 3012 | 17.47 | 593 | 599 | 138.1 |
| D | 2 | 234 | 21517 | 147.33 | 592 | 578 | 142.1 |
| D | 2 | 120 | 7833 | 51.05 | 592 | 578 | 142.1 |
| D | 2 | 152 | 7743 | 50.42 | 592 | 578 | 142.1 |
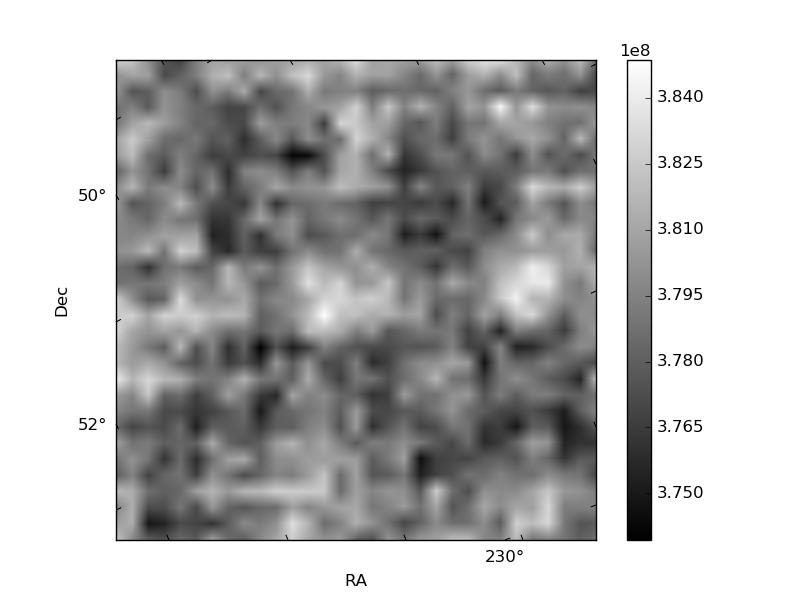
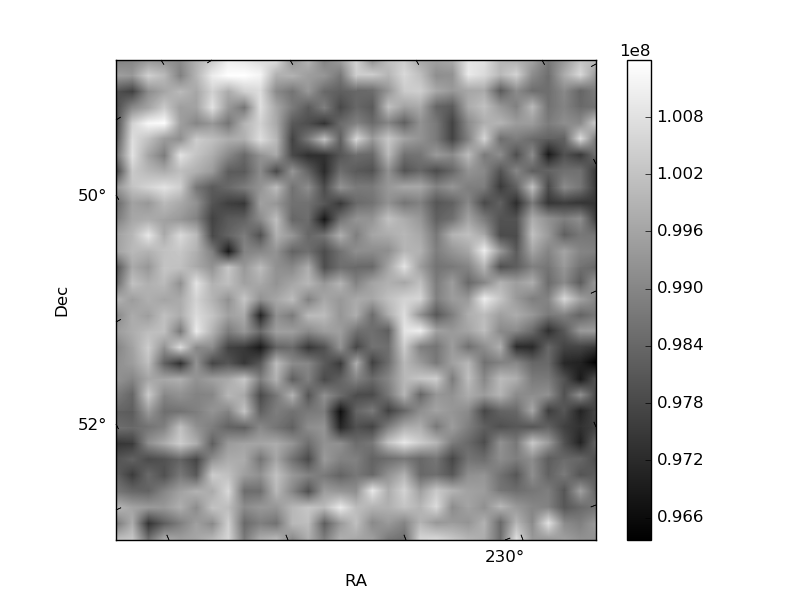
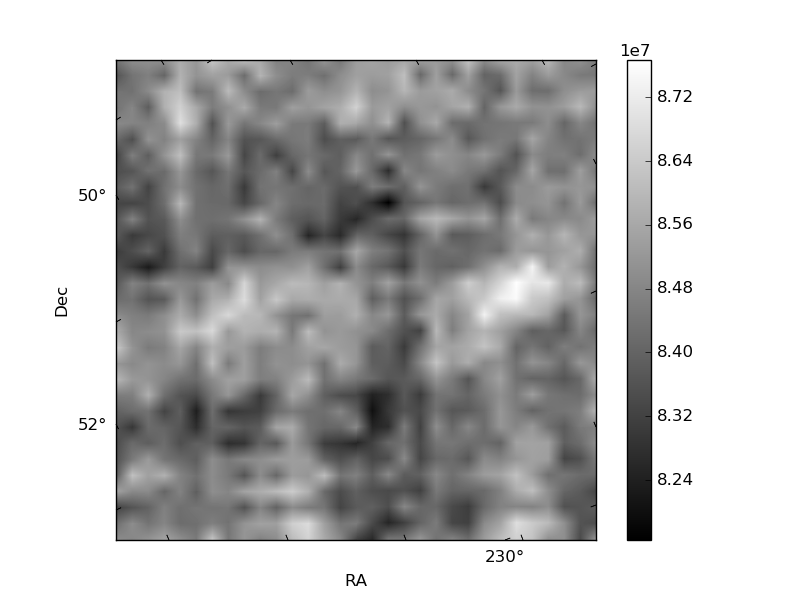
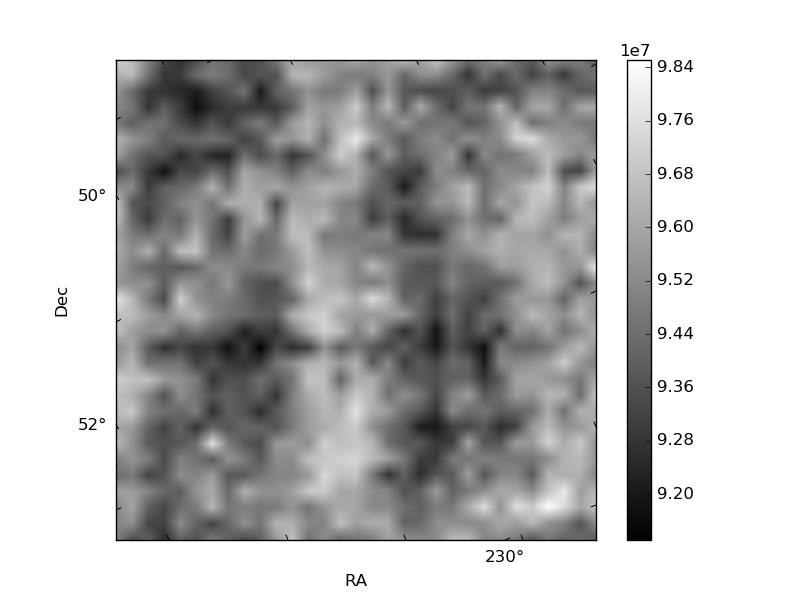
Histogram calculated using DETX and DETY for each event in the final _common_clean file
| Quadrant A | 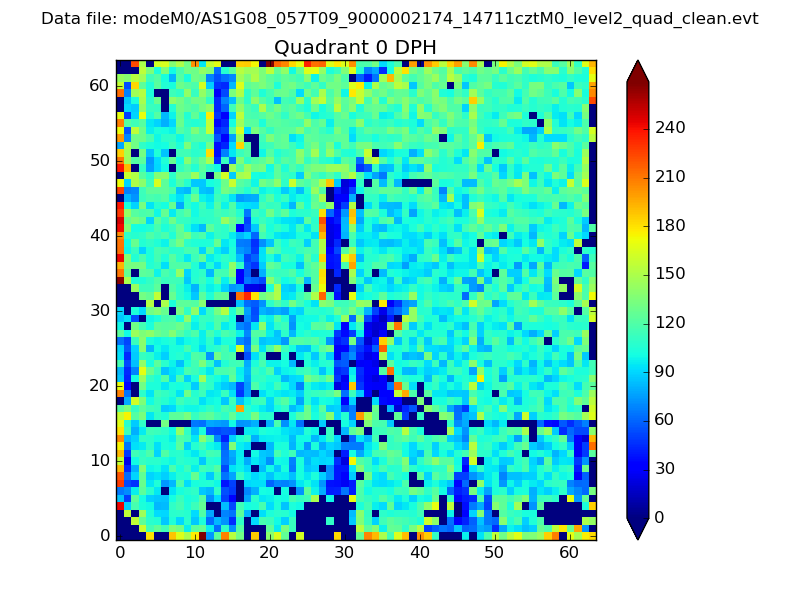 |
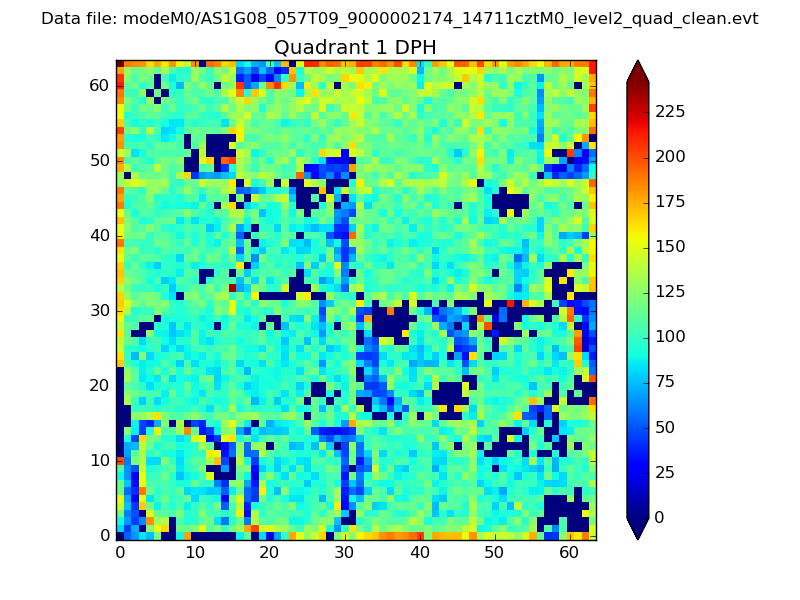 |
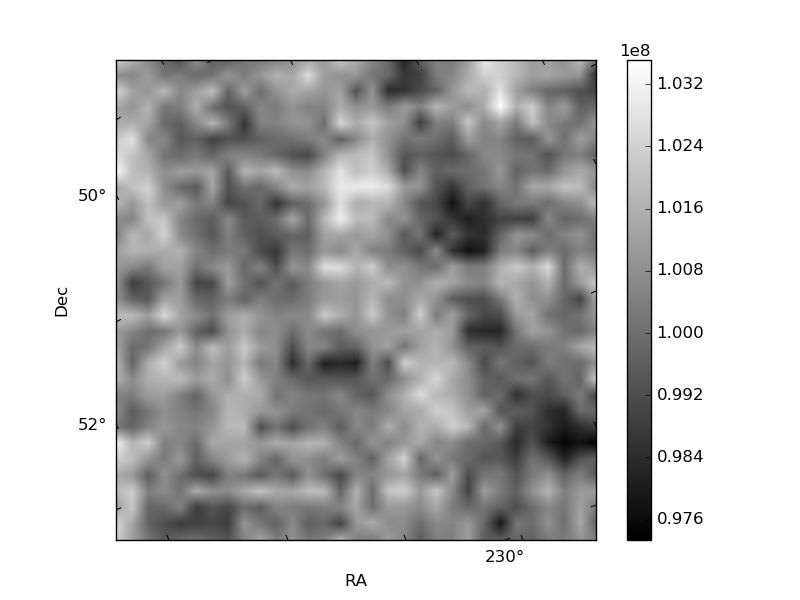
Quadrant B |
|---|---|---|---|
| Quadrant D | 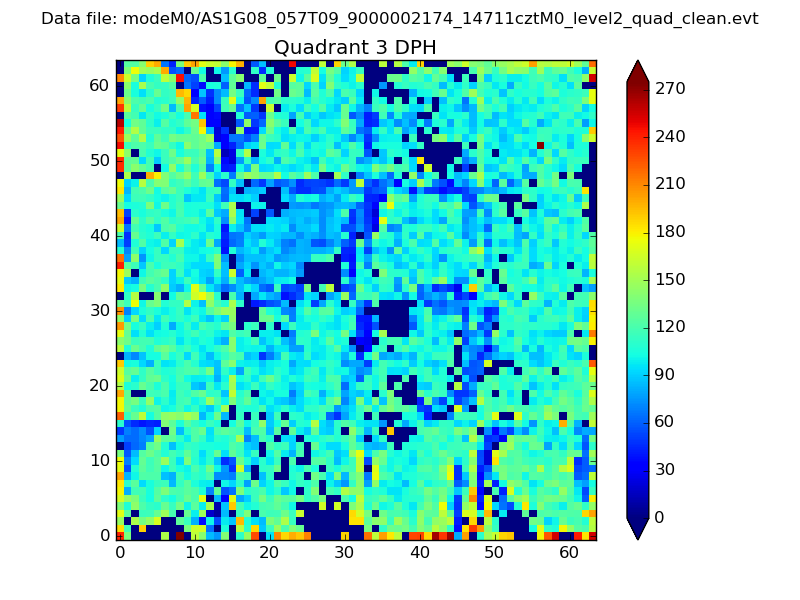 |
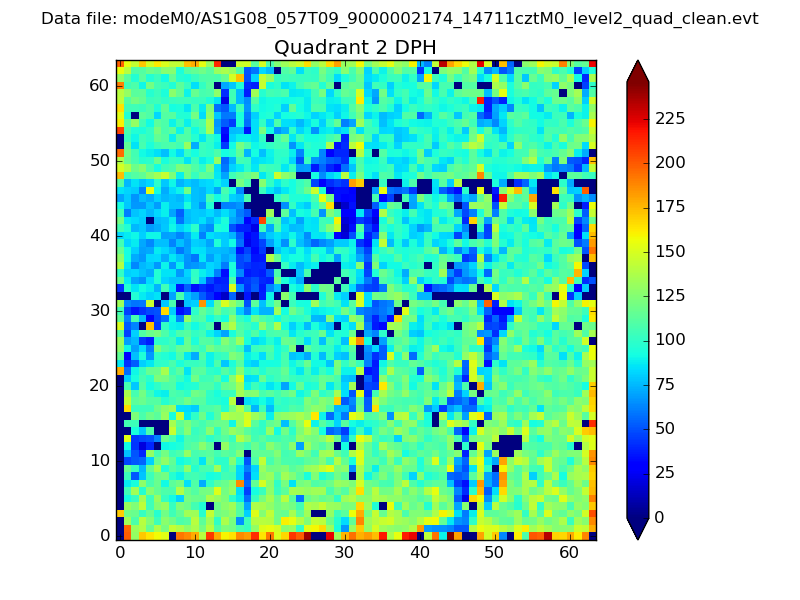 |
Quadrant C |
| Plot type | Count rate plots | Images |
|---|---|---|
| Comparison with Poisson distribution Blue bars denote a histogram of data divided into 1 sec bins. Red curve is a Poisson curve with rate = median count rate of data. |
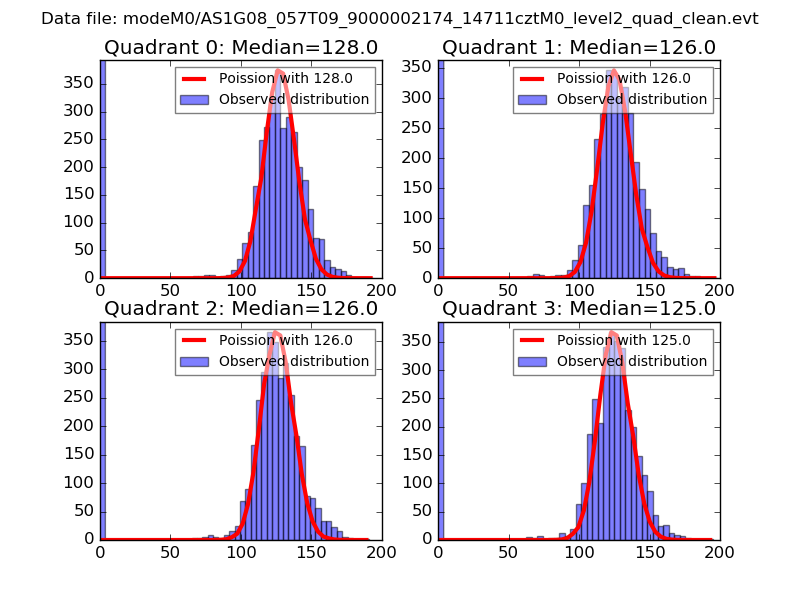 |
 |
| Quadrant-wise count rates Data is divided into 100 sec bins |
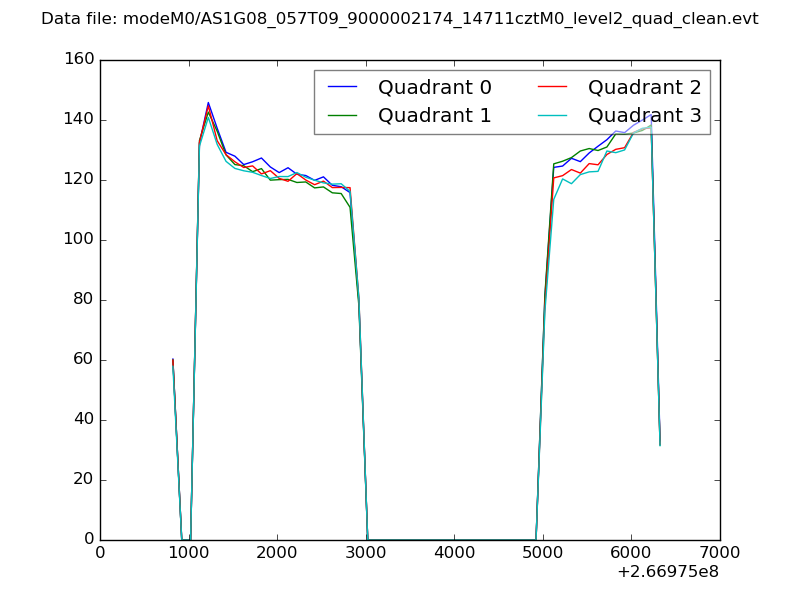 |
|
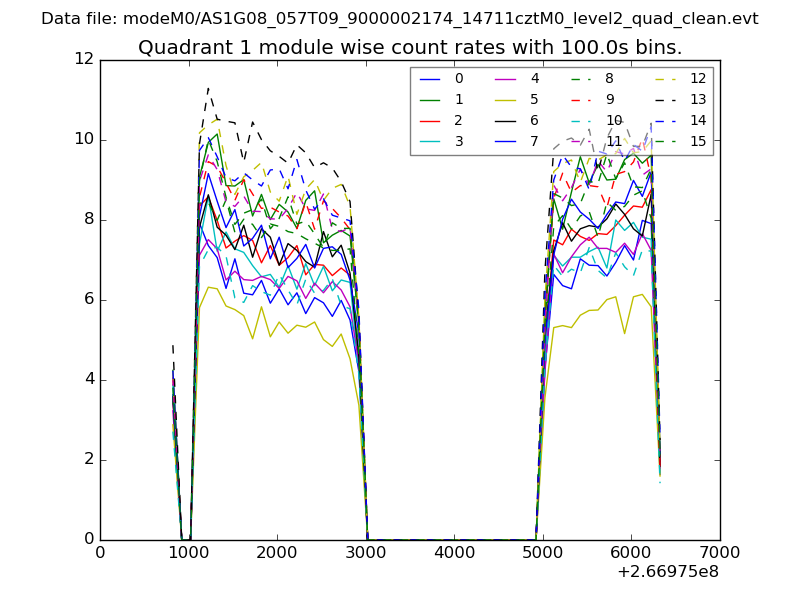
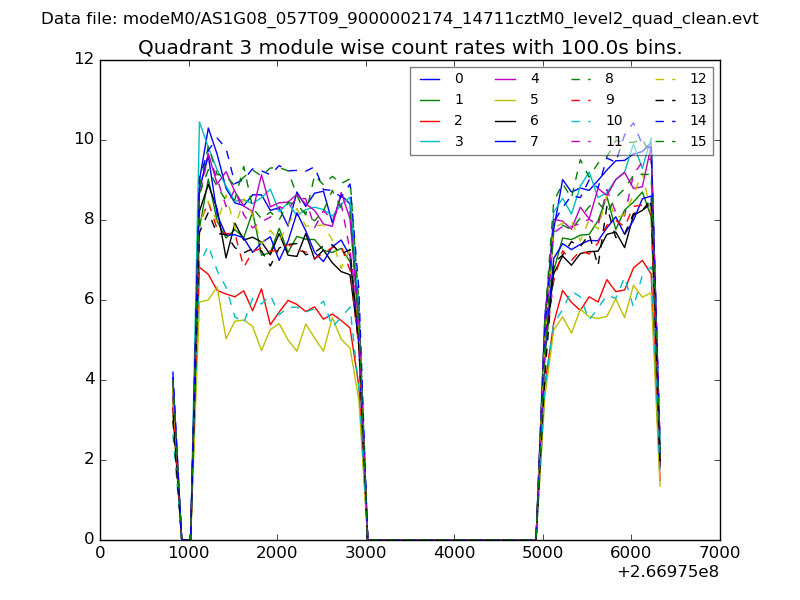
| Module-wise count rates for Quadrant A Data is divided into 100 sec bins |
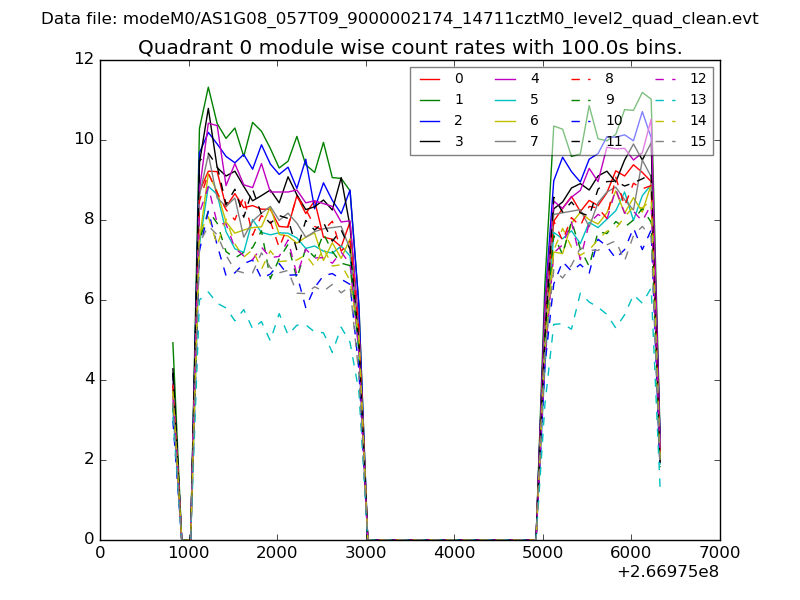 |
 |
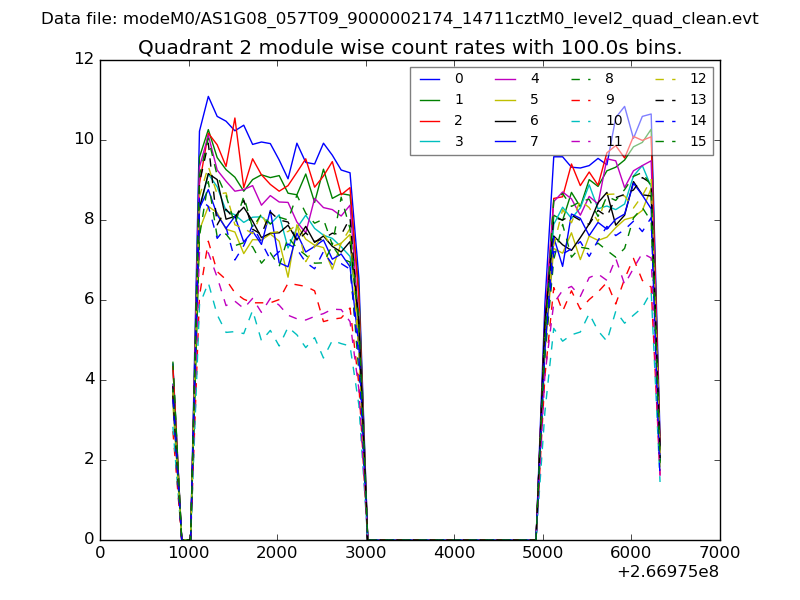
| Module-wise count rates for Quadrant B Data is divided into 100 sec bins |
 |
 |
| Module-wise count rates for Quadrant C Data is divided into 100 sec bins |
 |
 |
| Module-wise count rates for Quadrant D Data is divided into 100 sec bins |
 |
 |
| Parameter | Plot |
|---|---|
| CZT HV Monitor | 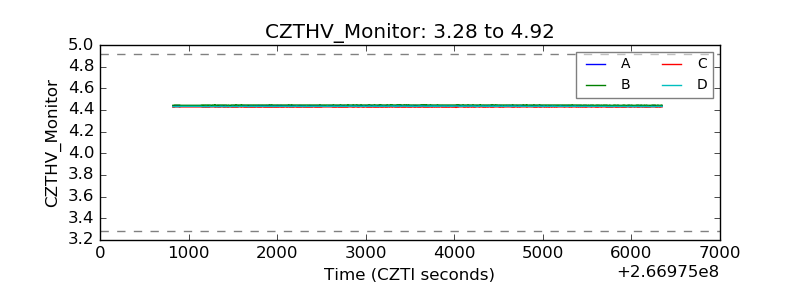 |
| D_VDD | 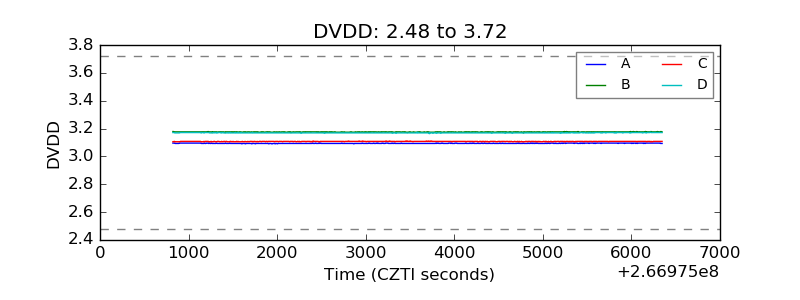 |
| Temperature 1 | 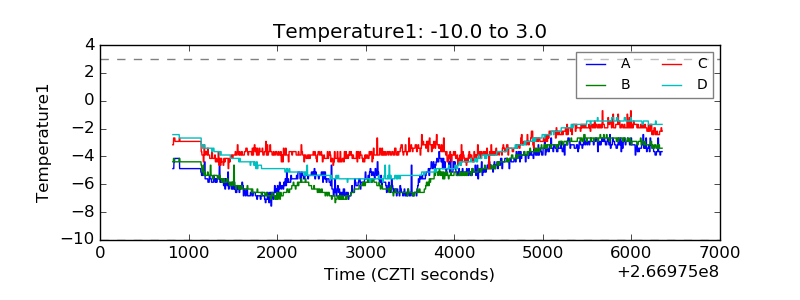 |
| Veto HV Monitor | 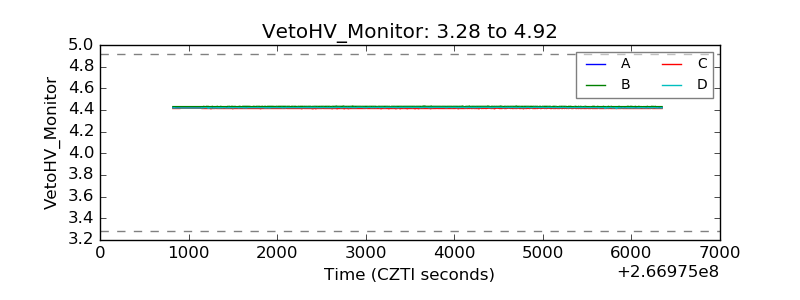 |
| Veto LLD | 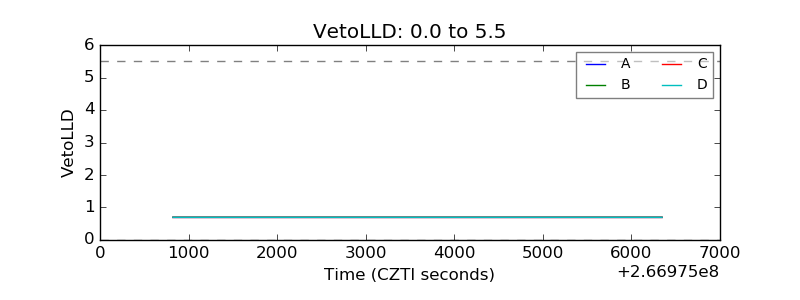 |
| Alpha Counter | 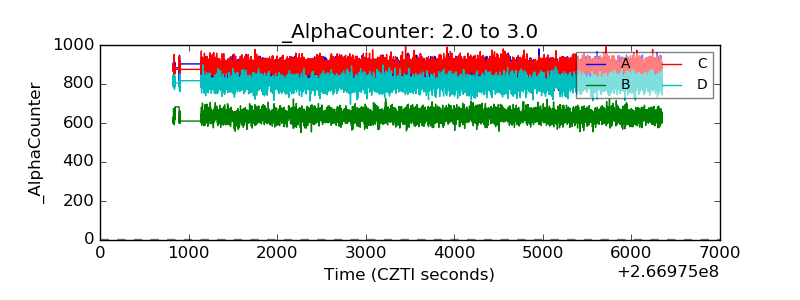 |
| _CPM_Rate | 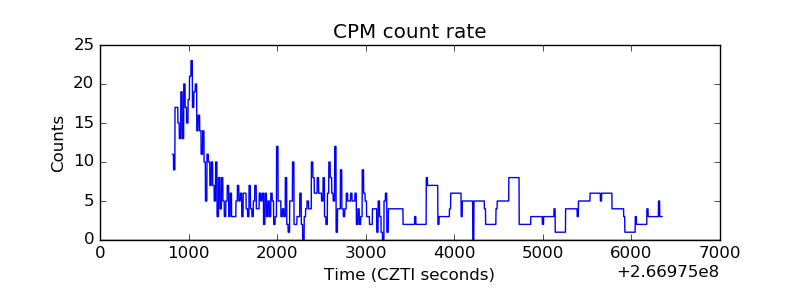 |
| CZT Counter | 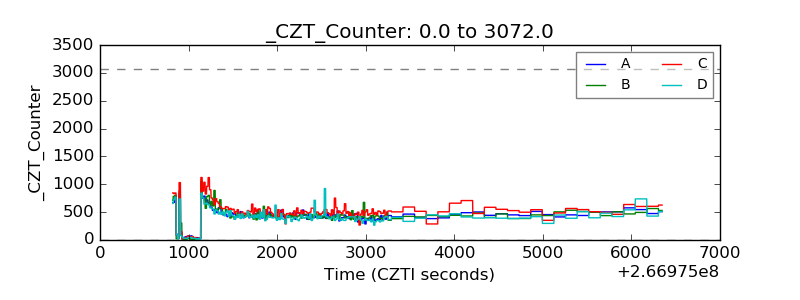 |
| +2.5 Volts monitor | 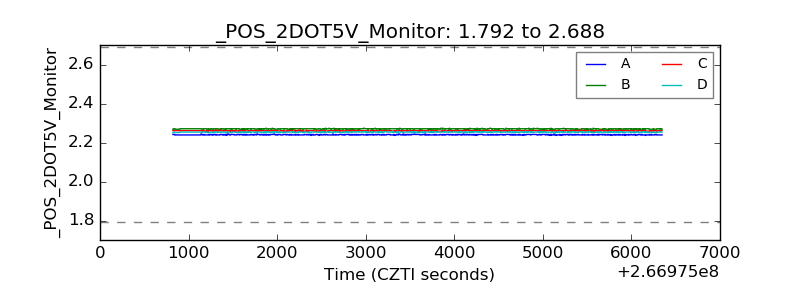 |
| +5 Volts monitor |  |
| _ROLL_ROT | 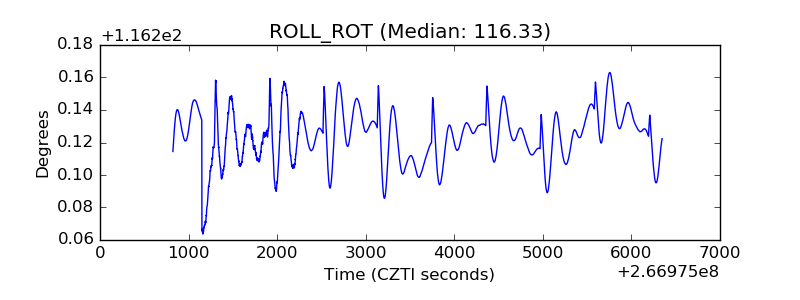 |
| _Roll_DEC | 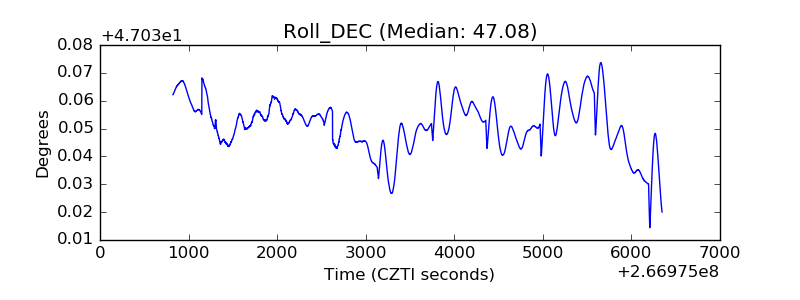 |
| _Roll_RA | 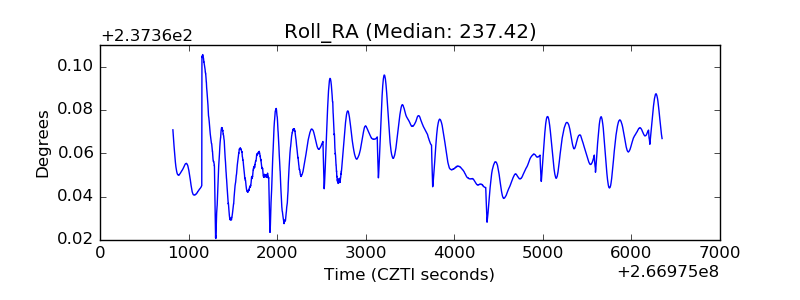 |
| Veto Counter | 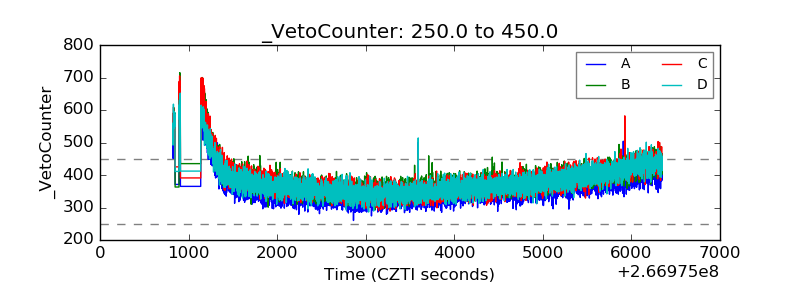 |