| Param | Original file | Final file |
|---|---|---|
| Filename | modeM0/AS1A04_048T01_9000002176cztM0_level2.fits | modeM0/AS1A04_048T01_9000002176cztM0_level2_quad_clean.evt |
| Size (bytes) | 723,720,960 | 740,315,520 |
| Size | 690.2 MB | 706.0 MB |
| Events in quadrant A | 4,448,432 | 4,591,653 |
| Events in quadrant B | 4,255,356 | 4,446,025 |
| Events in quadrant C | 4,278,260 | 4,234,466 |
| Events in quadrant D | 3,785,714 | 3,998,882 |
| Mode M9 | |||
|---|---|---|---|
| Quadrant | BADHDUFLAG | Total packets | Discarded packets |
| A | 0 | 117 | 0 |
| B | 0 | 117 | 0 |
| C | 0 | 117 | 0 |
| D | 0 | 117 | 0 |
| Mode M0 | |||
|---|---|---|---|
| Quadrant | BADHDUFLAG | Total packets | Discarded packets |
| A | 0 | 161390 | 0 |
| B | 0 | 160808 | 0 |
| C | 0 | 175612 | 0 |
| D | 0 | 166715 | 0 |
| Mode SS | |||
|---|---|---|---|
| Quadrant | BADHDUFLAG | Total packets | Discarded packets |
| A | 0 | 1526 | 0 |
| B | 0 | 1526 | 0 |
| C | 0 | 1526 | 0 |
| D | 0 | 1526 | 0 |
| Quadrant | Total seconds | Saturated seconds | Saturation percentage |
|---|---|---|---|
| A | 75124 | 781 | 1.039615% |
| B | 75124 | 867 | 1.154092% |
| C | 75124 | 790 | 1.051595% |
| D | 75124 | 1309 | 1.742452% |
Noise dominated data is calculated using 1-second bins in cleaned event files. If a bin has >2000 counts, and if more than 50% of those come from <1% of pixels, then it is considered to be noise-dominated and hence unusable.
| Quadrant | # 1 sec bins | Bins with >0 counts | Bins with >2000 counts | High rate bins dominated by noise | Noise dominated (total time) | Noise dominated (detector-on time) | Marked lightcurve |
|---|---|---|---|---|---|---|---|
| A | 86663 | 75112 | 0 | 0 | 0.00% | 0.00% | 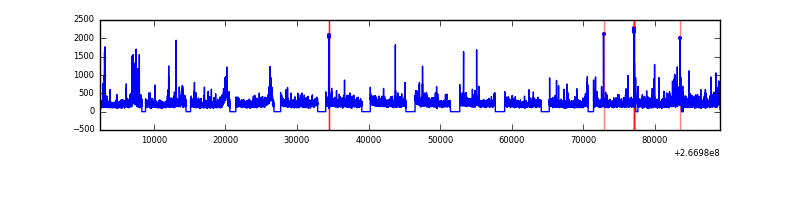 |
| B | 86663 | 75115 | 0 | 0 | 0.00% | 0.00% | 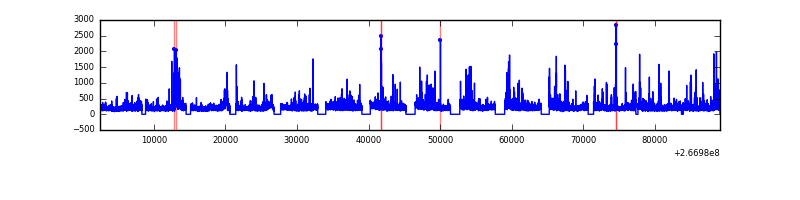 |
| C | 86663 | 75107 | 0 | 0 | 0.00% | 0.00% | 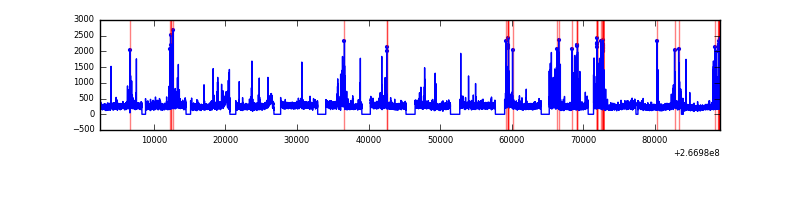 |
| D | 86663 | 75038 | 0 | 0 | 0.00% | 0.00% | 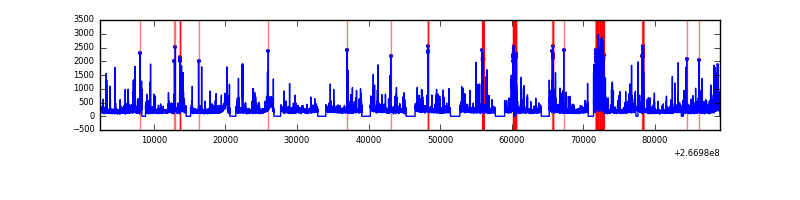 |
Top three noisy pixels from each quadrant. If the there are fewer than three noisy pixels in the level2.evt file, extra rows are filled as -1
| Pixel properties | Quadrant properties | ||||||
|---|---|---|---|---|---|---|---|
| Quadrant | DetID | PixID | Counts | Sigma | Mean | Median | Sigma |
| A | 0 | 29 | 4345 | 11.28 | 1158 | 1083 | 289.1 |
| A | 7 | 110 | 3665 | 8.93 | 1158 | 1083 | 289.1 |
| A | 9 | 19 | 3369 | 7.9 | 1158 | 1083 | 289.1 |
| B | 2 | 9 | 3679 | 11.9 | 1124 | 1076 | 218.8 |
| B | 14 | 254 | 2925 | 8.45 | 1124 | 1076 | 218.8 |
| B | 5 | 128 | 2869 | 8.2 | 1124 | 1076 | 218.8 |
| C | 1 | 80 | 3284 | 7.66 | 1130 | 1054 | 291.0 |
| C | 1 | 81 | 3192 | 7.35 | 1130 | 1054 | 291.0 |
| C | 12 | 241 | 2985 | 6.63 | 1130 | 1054 | 291.0 |
| D | 3 | 14 | 2814 | 6.27 | 1080 | 981 | 292.3 |
| D | 6 | 231 | 2802 | 6.23 | 1080 | 981 | 292.3 |
| D | 10 | 189 | 2720 | 5.95 | 1080 | 981 | 292.3 |
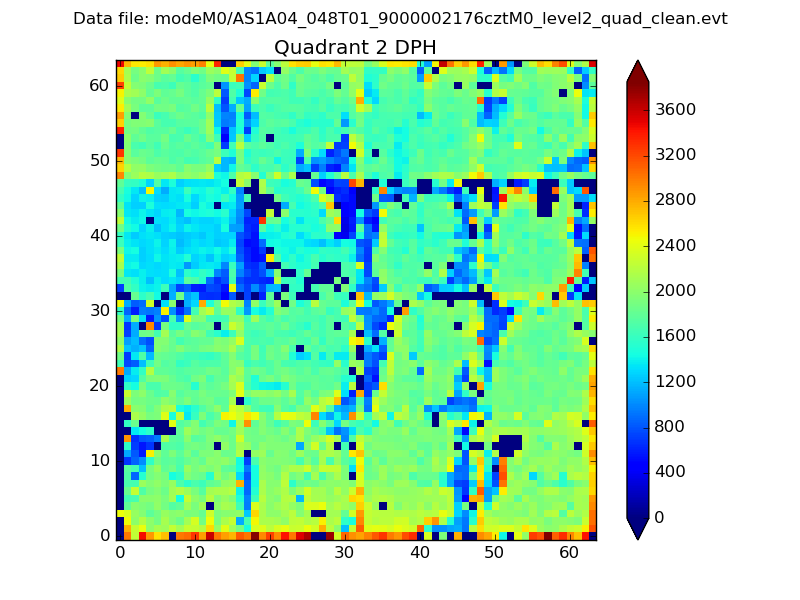
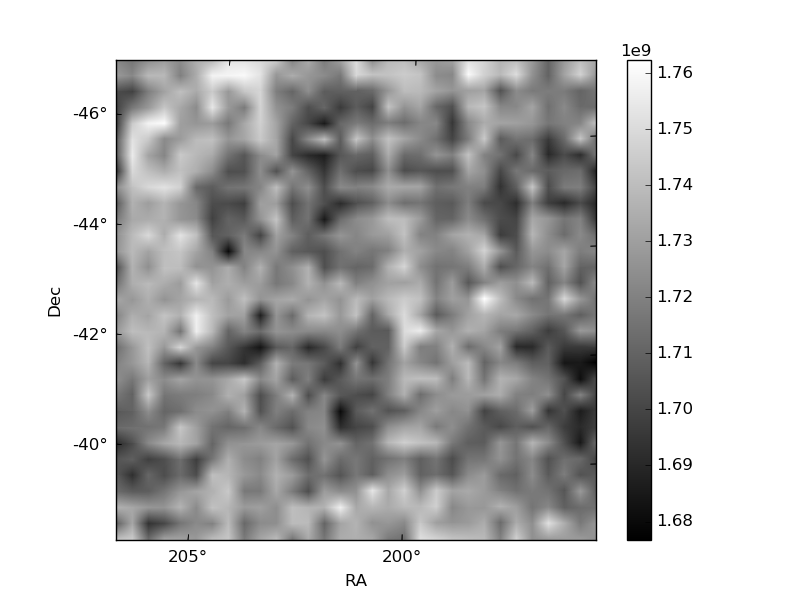
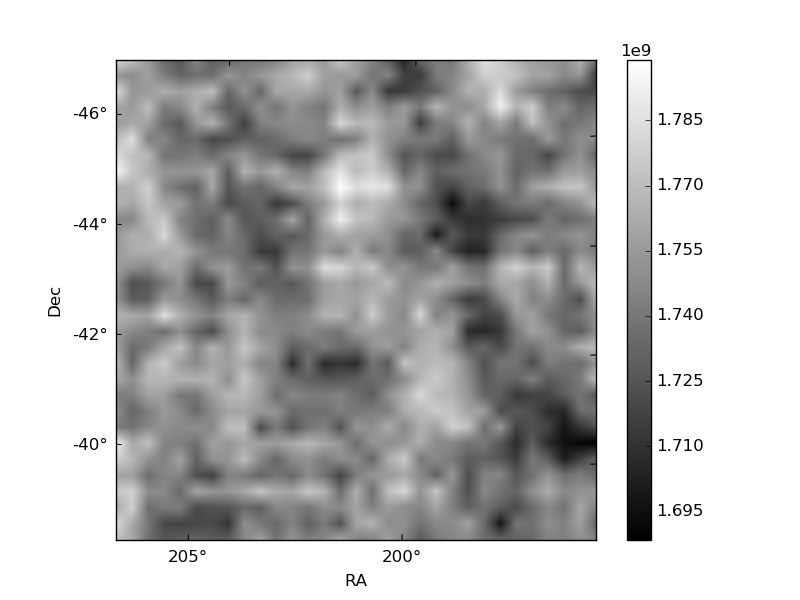
Histogram calculated using DETX and DETY for each event in the final _common_clean file
| Quadrant A | 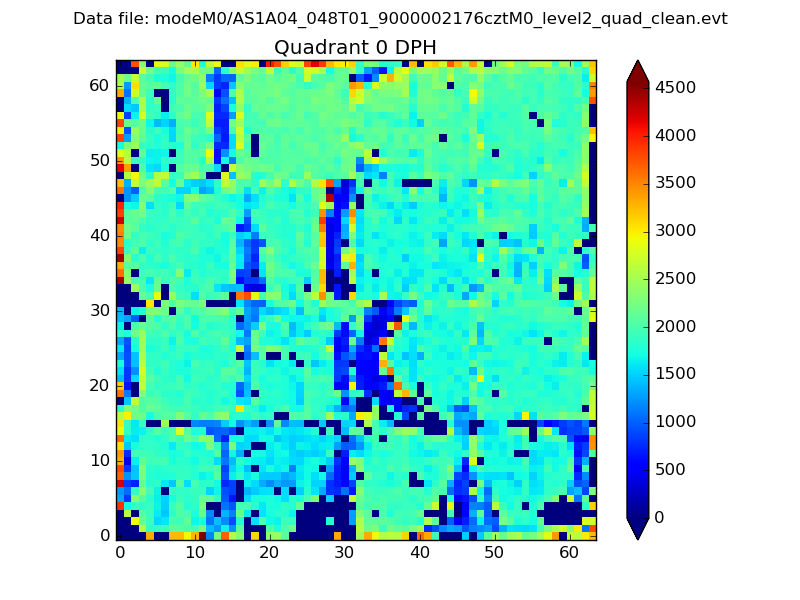 |
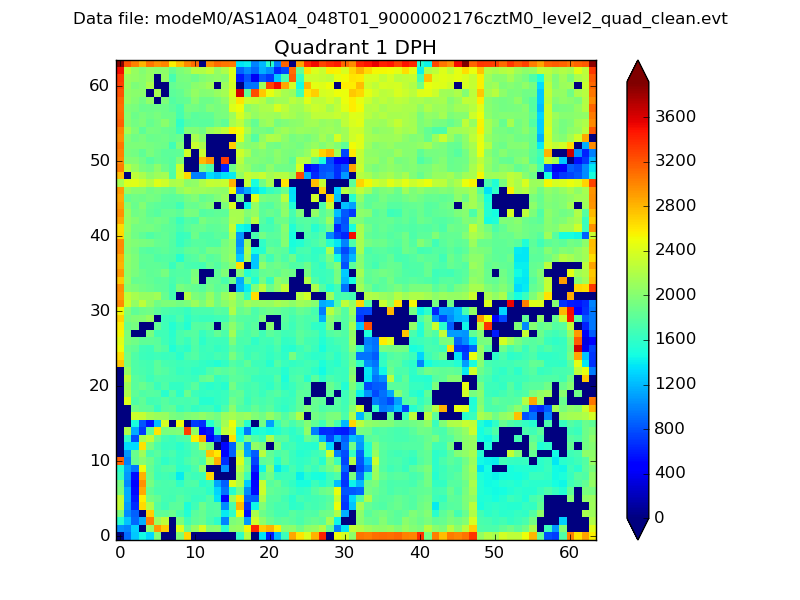 |
Quadrant B |
|---|---|---|---|
| Quadrant D | 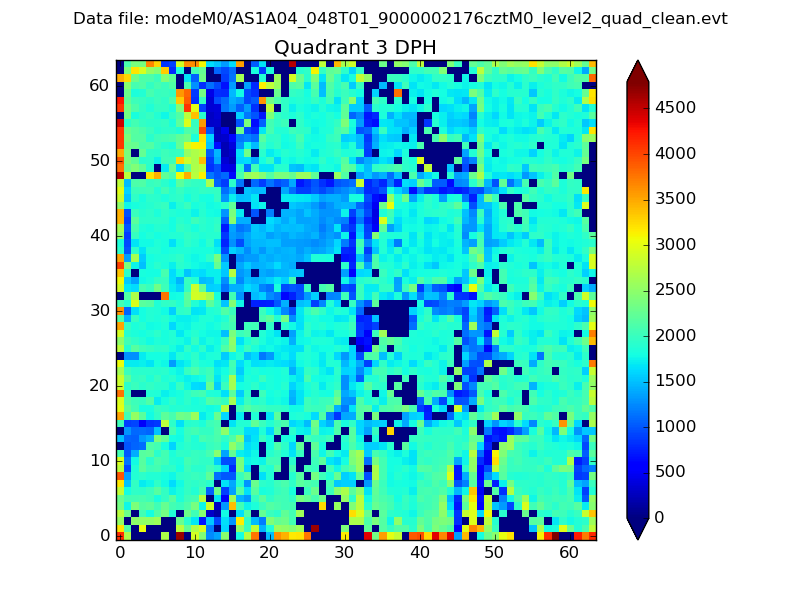 |
 |
Quadrant C |
| Plot type | Count rate plots | Images |
|---|---|---|
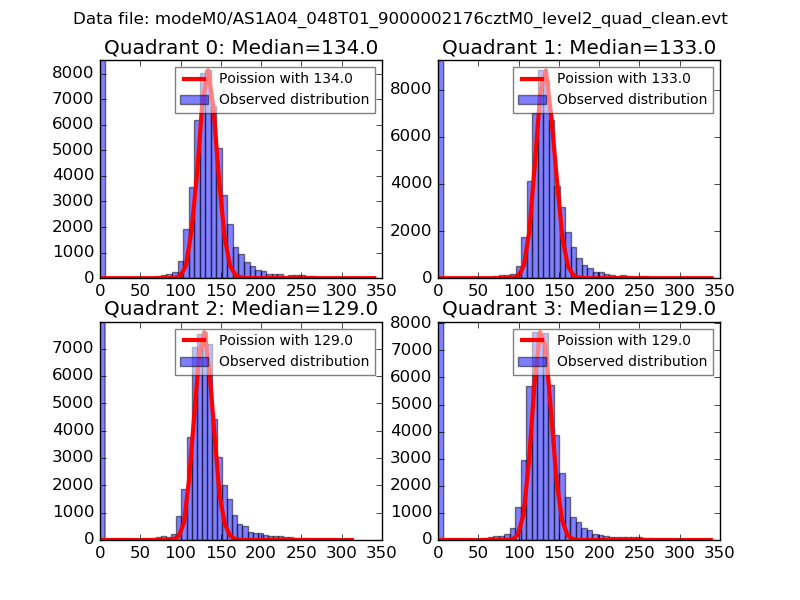
| Comparison with Poisson distribution Blue bars denote a histogram of data divided into 1 sec bins. Red curve is a Poisson curve with rate = median count rate of data. |
 |
 |
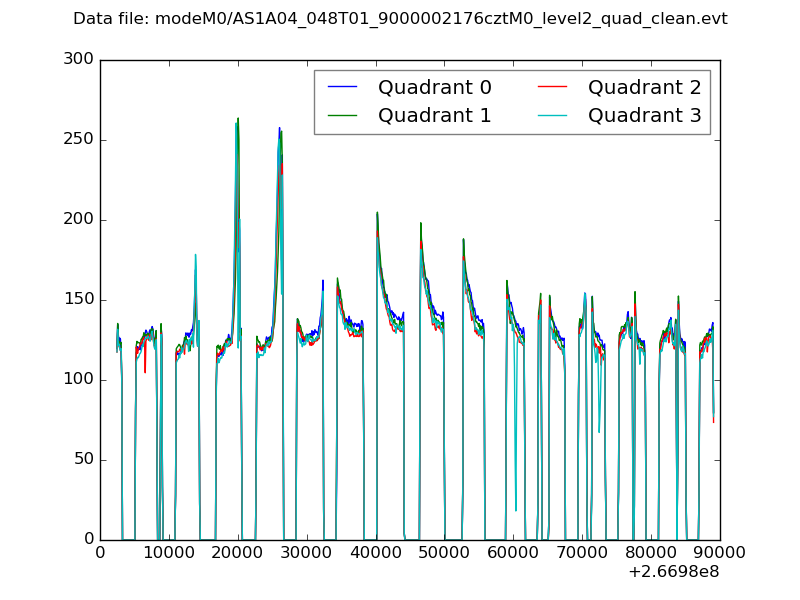
| Quadrant-wise count rates Data is divided into 100 sec bins |
 |
|
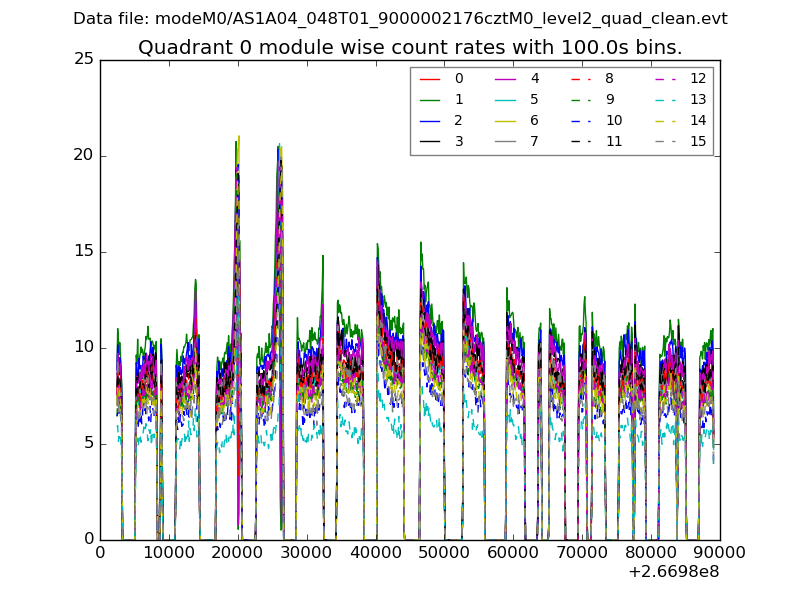
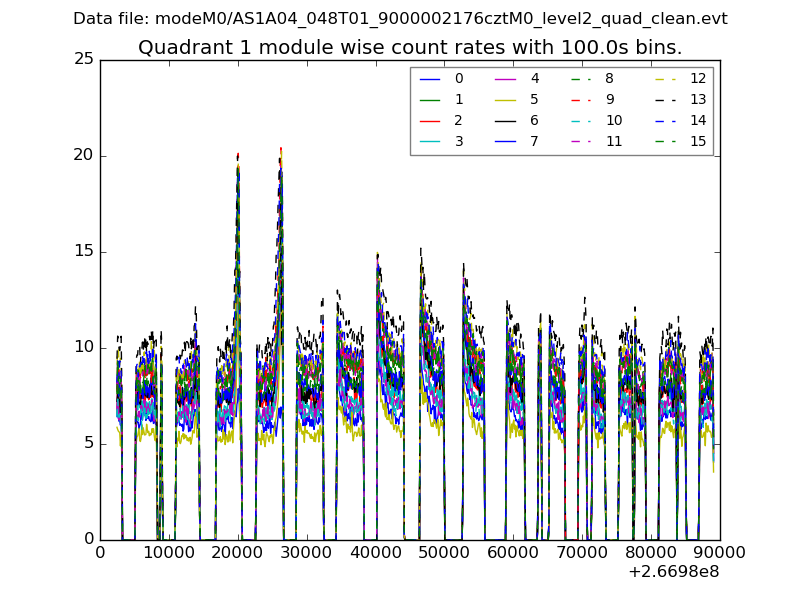
| Module-wise count rates for Quadrant A Data is divided into 100 sec bins |
 |
 |
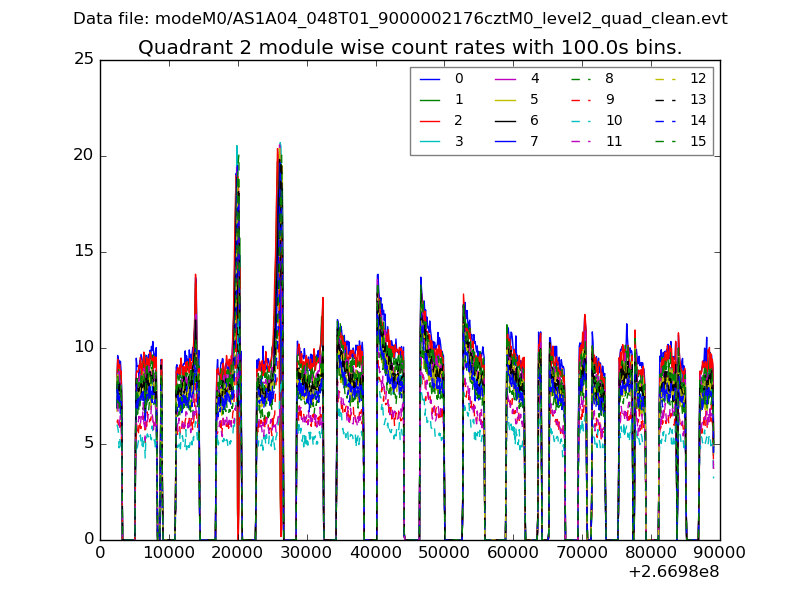
| Module-wise count rates for Quadrant B Data is divided into 100 sec bins |
 |
 |
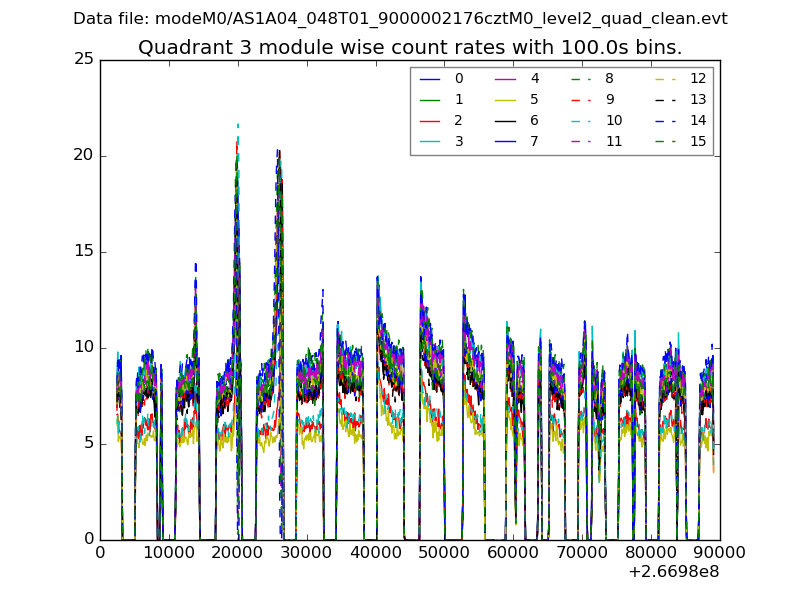
| Module-wise count rates for Quadrant C Data is divided into 100 sec bins |
 |
 |
| Module-wise count rates for Quadrant D Data is divided into 100 sec bins |
 |
 |
| Parameter | Plot |
|---|---|
| CZT HV Monitor | 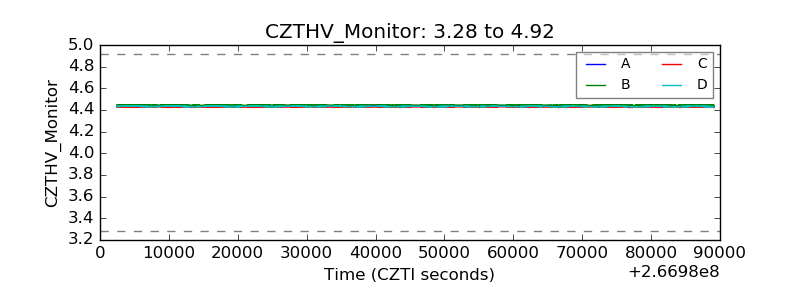 |
| D_VDD | 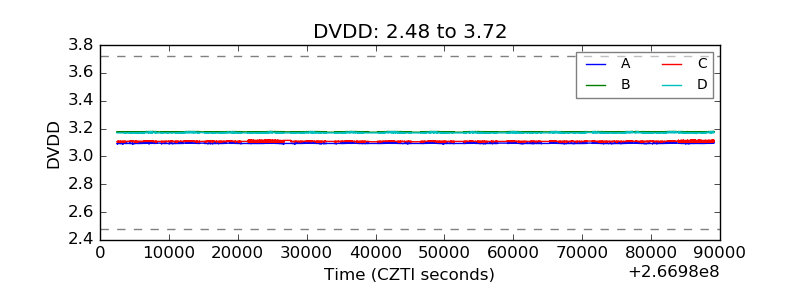 |
| Temperature 1 | 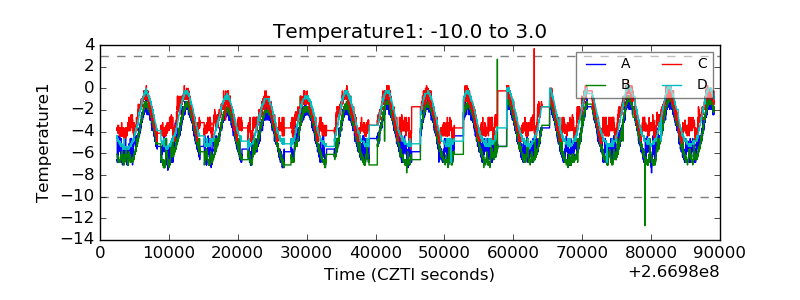 |
| Veto HV Monitor | 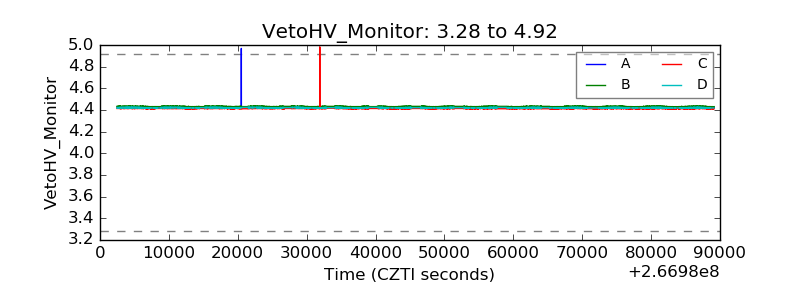 |
| Veto LLD | 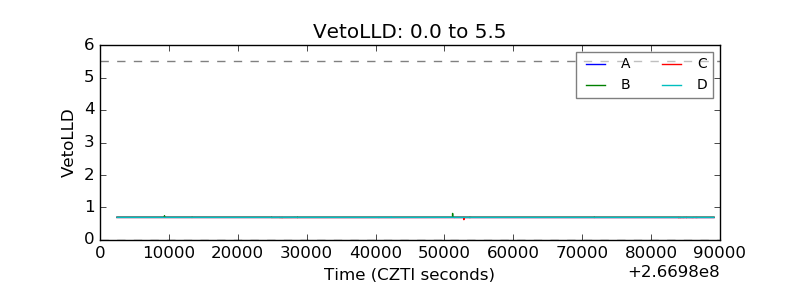 |
| Alpha Counter | 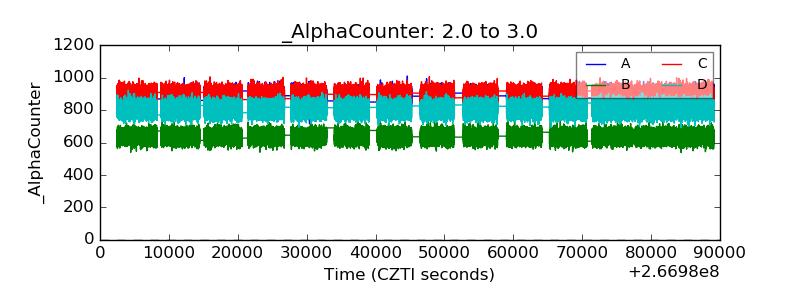 |
| _CPM_Rate | 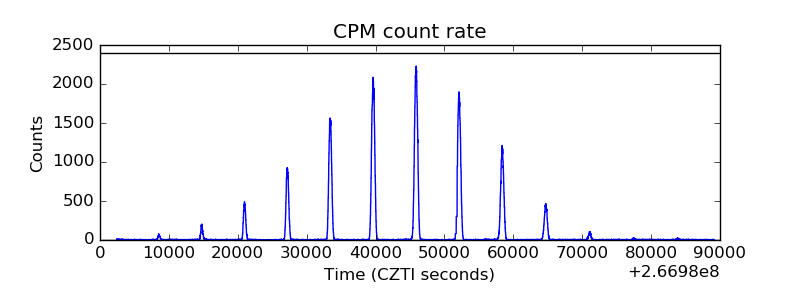 |
| CZT Counter | 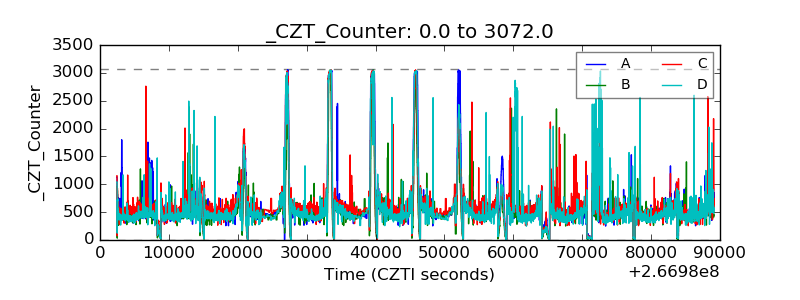 |
| +2.5 Volts monitor | 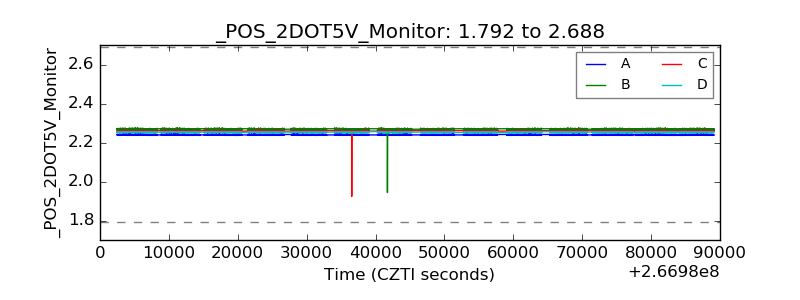 |
| +5 Volts monitor | 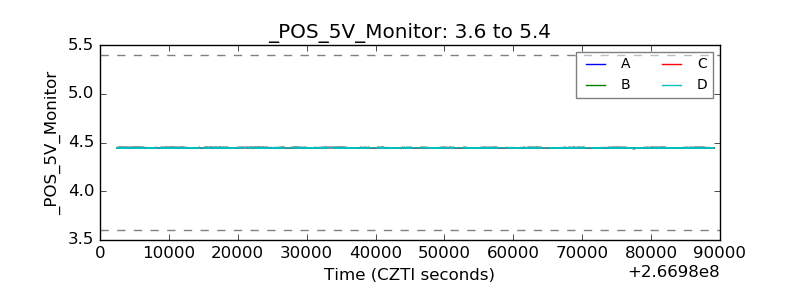 |
| _ROLL_ROT | 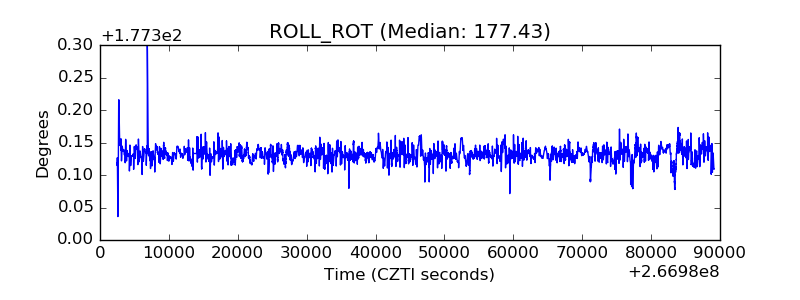 |
| _Roll_DEC | 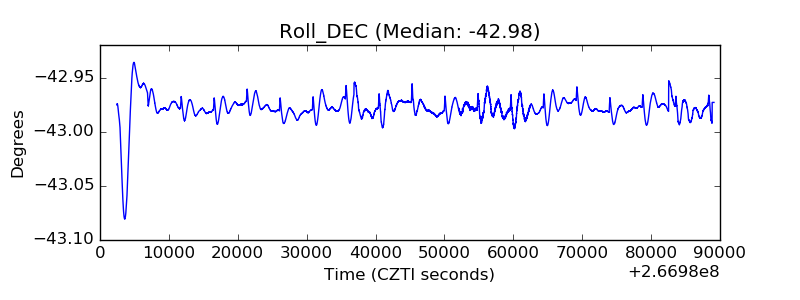 |
| _Roll_RA | 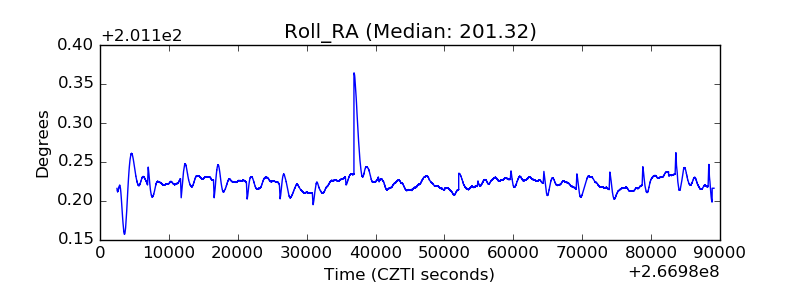 |
| Veto Counter | 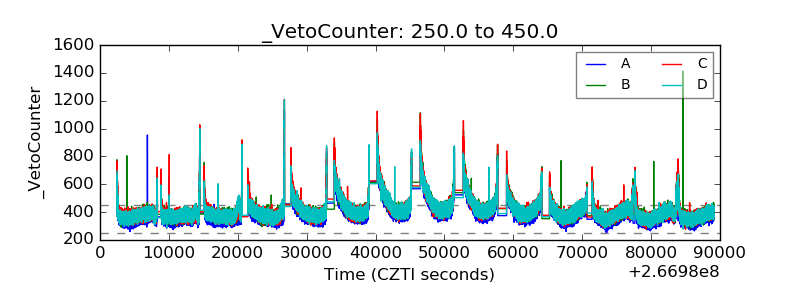 |