| Param | Original file | Final file |
|---|---|---|
| Filename | modeM0/AS1A04_048T01_9000002176_14715cztM0_level2.evt | modeM0/AS1A04_048T01_9000002176_14715cztM0_level2_quad_clean.evt |
| Size (bytes) | 481,844,160 | 101,701,440 |
| Size | 459.5 MB | 97.0 MB |
| Events in quadrant A | 3,492,519 | 668,906 |
| Events in quadrant B | 3,376,108 | 646,849 |
| Events in quadrant C | 3,883,170 | 648,544 |
| Events in quadrant D | 3,384,901 | 647,584 |
| Mode M9 | |||
|---|---|---|---|
| Quadrant | BADHDUFLAG | Total packets | Discarded packets |
| A | 0 | 10 | 0 |
| B | 0 | 10 | 0 |
| C | 0 | 10 | 0 |
| D | 0 | 11 | 0 |
| Mode M0 | |||
|---|---|---|---|
| Quadrant | BADHDUFLAG | Total packets | Discarded packets |
| A | 0 | 14543 | 3 |
| B | 0 | 14253 | 2 |
| C | 0 | 15769 | 2 |
| D | 0 | 14520 | 2 |
| Mode SS | |||
|---|---|---|---|
| Quadrant | BADHDUFLAG | Total packets | Discarded packets |
| A | 0 | 136 | 0 |
| B | 0 | 136 | 0 |
| C | 0 | 136 | 0 |
| D | 0 | 136 | 0 |
| Quadrant | Total seconds | Saturated seconds | Saturation percentage |
|---|---|---|---|
| A | 6718 | 79 | 1.175945% |
| B | 6718 | 83 | 1.235487% |
| C | 6718 | 79 | 1.175945% |
| D | 6718 | 75 | 1.116404% |
Noise dominated data is calculated using 1-second bins in cleaned event files. If a bin has >2000 counts, and if more than 50% of those come from <1% of pixels, then it is considered to be noise-dominated and hence unusable.
| Quadrant | # 1 sec bins | Bins with >0 counts | Bins with >2000 counts | High rate bins dominated by noise | Noise dominated (total time) | Noise dominated (detector-on time) | Marked lightcurve |
|---|---|---|---|---|---|---|---|
| A | 7664 | 6719 | 0 | 0 | 0.00% | 0.00% | 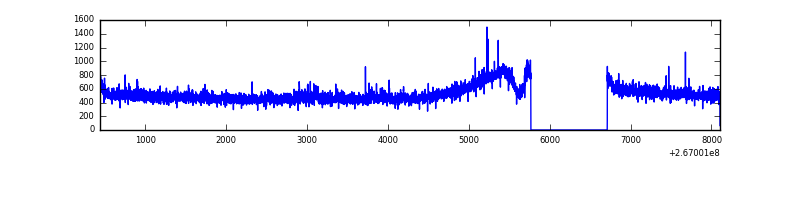 |
| B | 7664 | 6719 | 1 | 1 | 0.01% | 0.01% | 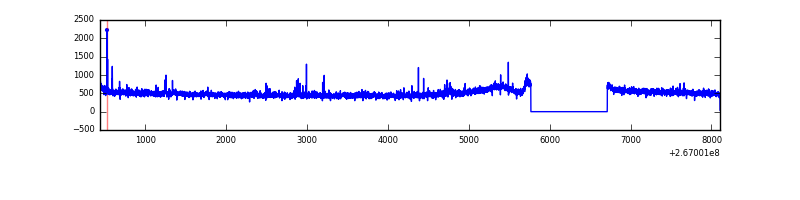 |
| C | 7664 | 6719 | 2 | 2 | 0.03% | 0.03% | 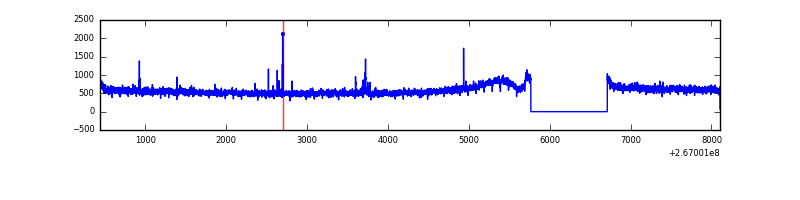 |
| D | 7664 | 6719 | 9 | 9 | 0.12% | 0.13% | 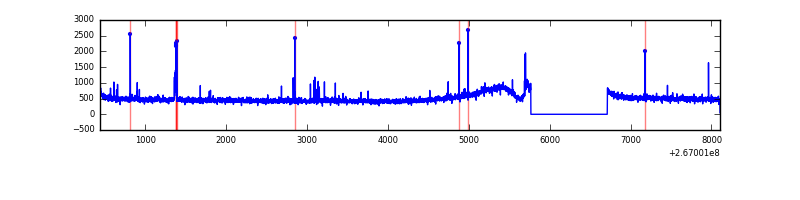 |
Top three noisy pixels from each quadrant. If the there are fewer than three noisy pixels in the level2.evt file, extra rows are filled as -1
| Pixel properties | Quadrant properties | ||||||
|---|---|---|---|---|---|---|---|
| Quadrant | DetID | PixID | Counts | Sigma | Mean | Median | Sigma |
| A | 12 | 189 | 48784 | 259.54 | 888 | 876 | 184.6 |
| A | 3 | 1 | 12133 | 60.98 | 888 | 876 | 184.6 |
| A | 9 | 143 | 10374 | 51.45 | 888 | 876 | 184.6 |
| B | 0 | 205 | 32174 | 190.45 | 853 | 833 | 164.6 |
| B | 12 | 111 | 18270 | 105.96 | 853 | 833 | 164.6 |
| B | 11 | 111 | 15741 | 90.59 | 853 | 833 | 164.6 |
| C | 3 | 233 | 515232 | 2531.09 | 851 | 860 | 203.2 |
| C | 0 | 207 | 15755 | 73.29 | 851 | 860 | 203.2 |
| C | 8 | 128 | 11994 | 54.79 | 851 | 860 | 203.2 |
| D | 13 | 104 | 24887 | 111.48 | 871 | 858 | 215.5 |
| D | 2 | 234 | 24794 | 111.05 | 871 | 858 | 215.5 |
| D | 2 | 120 | 13015 | 56.4 | 871 | 858 | 215.5 |
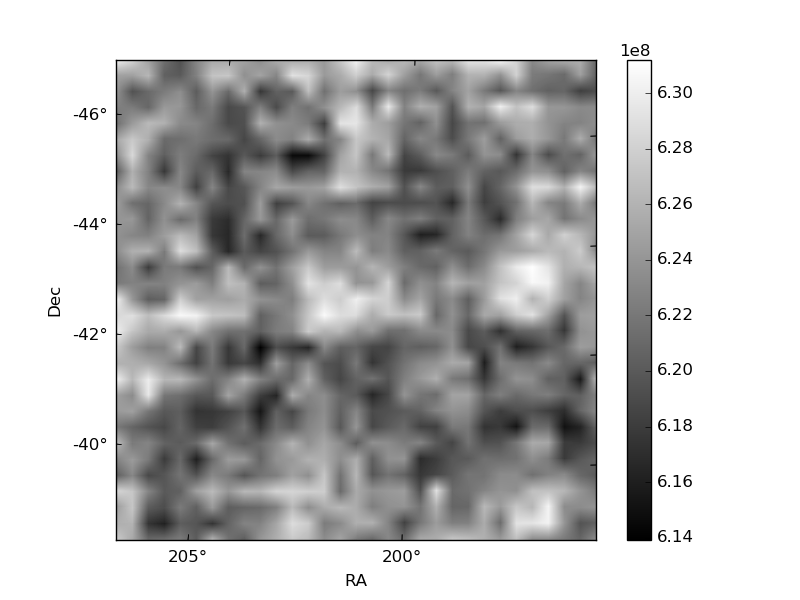
Histogram calculated using DETX and DETY for each event in the final _common_clean file
| Quadrant A | 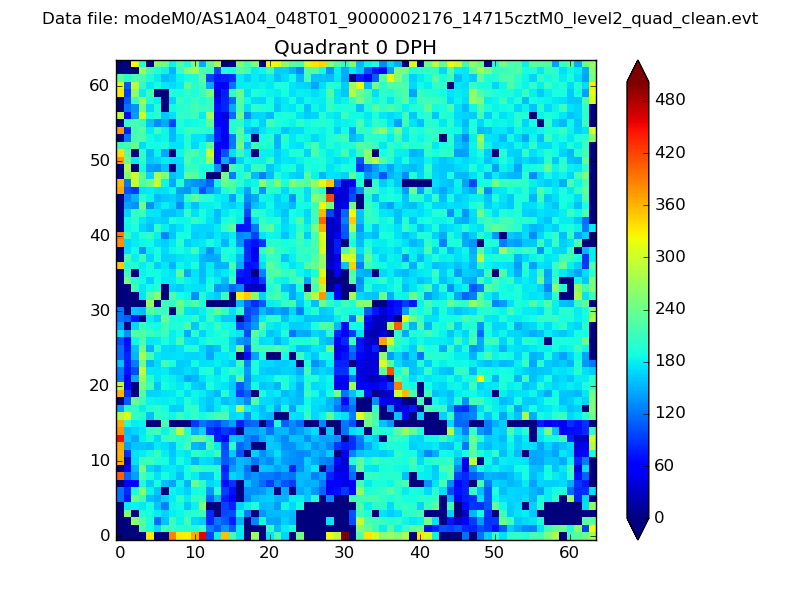 |
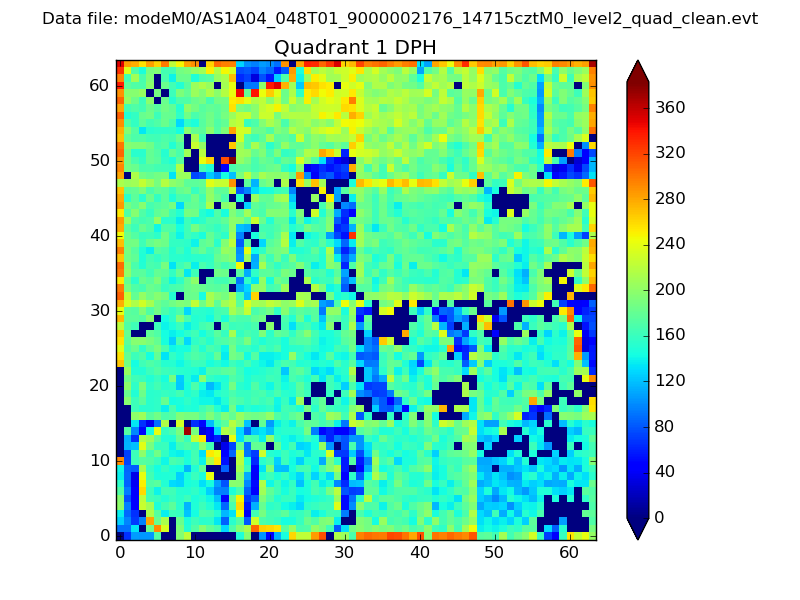 |
Quadrant B |
|---|---|---|---|
| Quadrant D | 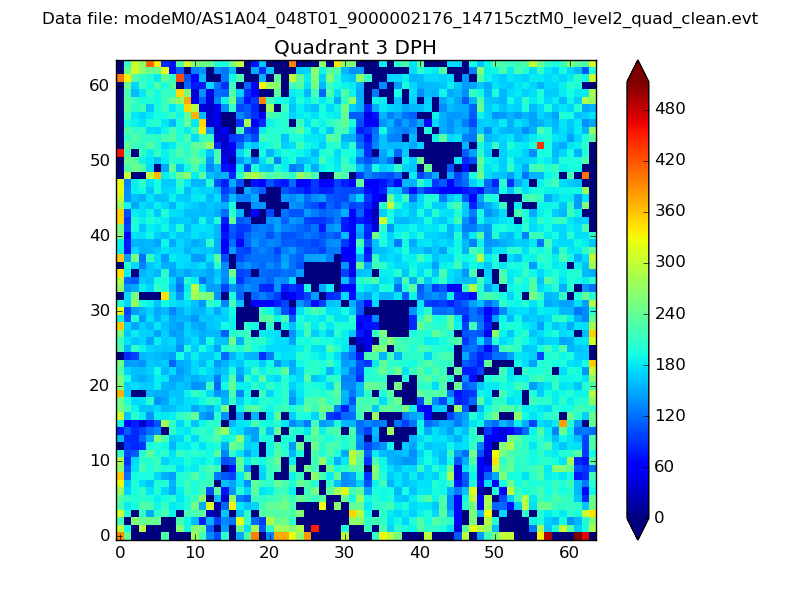 |
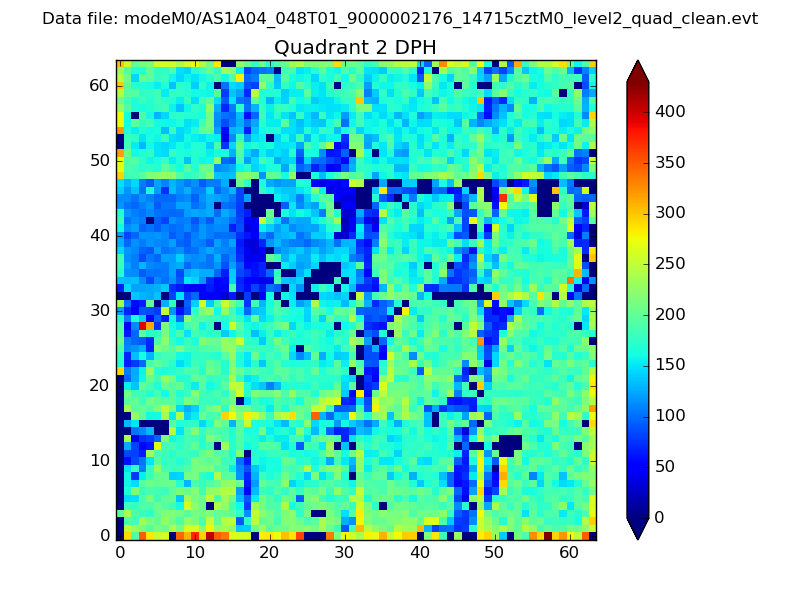 |
Quadrant C |
| Plot type | Count rate plots | Images |
|---|---|---|
| Comparison with Poisson distribution Blue bars denote a histogram of data divided into 1 sec bins. Red curve is a Poisson curve with rate = median count rate of data. |
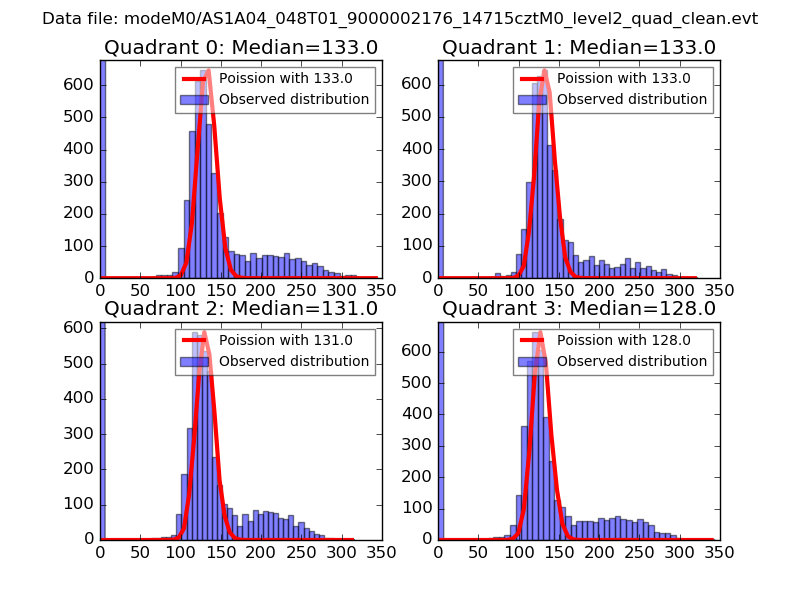 |
 |
| Quadrant-wise count rates Data is divided into 100 sec bins |
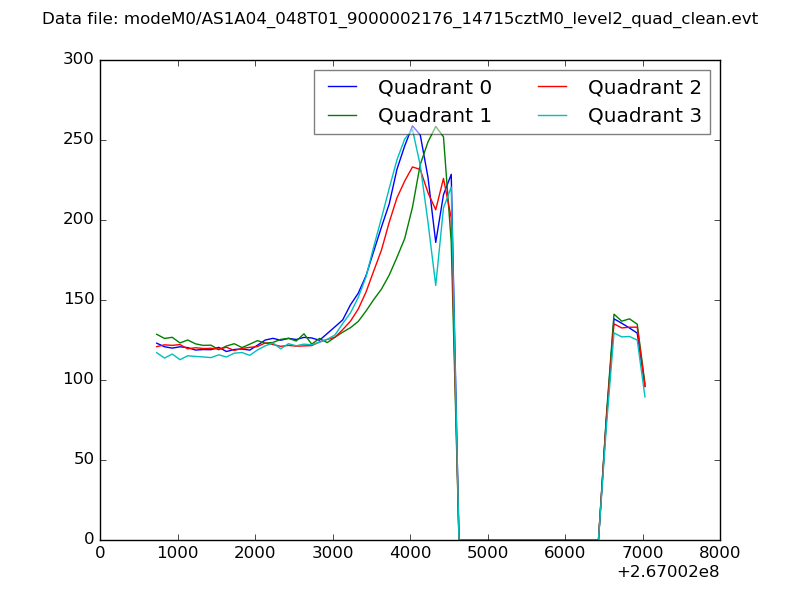 |
|
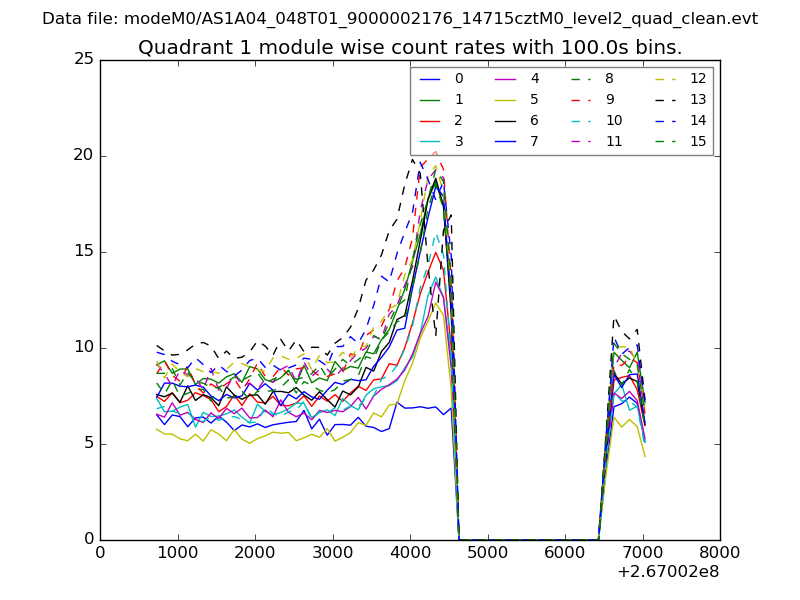
| Module-wise count rates for Quadrant A Data is divided into 100 sec bins |
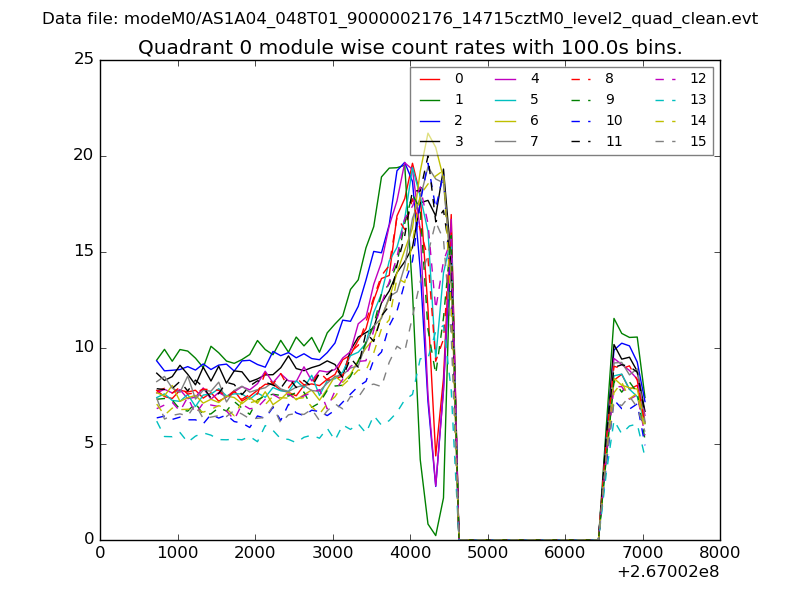 |
 |
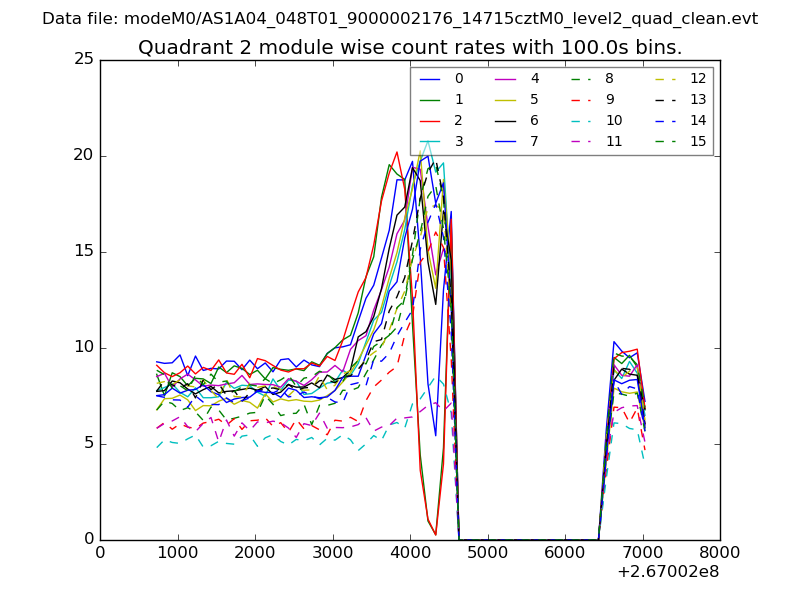
| Module-wise count rates for Quadrant B Data is divided into 100 sec bins |
 |
 |
| Module-wise count rates for Quadrant C Data is divided into 100 sec bins |
 |
 |
| Module-wise count rates for Quadrant D Data is divided into 100 sec bins |
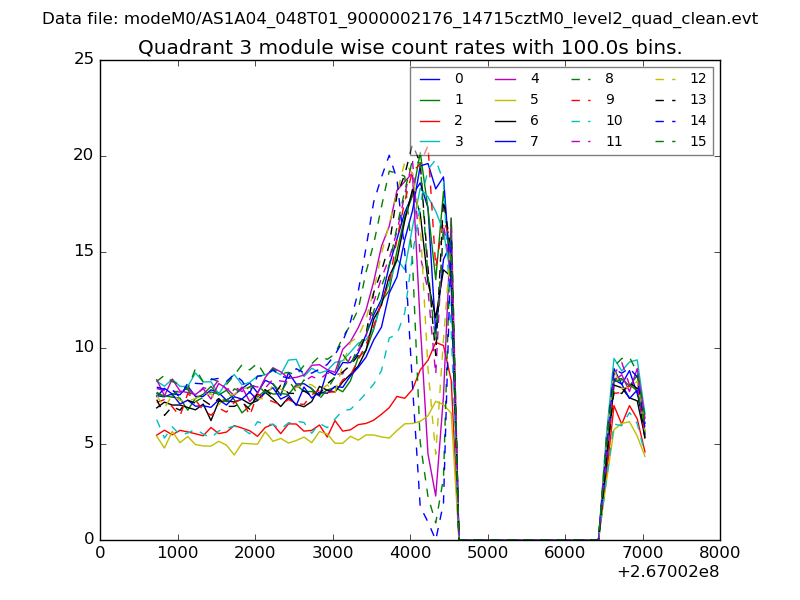 |
 |
| Parameter | Plot |
|---|---|
| CZT HV Monitor | 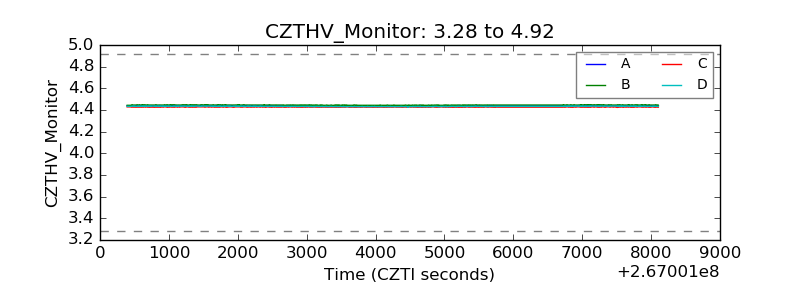 |
| D_VDD | 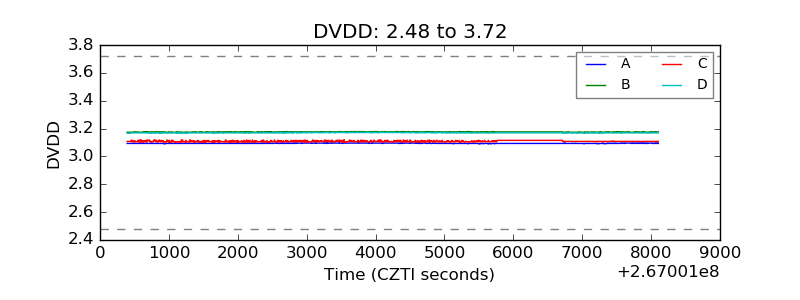 |
| Temperature 1 | 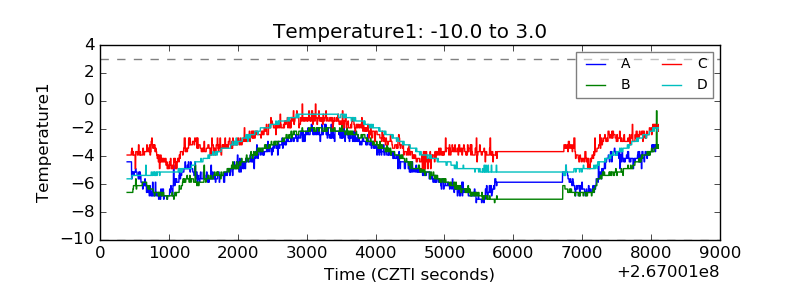 |
| Veto HV Monitor | 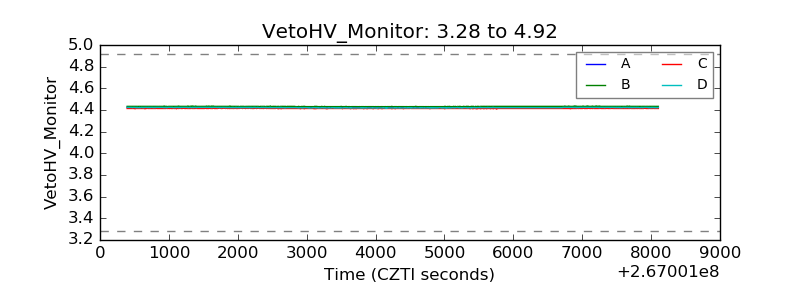 |
| Veto LLD | 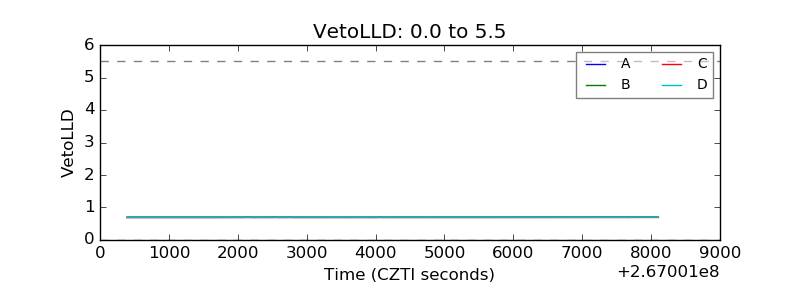 |
| Alpha Counter | 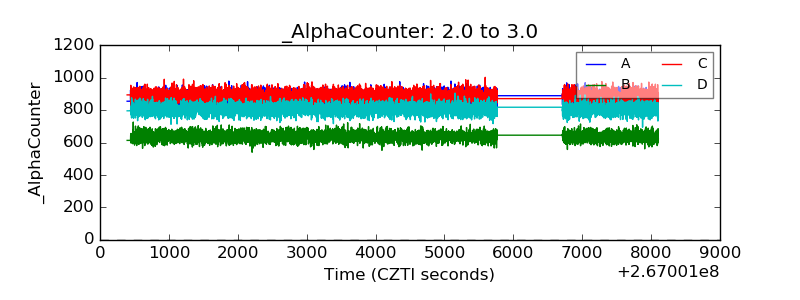 |
| _CPM_Rate | 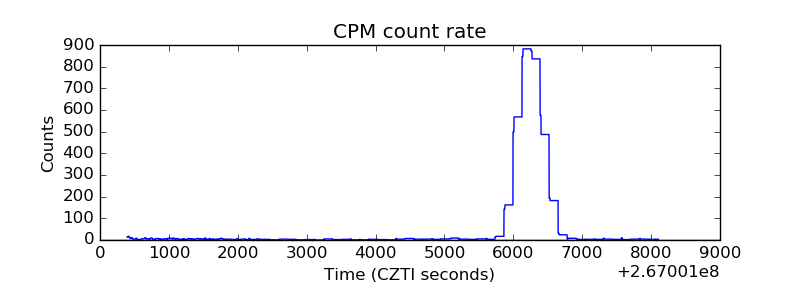 |
| CZT Counter | 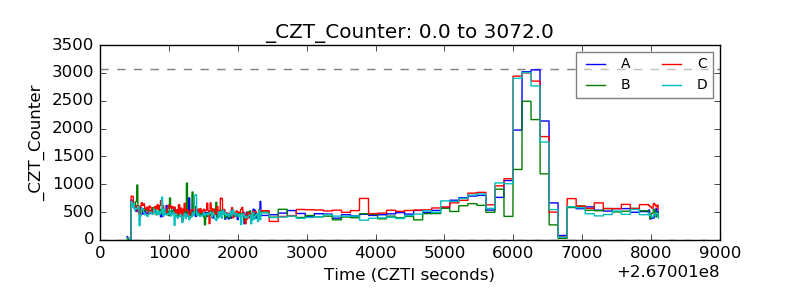 |
| +2.5 Volts monitor |  |
| +5 Volts monitor |  |
| _ROLL_ROT | 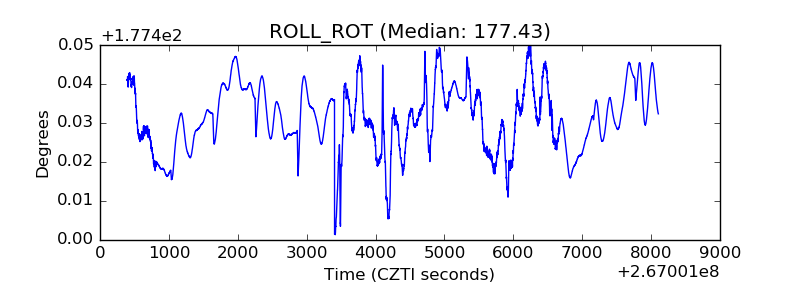 |
| _Roll_DEC | 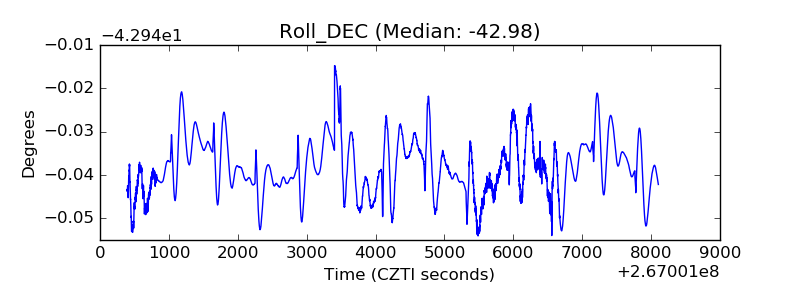 |
| _Roll_RA | 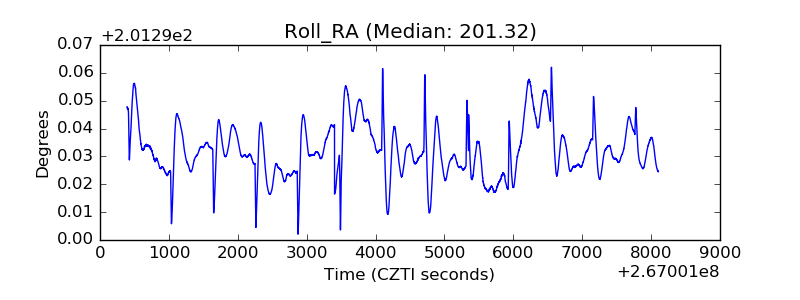 |
| Veto Counter | 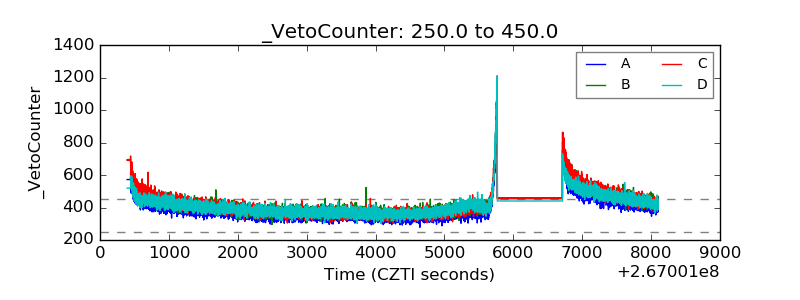 |