| Param | Original file | Final file |
|---|---|---|
| Filename | modeM0/AS1A04_048T01_9000002176_14716cztM0_level2.evt | modeM0/AS1A04_048T01_9000002176_14716cztM0_level2_quad_clean.evt |
| Size (bytes) | 469,615,680 | 98,850,240 |
| Size | 447.9 MB | 94.3 MB |
| Events in quadrant A | 3,381,429 | 643,698 |
| Events in quadrant B | 3,294,265 | 641,828 |
| Events in quadrant C | 3,946,883 | 630,764 |
| Events in quadrant D | 3,158,970 | 624,718 |
| Mode M9 | |||
|---|---|---|---|
| Quadrant | BADHDUFLAG | Total packets | Discarded packets |
| A | 0 | 21 | 0 |
| B | 0 | 21 | 0 |
| C | 0 | 21 | 0 |
| D | 0 | 21 | 0 |
| Mode M0 | |||
|---|---|---|---|
| Quadrant | BADHDUFLAG | Total packets | Discarded packets |
| A | 0 | 14122 | 3 |
| B | 0 | 13878 | 2 |
| C | 0 | 16377 | 2 |
| D | 0 | 13662 | 2 |
| Mode SS | |||
|---|---|---|---|
| Quadrant | BADHDUFLAG | Total packets | Discarded packets |
| A | 0 | 130 | 0 |
| B | 0 | 130 | 0 |
| C | 0 | 130 | 0 |
| D | 0 | 130 | 0 |
| Quadrant | Total seconds | Saturated seconds | Saturation percentage |
|---|---|---|---|
| A | 6496 | 146 | 2.247537% |
| B | 6496 | 118 | 1.816502% |
| C | 6496 | 108 | 1.662562% |
| D | 6496 | 96 | 1.477833% |
Noise dominated data is calculated using 1-second bins in cleaned event files. If a bin has >2000 counts, and if more than 50% of those come from <1% of pixels, then it is considered to be noise-dominated and hence unusable.
| Quadrant | # 1 sec bins | Bins with >0 counts | Bins with >2000 counts | High rate bins dominated by noise | Noise dominated (total time) | Noise dominated (detector-on time) | Marked lightcurve |
|---|---|---|---|---|---|---|---|
| A | 8567 | 6497 | 25 | 25 | 0.29% | 0.38% | 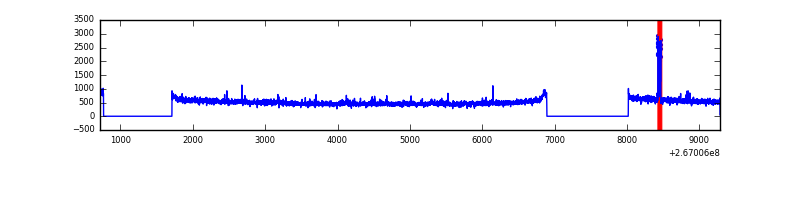 |
| B | 8567 | 6497 | 1 | 1 | 0.01% | 0.02% | 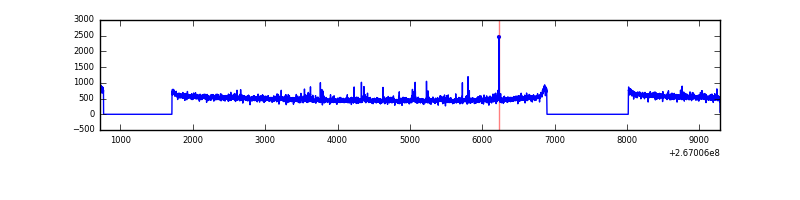 |
| C | 8567 | 6497 | 2 | 2 | 0.02% | 0.03% | 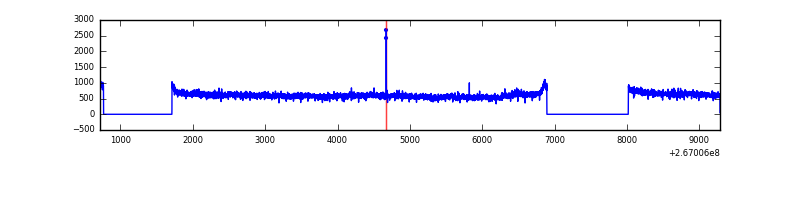 |
| D | 8567 | 6497 | 1 | 1 | 0.01% | 0.02% |  |
Top three noisy pixels from each quadrant. If the there are fewer than three noisy pixels in the level2.evt file, extra rows are filled as -1
| Pixel properties | Quadrant properties | ||||||
|---|---|---|---|---|---|---|---|
| Quadrant | DetID | PixID | Counts | Sigma | Mean | Median | Sigma |
| A | 9 | 143 | 80172 | 466.07 | 841 | 825 | 170.2 |
| A | 12 | 189 | 43288 | 249.42 | 841 | 825 | 170.2 |
| A | 3 | 1 | 14733 | 81.69 | 841 | 825 | 170.2 |
| B | 0 | 205 | 25709 | 158.3 | 829 | 808 | 157.3 |
| B | 12 | 111 | 17742 | 107.65 | 829 | 808 | 157.3 |
| B | 11 | 111 | 15333 | 92.34 | 829 | 808 | 157.3 |
| C | 3 | 233 | 770827 | 4140.99 | 809 | 815 | 185.9 |
| C | 3 | 234 | 12476 | 62.71 | 809 | 815 | 185.9 |
| C | 0 | 207 | 6928 | 32.87 | 809 | 815 | 185.9 |
| D | 2 | 234 | 23886 | 117.43 | 819 | 800 | 196.6 |
| D | 2 | 120 | 10711 | 50.41 | 819 | 800 | 196.6 |
| D | 2 | 14 | 8399 | 38.65 | 819 | 800 | 196.6 |
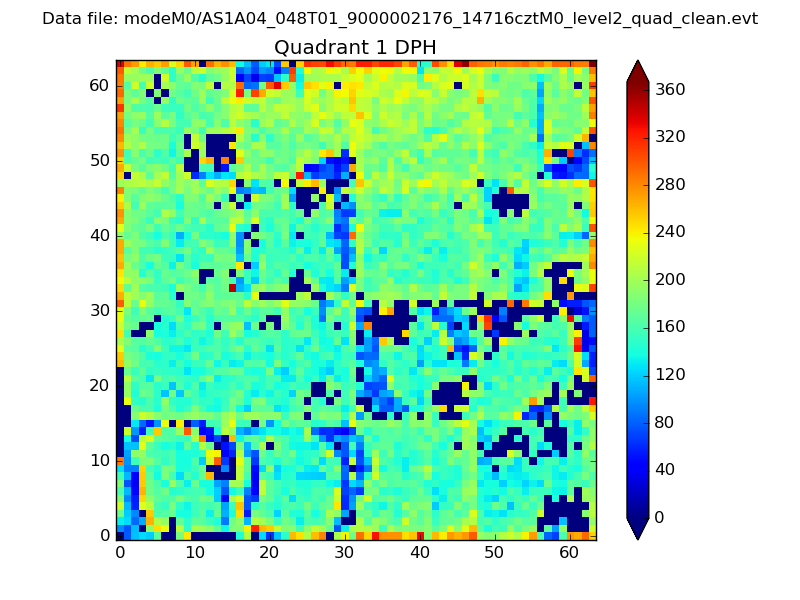
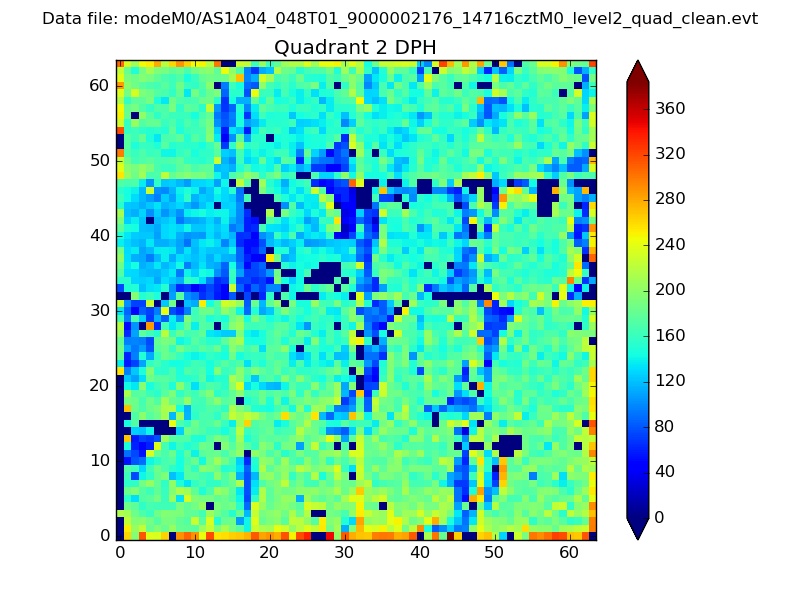
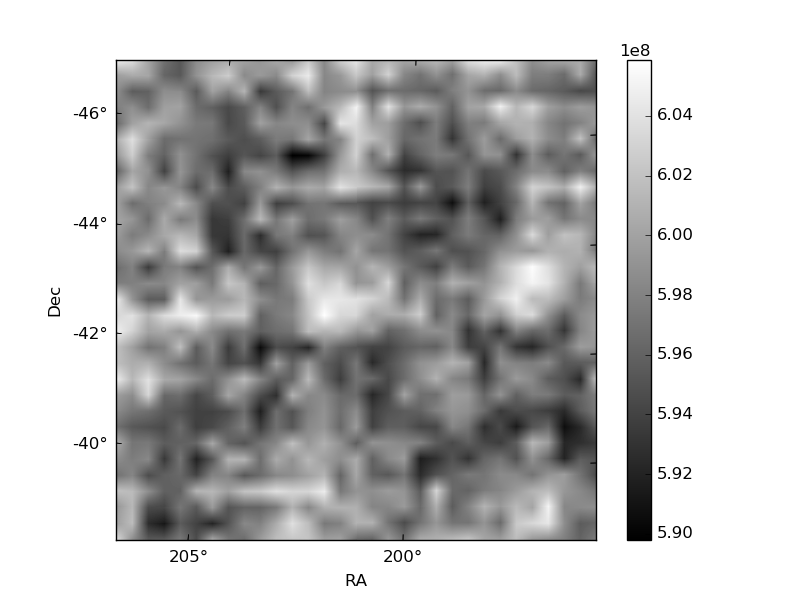
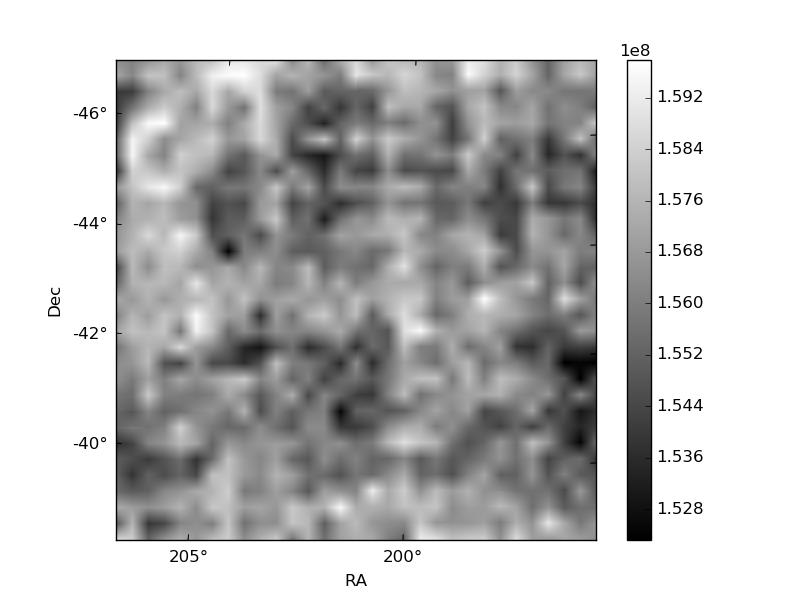
Histogram calculated using DETX and DETY for each event in the final _common_clean file
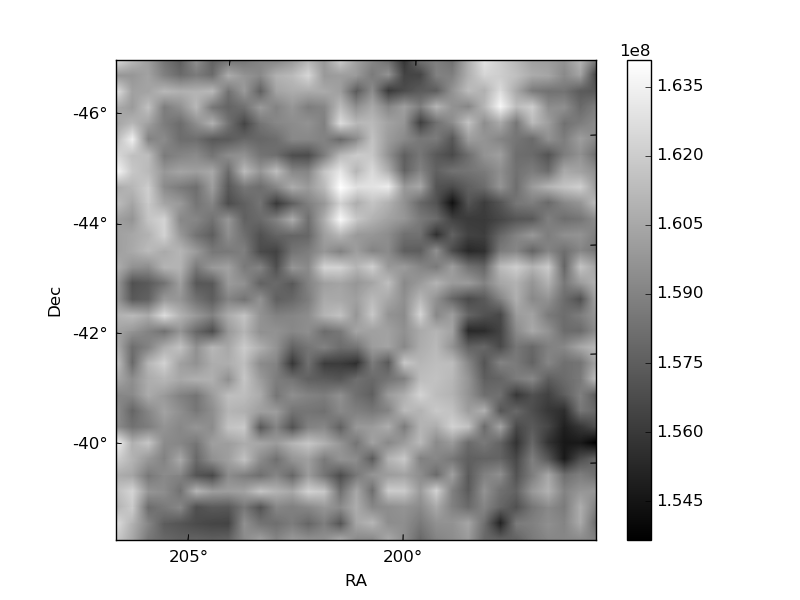
| Quadrant A | 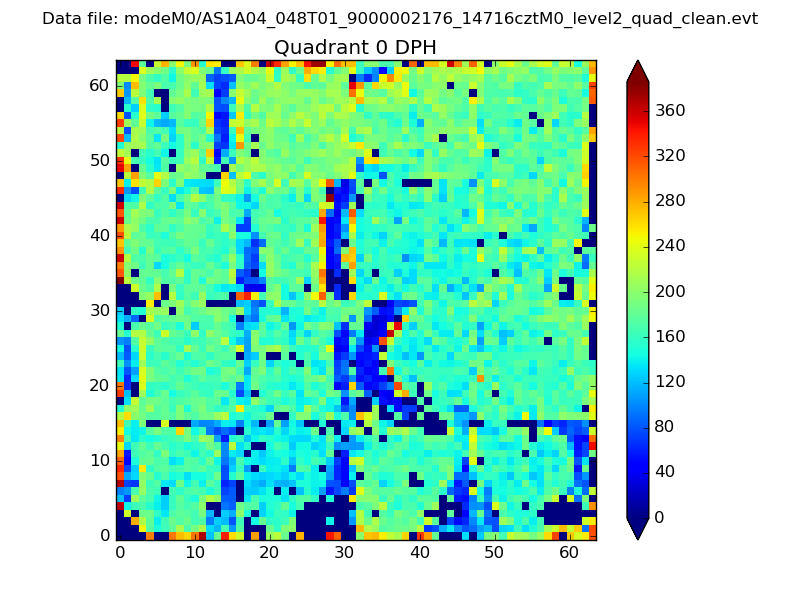 |
 |
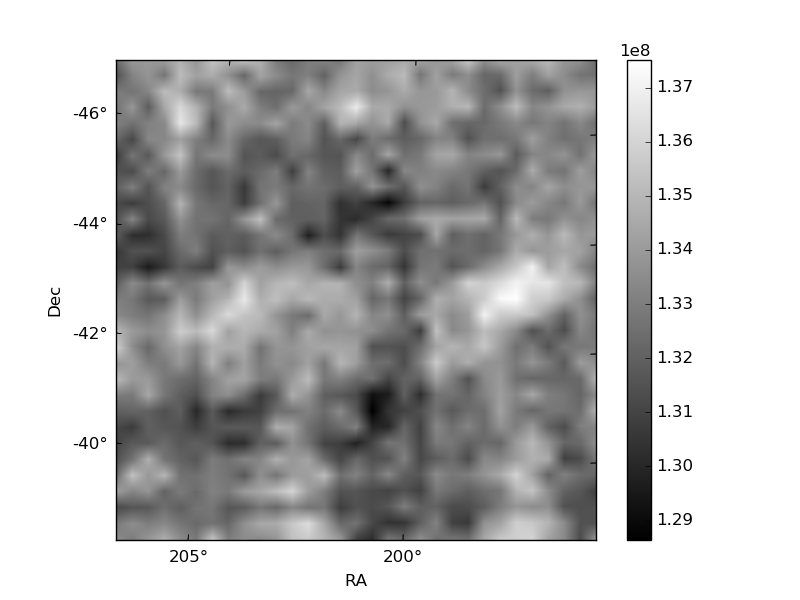
Quadrant B |
|---|---|---|---|
| Quadrant D | 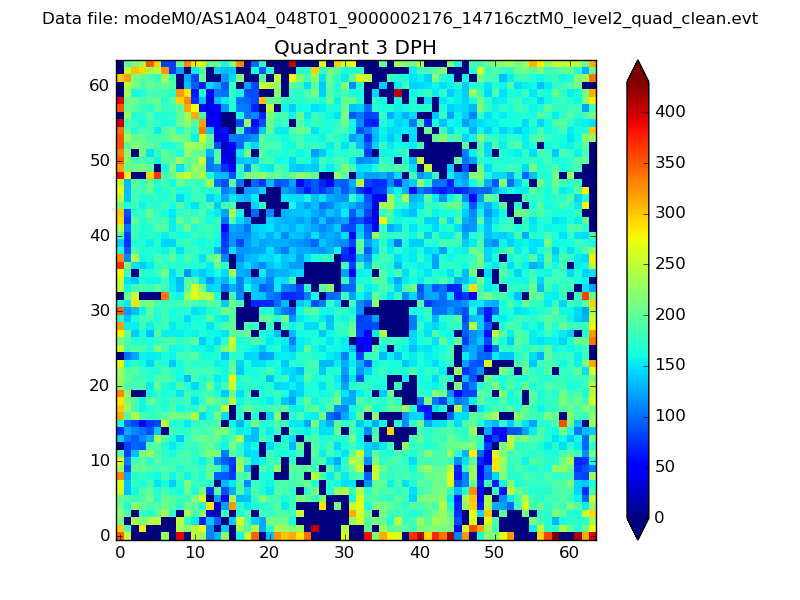 |
 |
Quadrant C |
| Plot type | Count rate plots | Images |
|---|---|---|
| Comparison with Poisson distribution Blue bars denote a histogram of data divided into 1 sec bins. Red curve is a Poisson curve with rate = median count rate of data. |
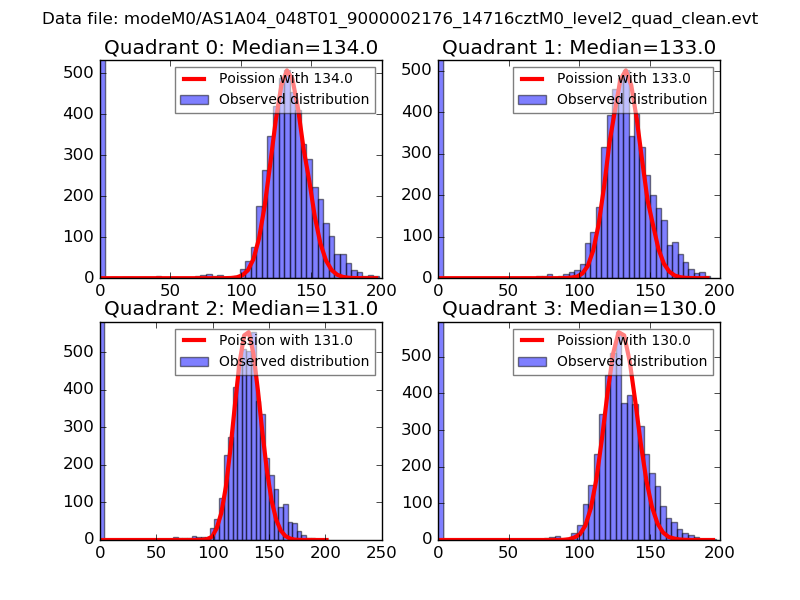 |
 |
| Quadrant-wise count rates Data is divided into 100 sec bins |
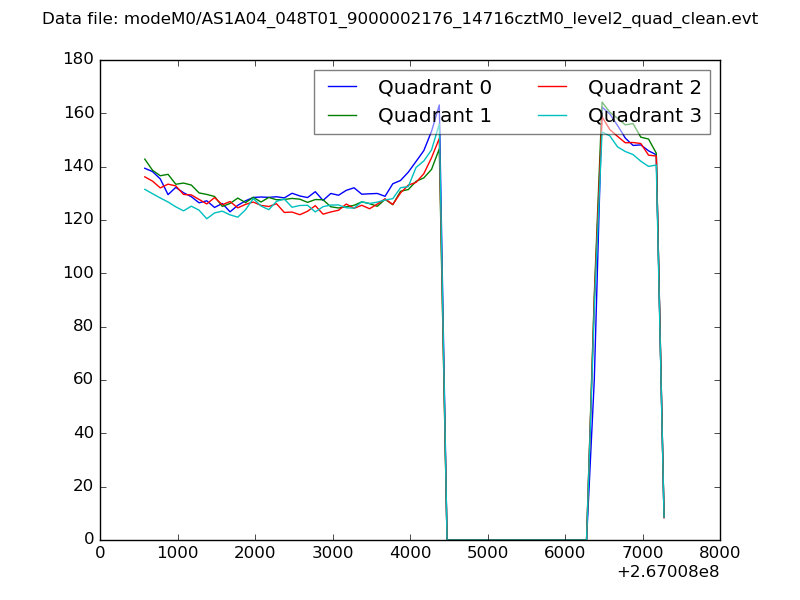 |
|
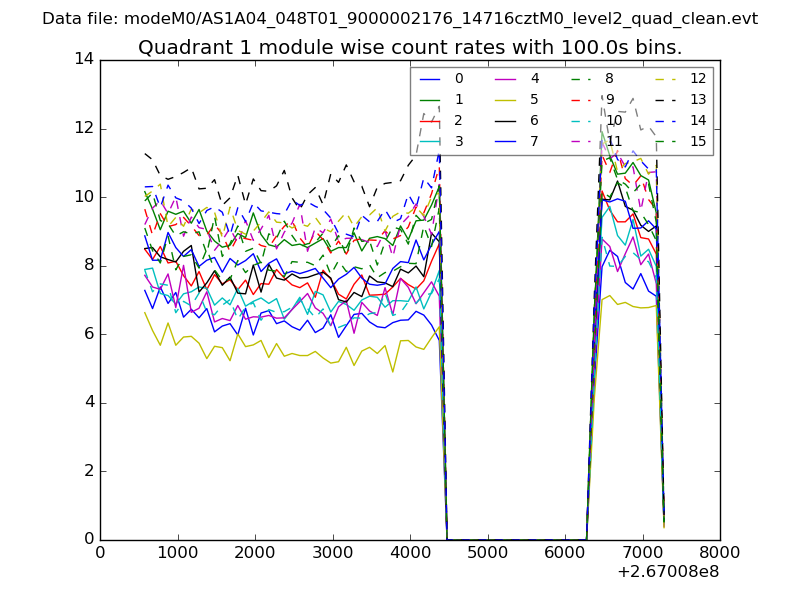
| Module-wise count rates for Quadrant A Data is divided into 100 sec bins |
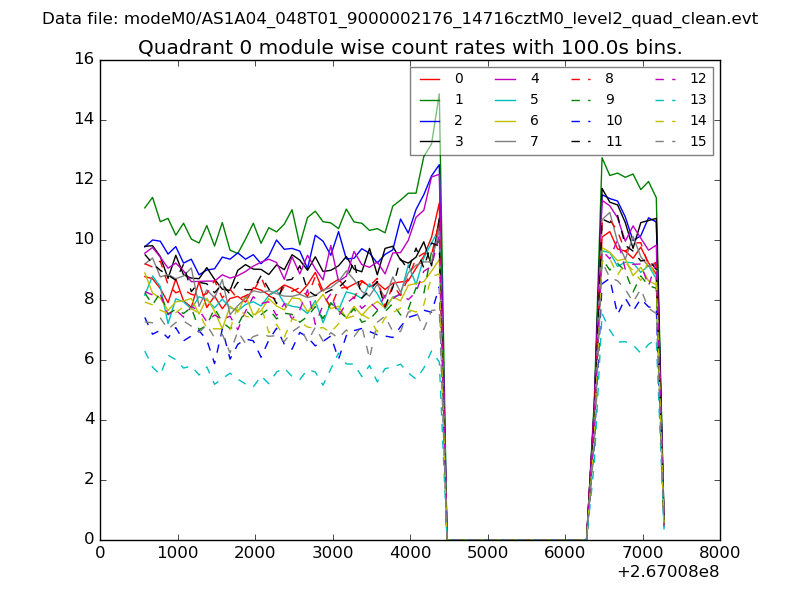 |
 |
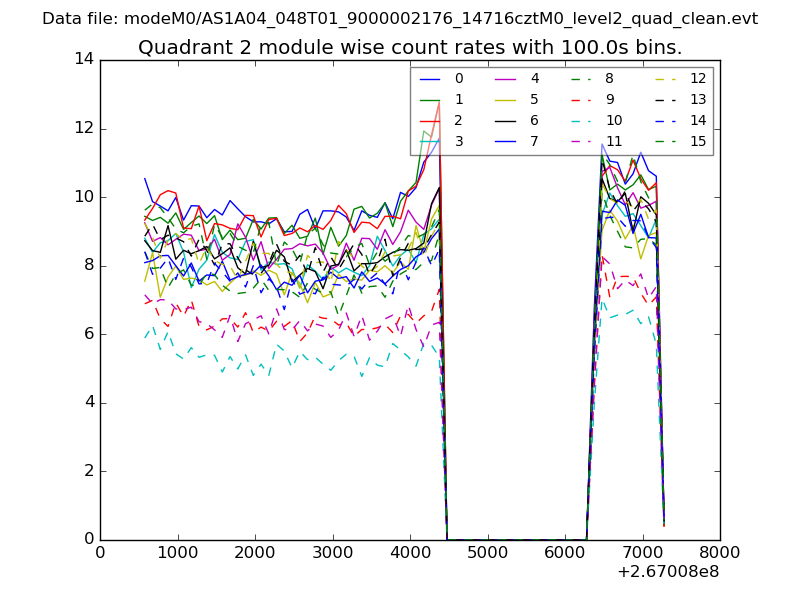
| Module-wise count rates for Quadrant B Data is divided into 100 sec bins |
 |
 |
| Module-wise count rates for Quadrant C Data is divided into 100 sec bins |
 |
 |
| Module-wise count rates for Quadrant D Data is divided into 100 sec bins |
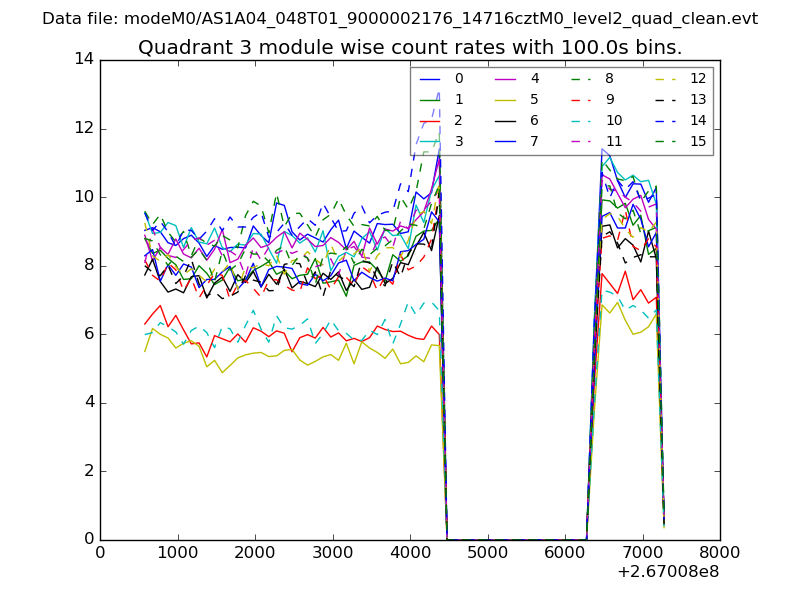 |
 |
| Parameter | Plot |
|---|---|
| CZT HV Monitor | 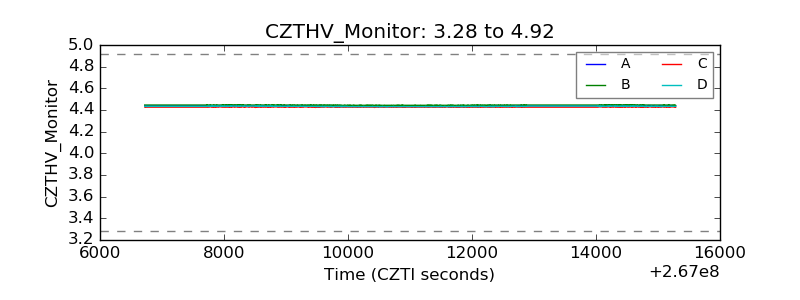 |
| D_VDD | 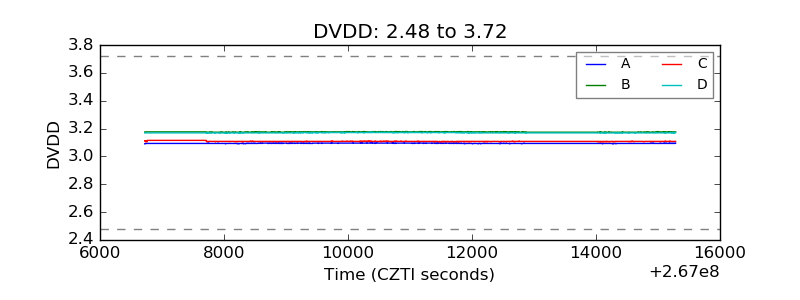 |
| Temperature 1 |  |
| Veto HV Monitor | 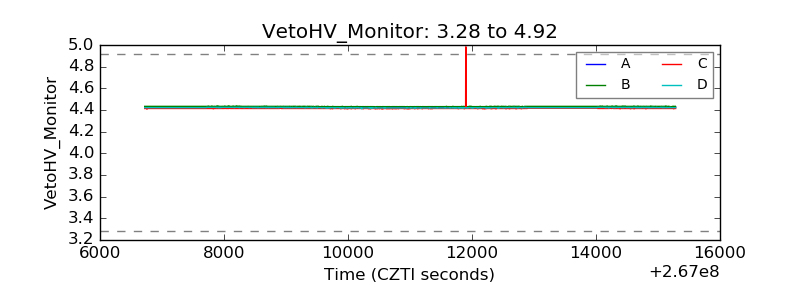 |
| Veto LLD |  |
| Alpha Counter | 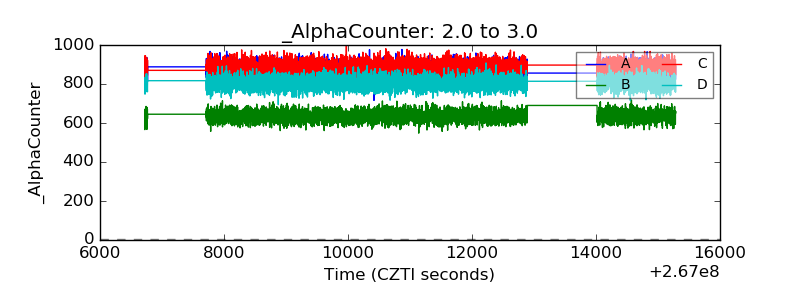 |
| _CPM_Rate | 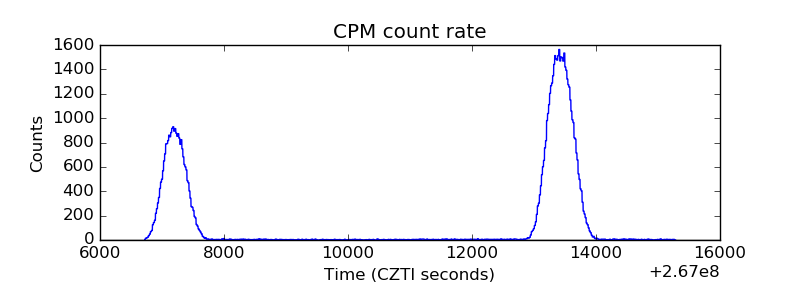 |
| CZT Counter | 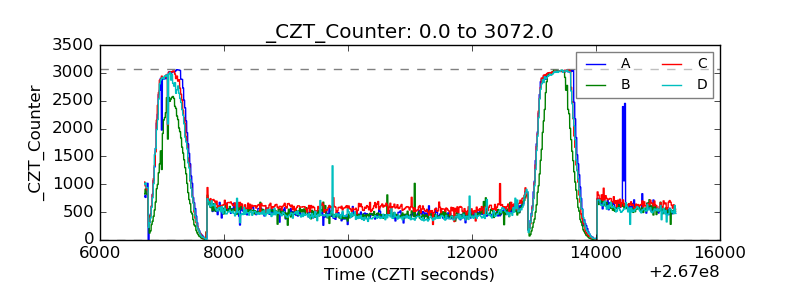 |
| +2.5 Volts monitor |  |
| +5 Volts monitor |  |
| _ROLL_ROT | 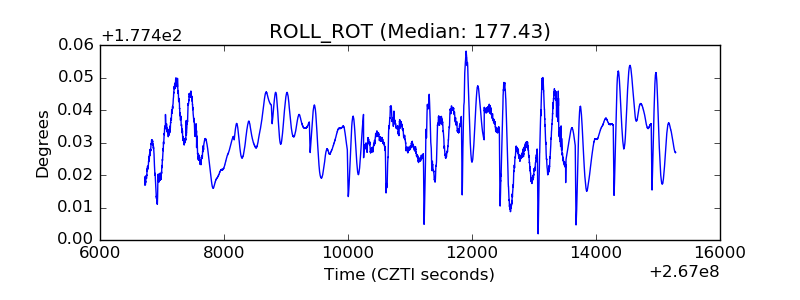 |
| _Roll_DEC | 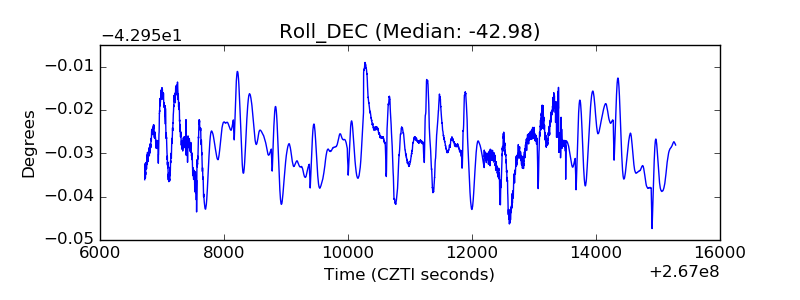 |
| _Roll_RA | 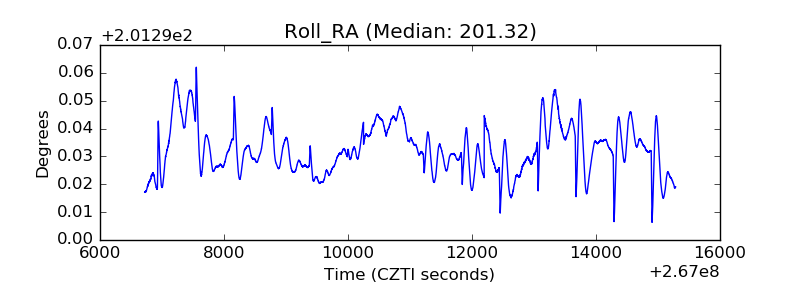 |
| Veto Counter | 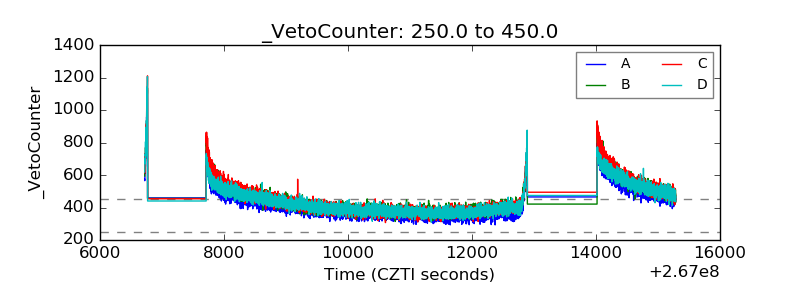 |