| Param | Original file | Final file |
|---|---|---|
| Filename | modeM0/AS1A04_048T01_9000002176_14718cztM0_level2.evt | modeM0/AS1A04_048T01_9000002176_14718cztM0_level2_quad_clean.evt |
| Size (bytes) | 467,087,040 | 112,731,840 |
| Size | 445.4 MB | 107.5 MB |
| Events in quadrant A | 3,349,390 | 755,459 |
| Events in quadrant B | 3,328,194 | 755,674 |
| Events in quadrant C | 3,826,119 | 733,521 |
| Events in quadrant D | 3,214,190 | 729,885 |
| Mode M9 | |||
|---|---|---|---|
| Quadrant | BADHDUFLAG | Total packets | Discarded packets |
| A | 0 | 21 | 0 |
| B | 0 | 21 | 0 |
| C | 0 | 21 | 0 |
| D | 0 | 22 | 0 |
| Mode M0 | |||
|---|---|---|---|
| Quadrant | BADHDUFLAG | Total packets | Discarded packets |
| A | 0 | 14044 | 3 |
| B | 0 | 13996 | 2 |
| C | 0 | 15788 | 2 |
| D | 0 | 13812 | 2 |
| Mode SS | |||
|---|---|---|---|
| Quadrant | BADHDUFLAG | Total packets | Discarded packets |
| A | 0 | 128 | 0 |
| B | 0 | 128 | 0 |
| C | 0 | 128 | 0 |
| D | 0 | 128 | 0 |
| Quadrant | Total seconds | Saturated seconds | Saturation percentage |
|---|---|---|---|
| A | 6303 | 105 | 1.665873% |
| B | 6303 | 74 | 1.174044% |
| C | 6303 | 59 | 0.936062% |
| D | 6303 | 73 | 1.158179% |
Noise dominated data is calculated using 1-second bins in cleaned event files. If a bin has >2000 counts, and if more than 50% of those come from <1% of pixels, then it is considered to be noise-dominated and hence unusable.
| Quadrant | # 1 sec bins | Bins with >0 counts | Bins with >2000 counts | High rate bins dominated by noise | Noise dominated (total time) | Noise dominated (detector-on time) | Marked lightcurve |
|---|---|---|---|---|---|---|---|
| A | 7494 | 6304 | 25 | 25 | 0.33% | 0.40% | 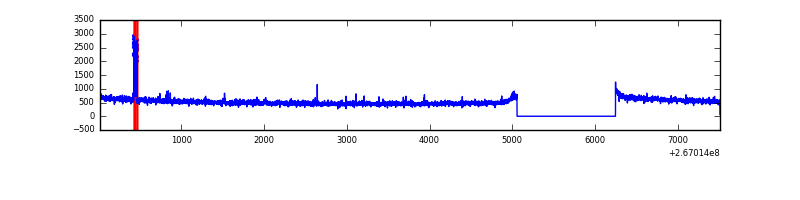 |
| B | 7494 | 6304 | 0 | 0 | 0.00% | 0.00% | 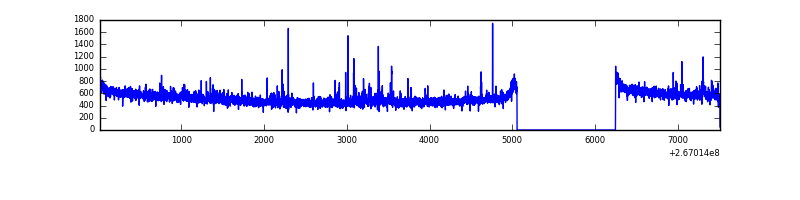 |
| C | 7494 | 6304 | 4 | 4 | 0.05% | 0.06% | 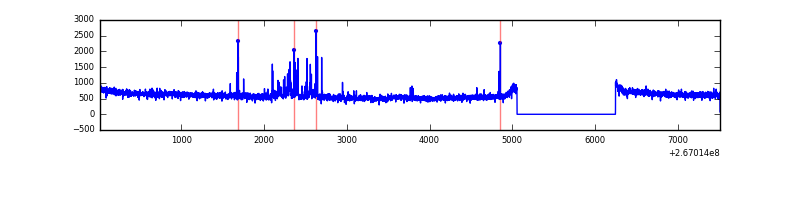 |
| D | 7494 | 6304 | 7 | 7 | 0.09% | 0.11% | 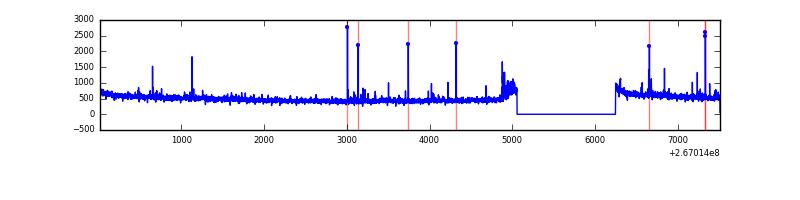 |
Top three noisy pixels from each quadrant. If the there are fewer than three noisy pixels in the level2.evt file, extra rows are filled as -1
| Pixel properties | Quadrant properties | ||||||
|---|---|---|---|---|---|---|---|
| Quadrant | DetID | PixID | Counts | Sigma | Mean | Median | Sigma |
| A | 9 | 143 | 71394 | 418.66 | 836 | 821 | 168.6 |
| A | 12 | 189 | 40436 | 235.01 | 836 | 821 | 168.6 |
| A | 3 | 1 | 15753 | 88.58 | 836 | 821 | 168.6 |
| B | 0 | 205 | 46454 | 294.63 | 825 | 809 | 154.9 |
| B | 12 | 111 | 17216 | 105.91 | 825 | 809 | 154.9 |
| B | 11 | 111 | 14770 | 90.12 | 825 | 809 | 154.9 |
| C | 3 | 233 | 589846 | 3214.69 | 798 | 802 | 183.2 |
| C | 0 | 207 | 114789 | 622.08 | 798 | 802 | 183.2 |
| C | 6 | 96 | 8278 | 40.8 | 798 | 802 | 183.2 |
| D | 10 | 199 | 53561 | 266.47 | 810 | 789 | 198.0 |
| D | 2 | 234 | 24314 | 118.79 | 810 | 789 | 198.0 |
| D | 10 | 70 | 22073 | 107.47 | 810 | 789 | 198.0 |
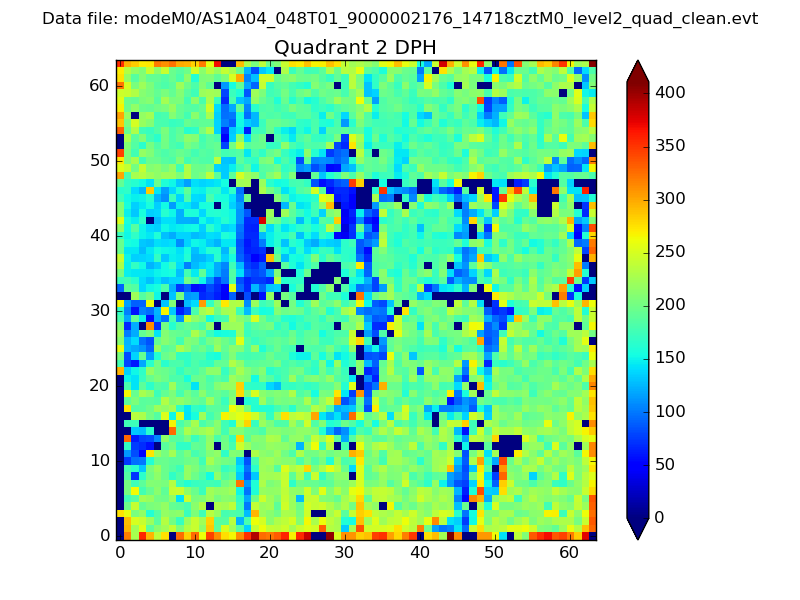
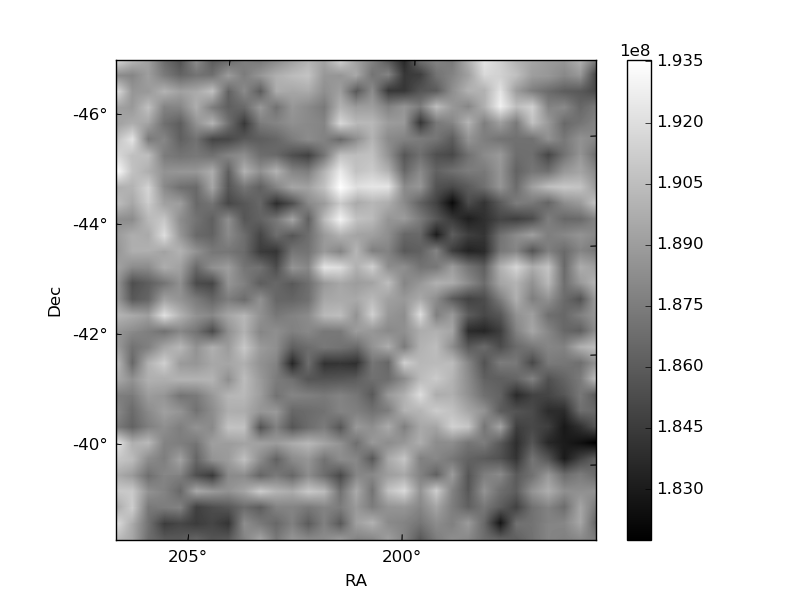
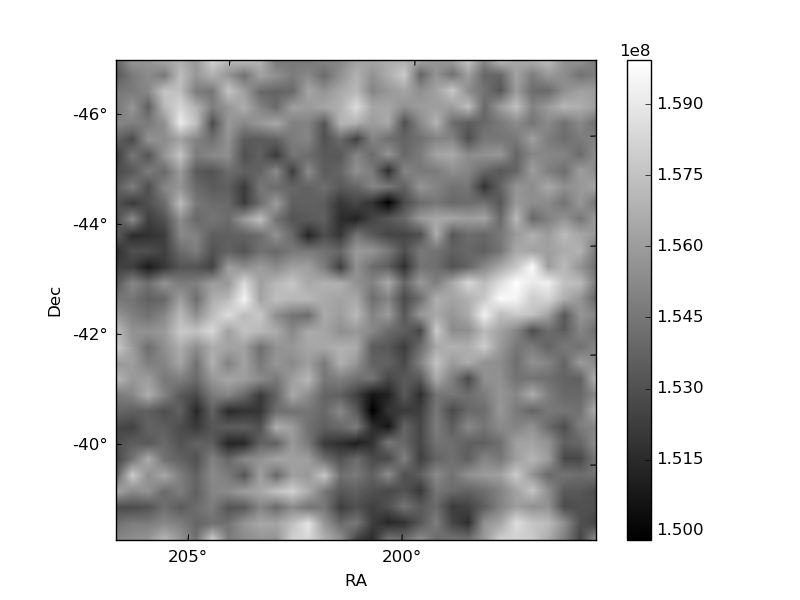
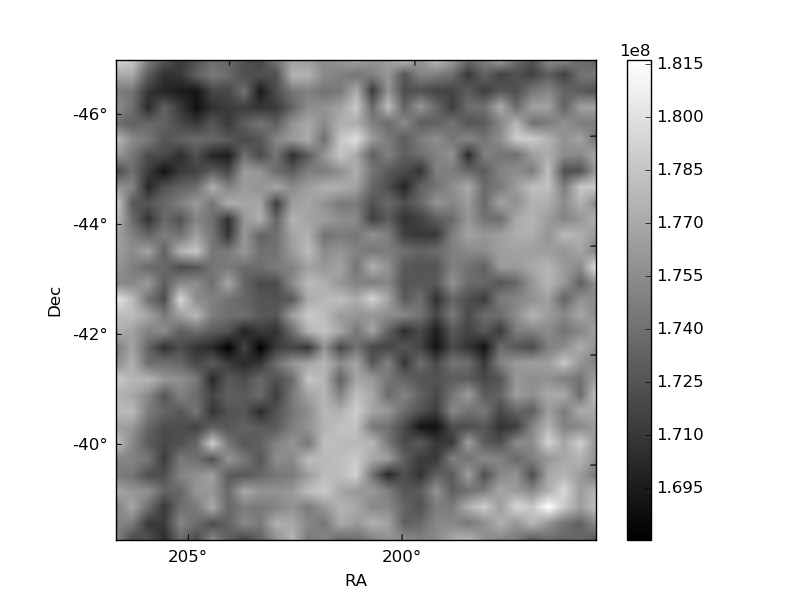
Histogram calculated using DETX and DETY for each event in the final _common_clean file
| Quadrant A |  |
 |
Quadrant B |
|---|---|---|---|
| Quadrant D | 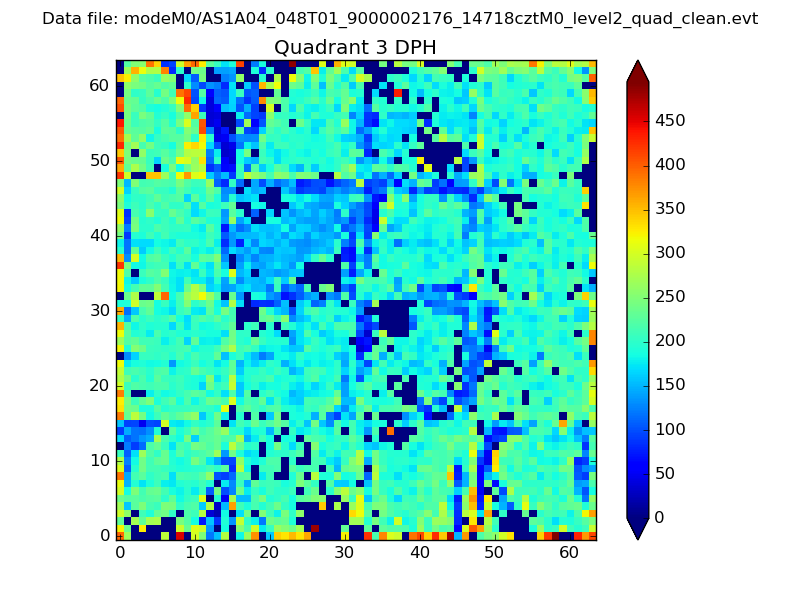 |
 |
Quadrant C |
| Plot type | Count rate plots | Images |
|---|---|---|
| Comparison with Poisson distribution Blue bars denote a histogram of data divided into 1 sec bins. Red curve is a Poisson curve with rate = median count rate of data. |
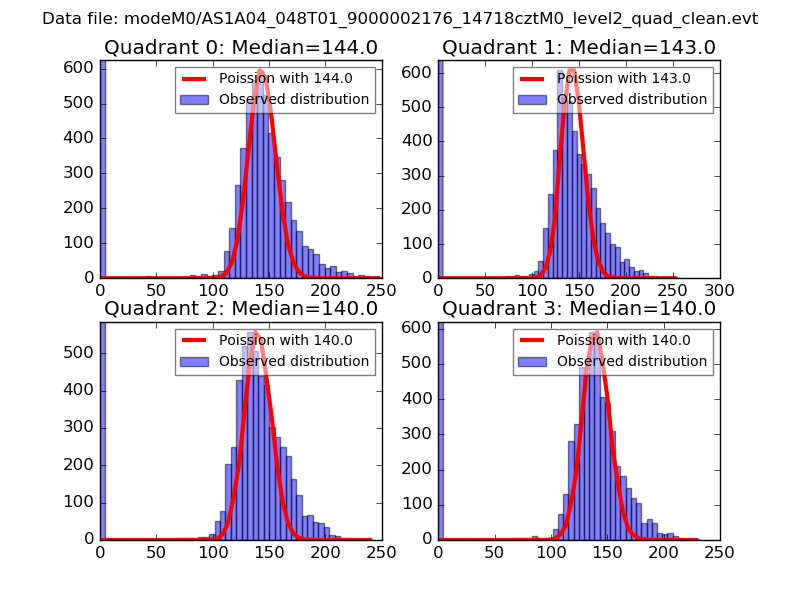 |
 |
| Quadrant-wise count rates Data is divided into 100 sec bins |
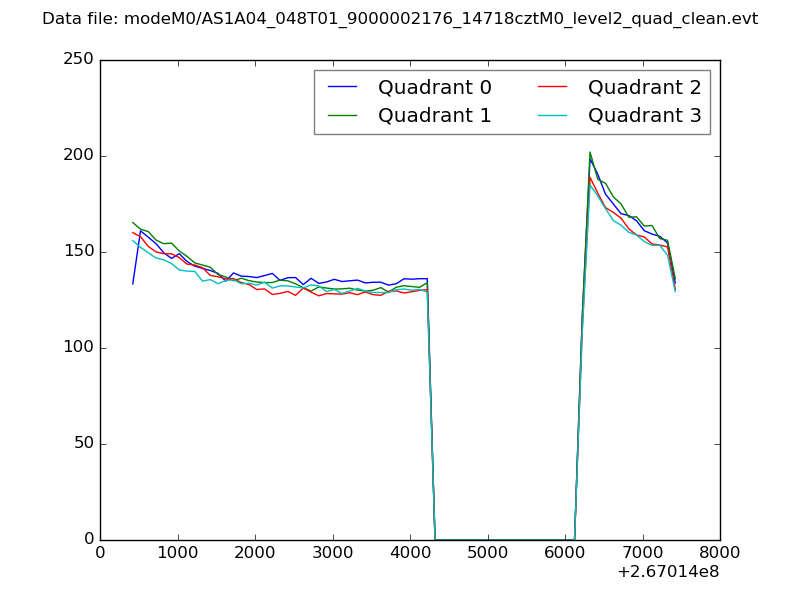 |
|
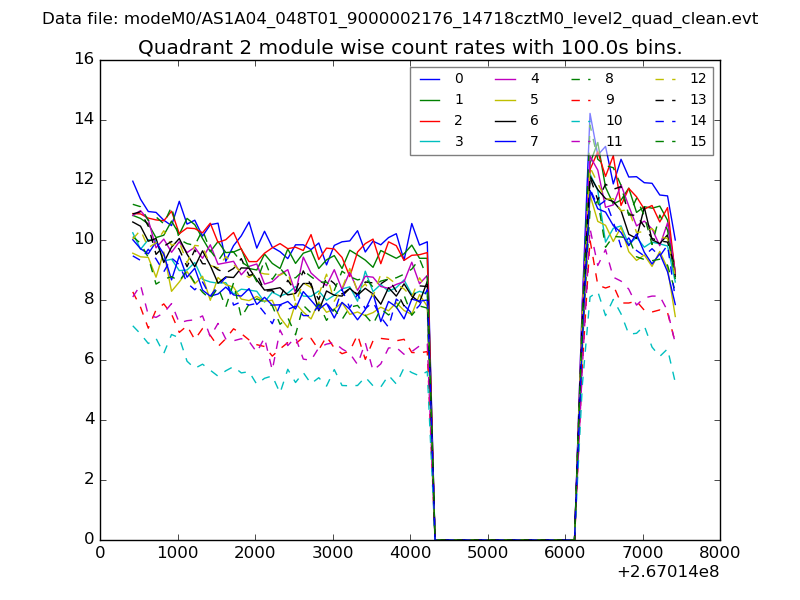
| Module-wise count rates for Quadrant A Data is divided into 100 sec bins |
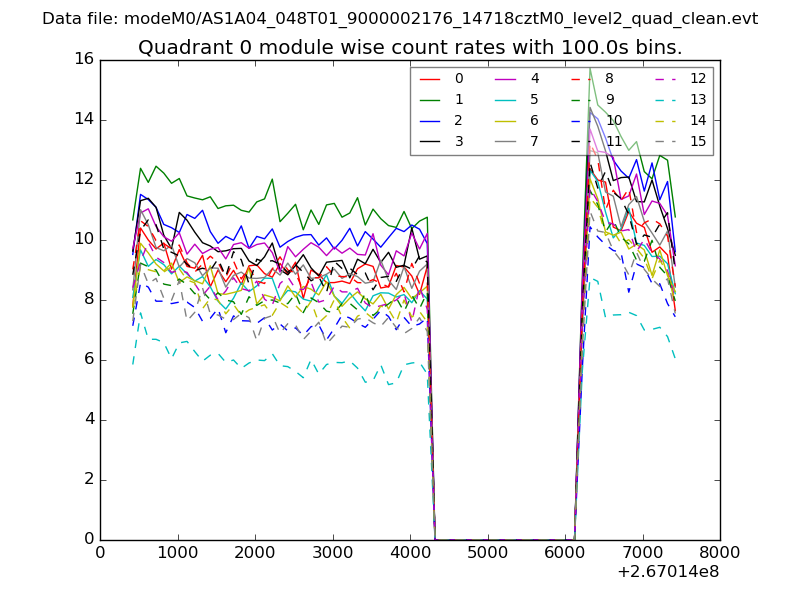 |
 |
| Module-wise count rates for Quadrant B Data is divided into 100 sec bins |
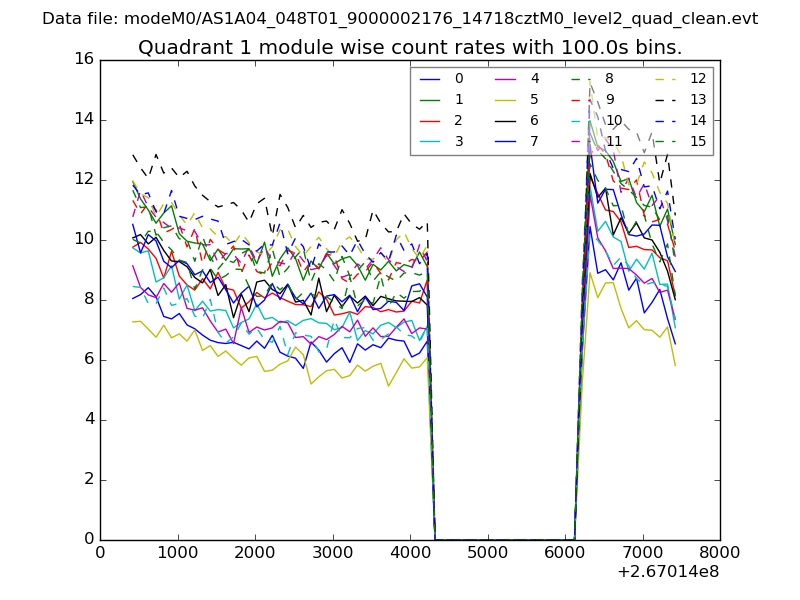 |
 |
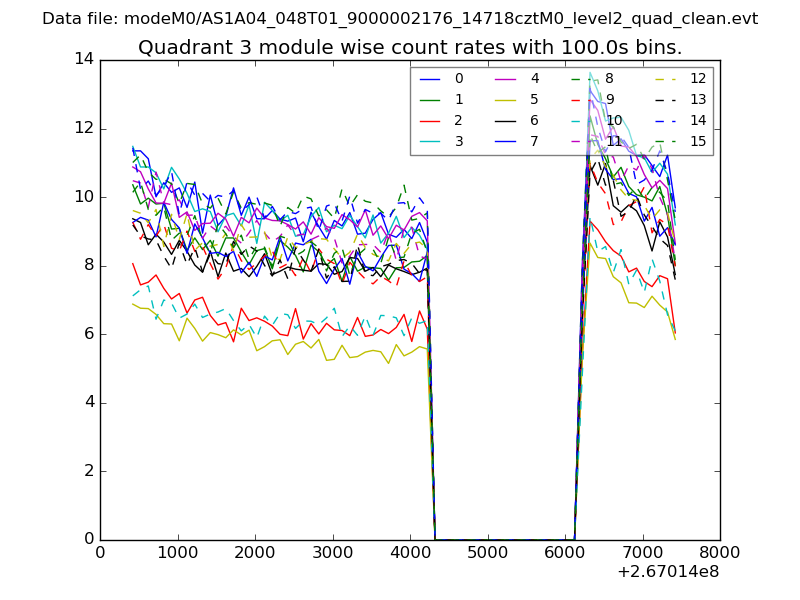
| Module-wise count rates for Quadrant C Data is divided into 100 sec bins |
 |
 |
| Module-wise count rates for Quadrant D Data is divided into 100 sec bins |
 |
 |
| Parameter | Plot |
|---|---|
| CZT HV Monitor | 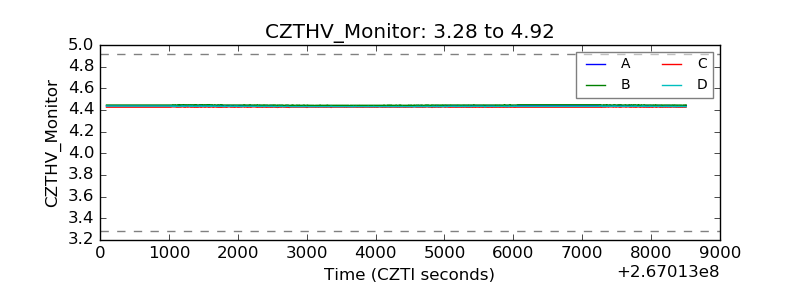 |
| D_VDD | 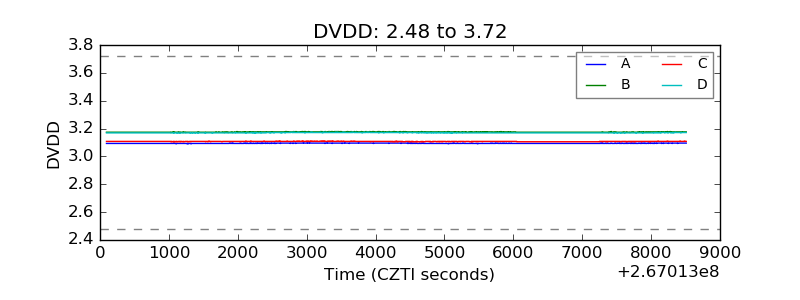 |
| Temperature 1 | 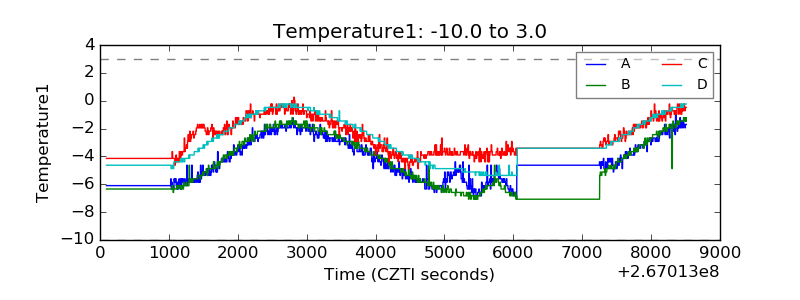 |
| Veto HV Monitor | 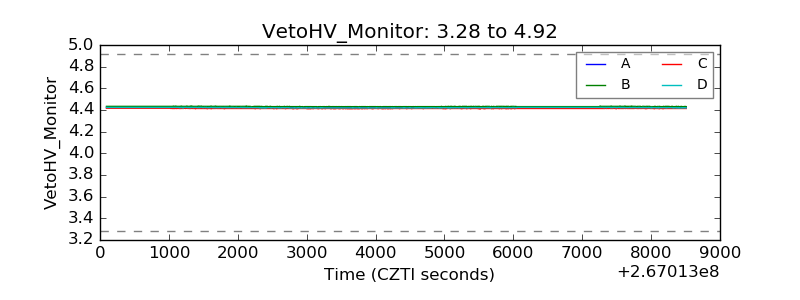 |
| Veto LLD | 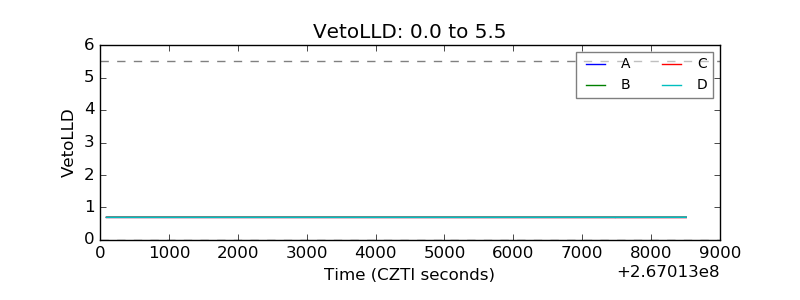 |
| Alpha Counter | 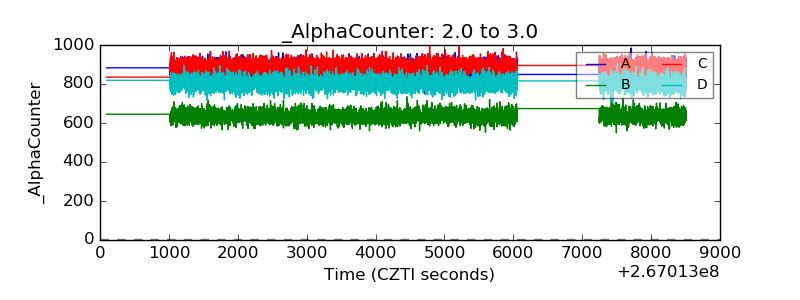 |
| _CPM_Rate | 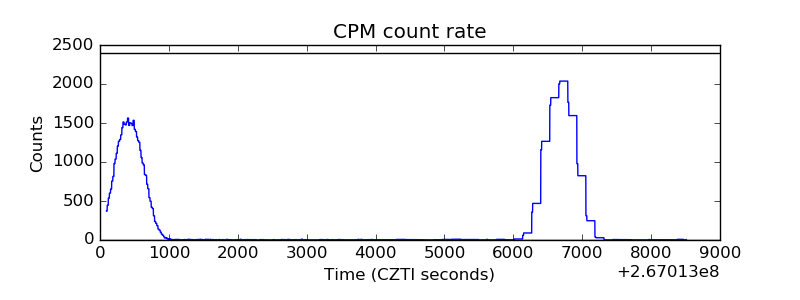 |
| CZT Counter | 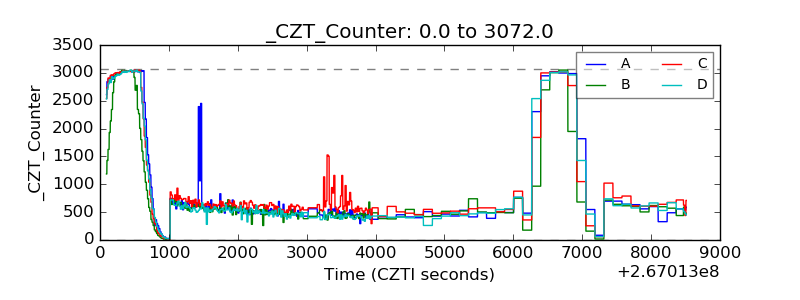 |
| +2.5 Volts monitor |  |
| +5 Volts monitor | 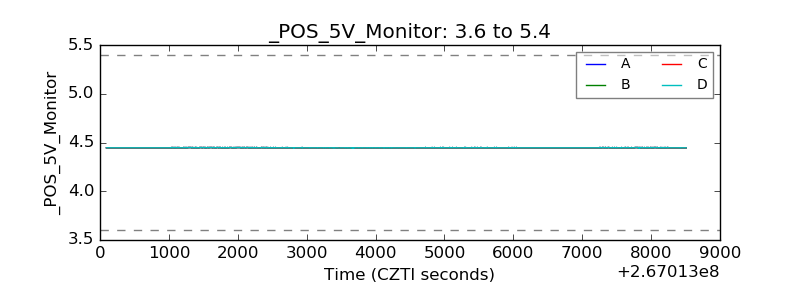 |
| _ROLL_ROT | 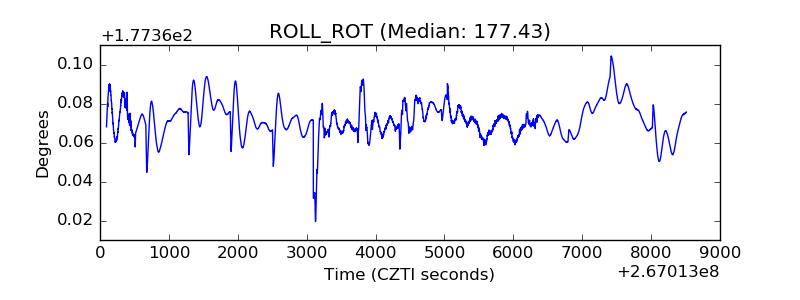 |
| _Roll_DEC | 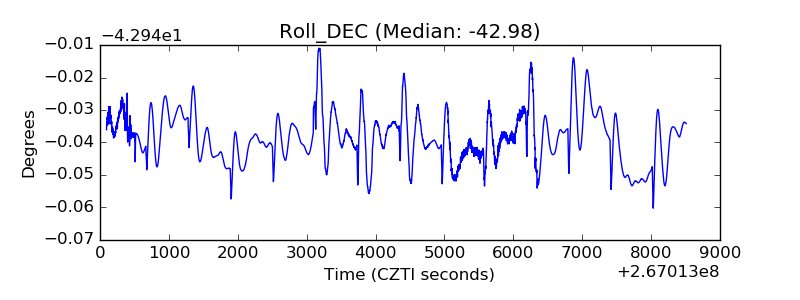 |
| _Roll_RA | 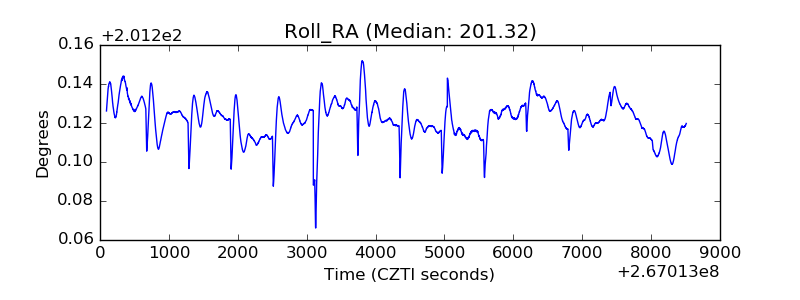 |
| Veto Counter | 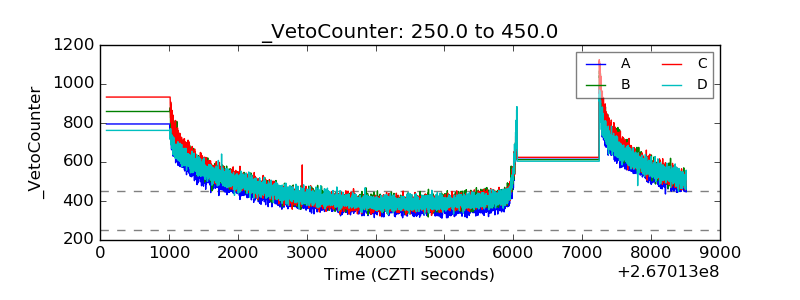 |