| Param | Original file | Final file |
|---|---|---|
| Filename | modeM0/AS1A04_048T01_9000002176_14721cztM0_level2.evt | modeM0/AS1A04_048T01_9000002176_14721cztM0_level2_quad_clean.evt |
| Size (bytes) | 501,635,520 | 102,015,360 |
| Size | 478.4 MB | 97.3 MB |
| Events in quadrant A | 3,372,698 | 687,027 |
| Events in quadrant B | 3,520,861 | 677,410 |
| Events in quadrant C | 3,948,718 | 646,869 |
| Events in quadrant D | 3,910,530 | 626,662 |
| Mode M9 | |||
|---|---|---|---|
| Quadrant | BADHDUFLAG | Total packets | Discarded packets |
| A | 0 | 15 | 0 |
| B | 0 | 15 | 0 |
| C | 0 | 15 | 0 |
| D | 0 | 16 | 0 |
| Mode M0 | |||
|---|---|---|---|
| Quadrant | BADHDUFLAG | Total packets | Discarded packets |
| A | 0 | 14125 | 3 |
| B | 0 | 14639 | 2 |
| C | 0 | 16026 | 2 |
| D | 0 | 16005 | 2 |
| Mode SS | |||
|---|---|---|---|
| Quadrant | BADHDUFLAG | Total packets | Discarded packets |
| A | 0 | 132 | 0 |
| B | 0 | 132 | 0 |
| C | 0 | 132 | 0 |
| D | 0 | 132 | 0 |
| Quadrant | Total seconds | Saturated seconds | Saturation percentage |
|---|---|---|---|
| A | 6471 | 80 | 1.236285% |
| B | 6471 | 110 | 1.699892% |
| C | 6471 | 60 | 0.927214% |
| D | 6471 | 315 | 4.867872% |
Noise dominated data is calculated using 1-second bins in cleaned event files. If a bin has >2000 counts, and if more than 50% of those come from <1% of pixels, then it is considered to be noise-dominated and hence unusable.
| Quadrant | # 1 sec bins | Bins with >0 counts | Bins with >2000 counts | High rate bins dominated by noise | Noise dominated (total time) | Noise dominated (detector-on time) | Marked lightcurve |
|---|---|---|---|---|---|---|---|
| A | 7777 | 6472 | 2 | 2 | 0.03% | 0.03% | 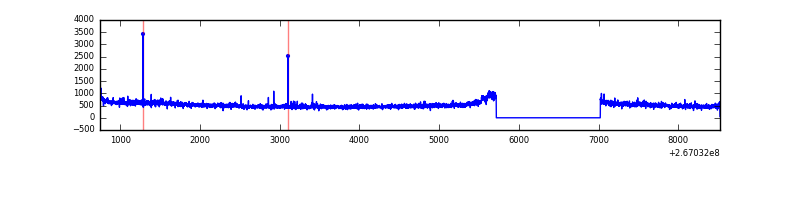 |
| B | 7777 | 6473 | 25 | 25 | 0.32% | 0.39% | 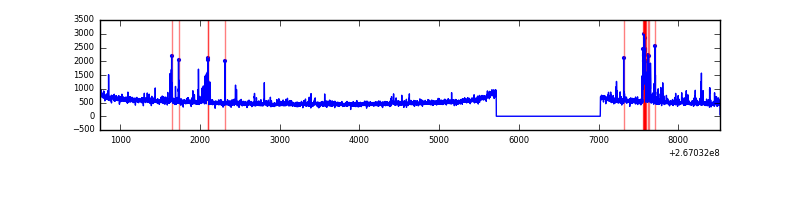 |
| C | 7777 | 6473 | 16 | 16 | 0.21% | 0.25% | 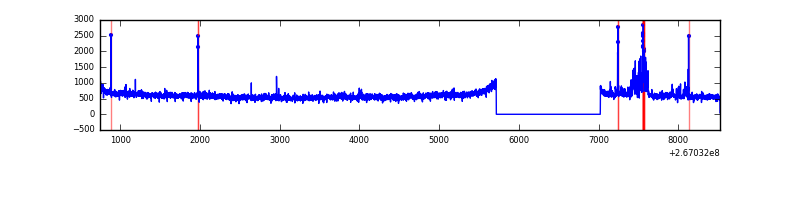 |
| D | 7776 | 6471 | 289 | 289 | 3.72% | 4.47% | 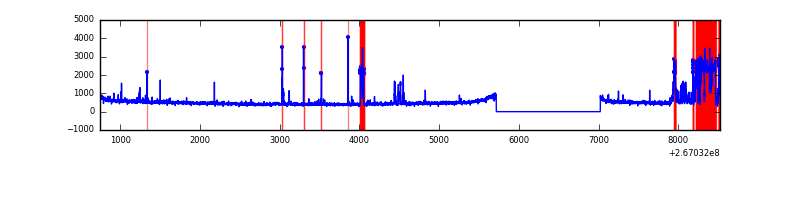 |
Top three noisy pixels from each quadrant. If the there are fewer than three noisy pixels in the level2.evt file, extra rows are filled as -1
| Pixel properties | Quadrant properties | ||||||
|---|---|---|---|---|---|---|---|
| Quadrant | DetID | PixID | Counts | Sigma | Mean | Median | Sigma |
| A | 8 | 15 | 73143 | 428.3 | 838 | 821 | 168.9 |
| A | 12 | 189 | 49483 | 288.18 | 838 | 821 | 168.9 |
| A | 3 | 1 | 9530 | 51.58 | 838 | 821 | 168.9 |
| B | 0 | 228 | 128302 | 815.27 | 824 | 805 | 156.4 |
| B | 4 | 142 | 73006 | 461.68 | 824 | 805 | 156.4 |
| B | 0 | 205 | 32037 | 199.71 | 824 | 805 | 156.4 |
| C | 3 | 233 | 725578 | 4043.71 | 783 | 788 | 179.2 |
| C | 0 | 207 | 152787 | 848.02 | 783 | 788 | 179.2 |
| C | 6 | 96 | 12296 | 64.2 | 783 | 788 | 179.2 |
| D | 15 | 0 | 690277 | 3725.55 | 780 | 762 | 185.1 |
| D | 13 | 61 | 69207 | 369.82 | 780 | 762 | 185.1 |
| D | 10 | 199 | 38629 | 204.6 | 780 | 762 | 185.1 |
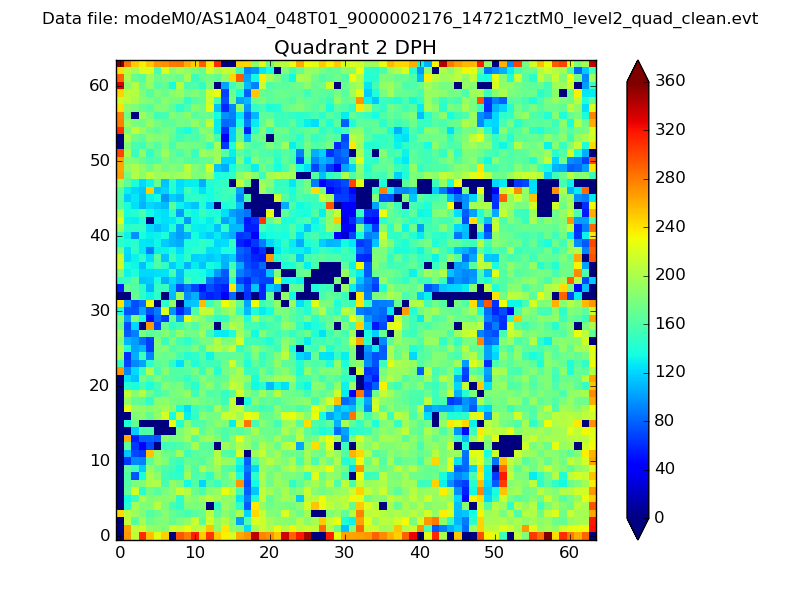
Histogram calculated using DETX and DETY for each event in the final _common_clean file
| Quadrant A | 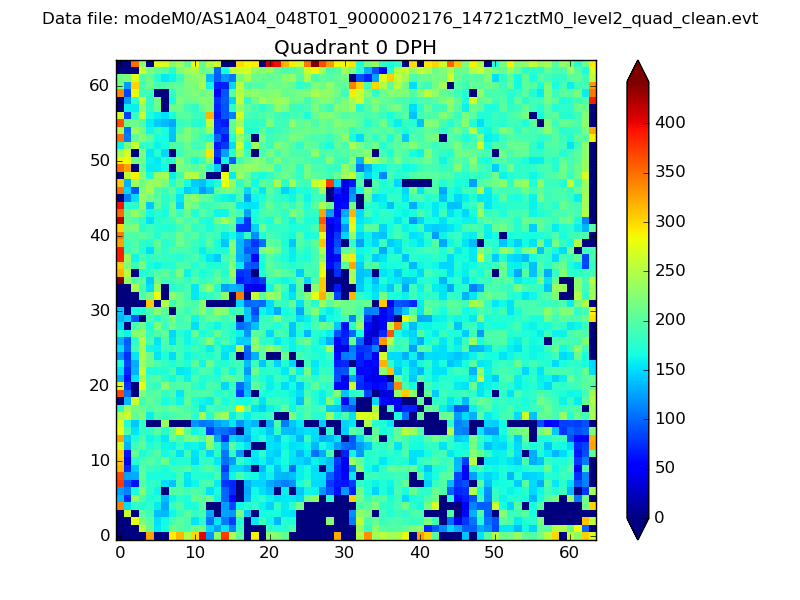 |
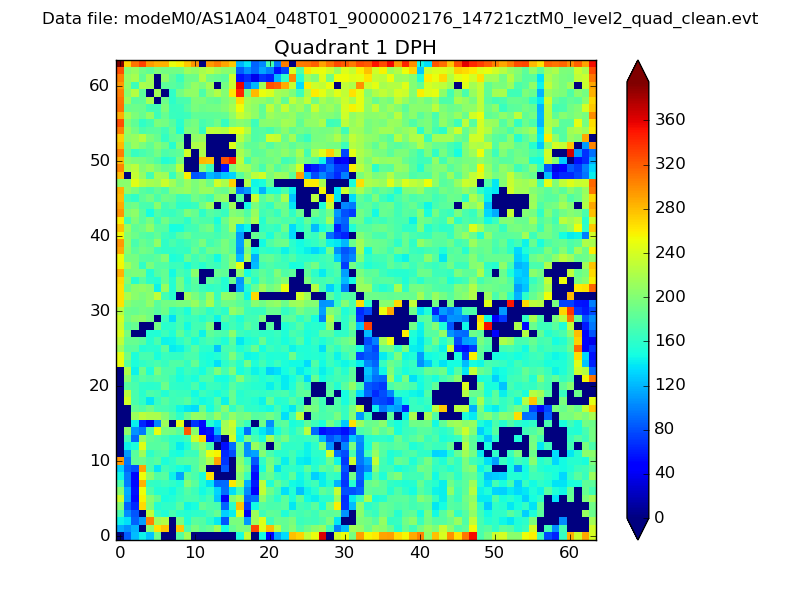 |
Quadrant B |
|---|---|---|---|
| Quadrant D | 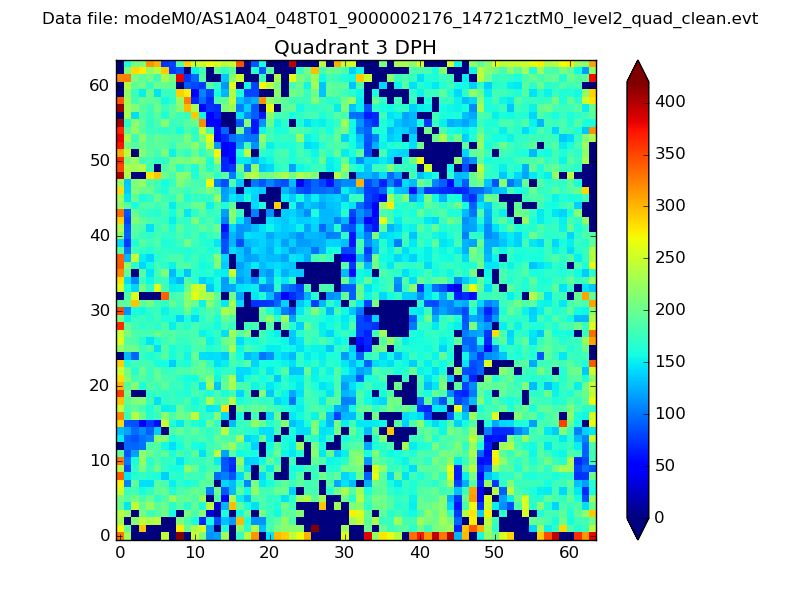 |
 |
Quadrant C |
| Plot type | Count rate plots | Images |
|---|---|---|
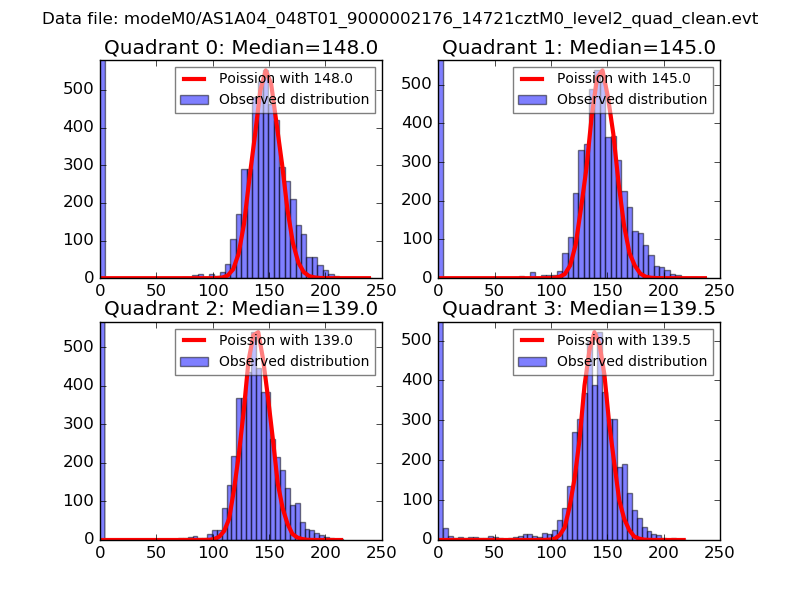
| Comparison with Poisson distribution Blue bars denote a histogram of data divided into 1 sec bins. Red curve is a Poisson curve with rate = median count rate of data. |
 |
 |
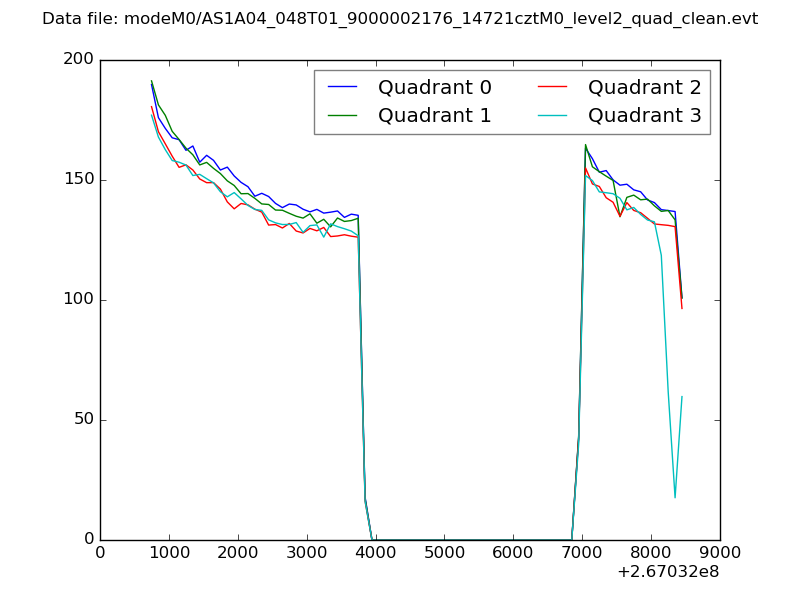
| Quadrant-wise count rates Data is divided into 100 sec bins |
 |
|
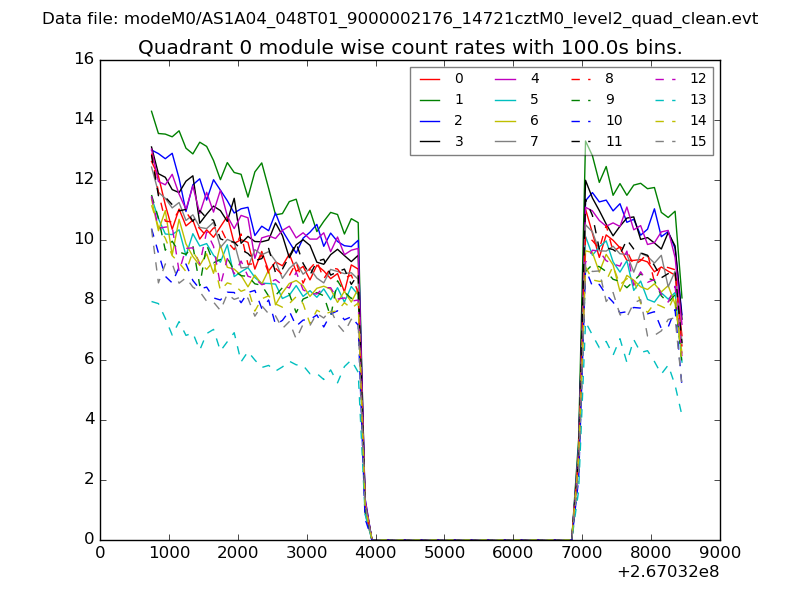
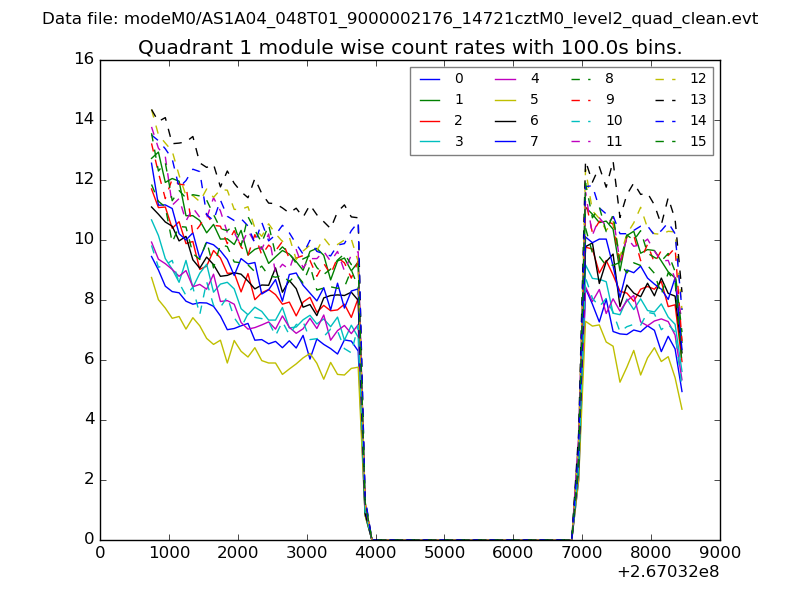
| Module-wise count rates for Quadrant A Data is divided into 100 sec bins |
 |
 |
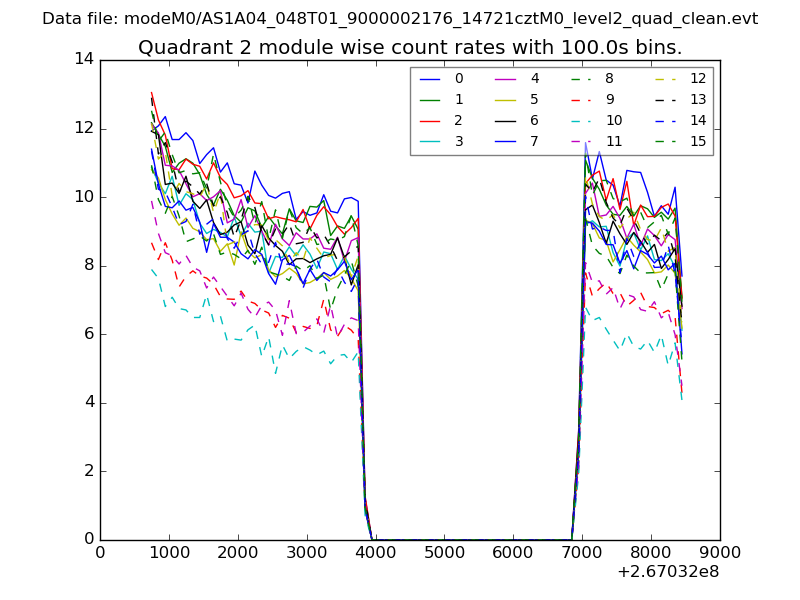
| Module-wise count rates for Quadrant B Data is divided into 100 sec bins |
 |
 |
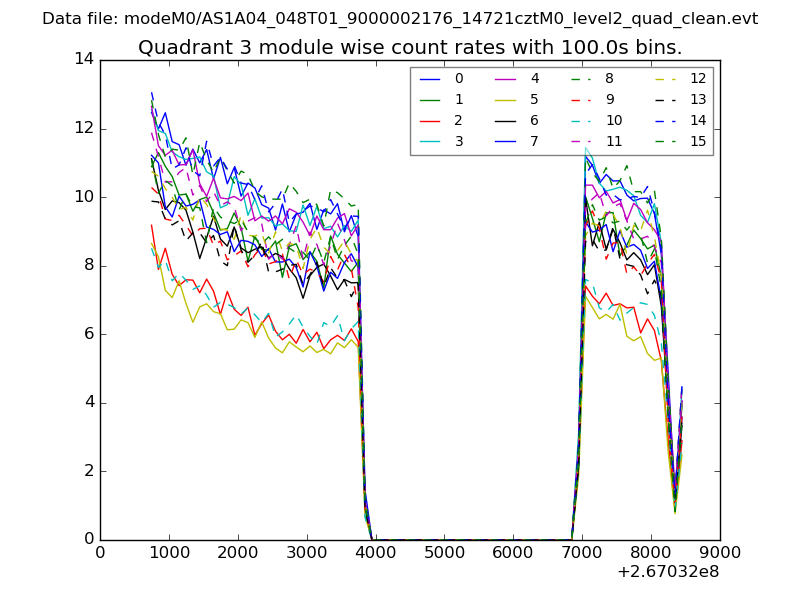
| Module-wise count rates for Quadrant C Data is divided into 100 sec bins |
 |
 |
| Module-wise count rates for Quadrant D Data is divided into 100 sec bins |
 |
 |
| Parameter | Plot |
|---|---|
| CZT HV Monitor | 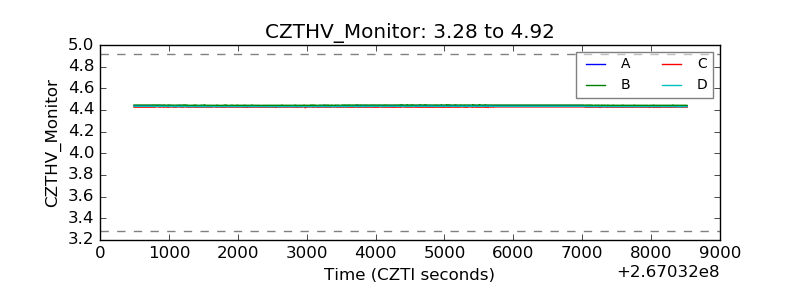 |
| D_VDD | 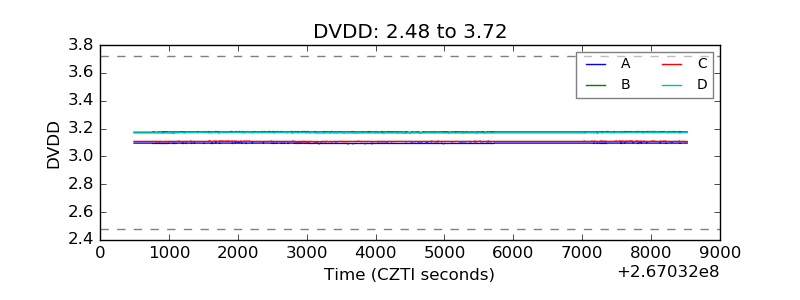 |
| Temperature 1 | 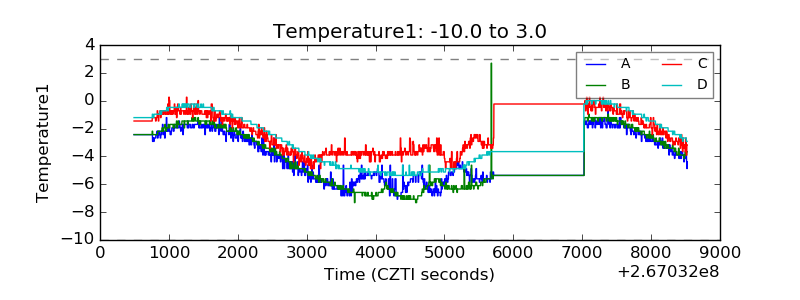 |
| Veto HV Monitor | 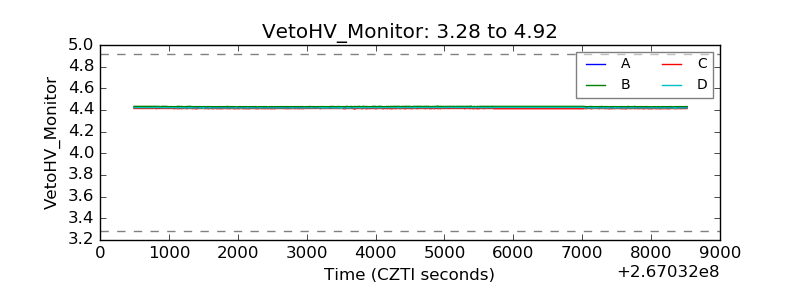 |
| Veto LLD | 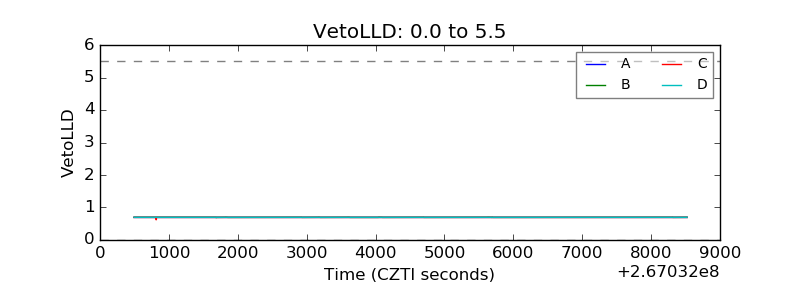 |
| Alpha Counter | 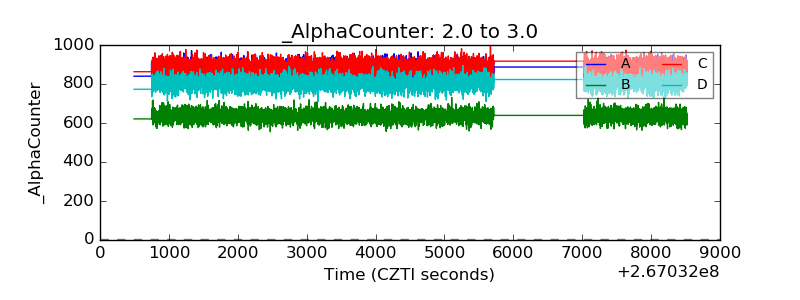 |
| _CPM_Rate | 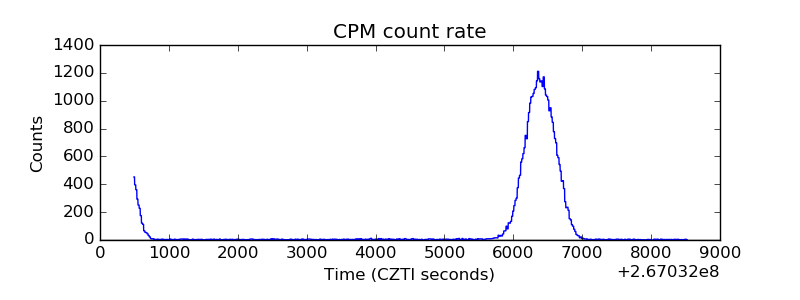 |
| CZT Counter | 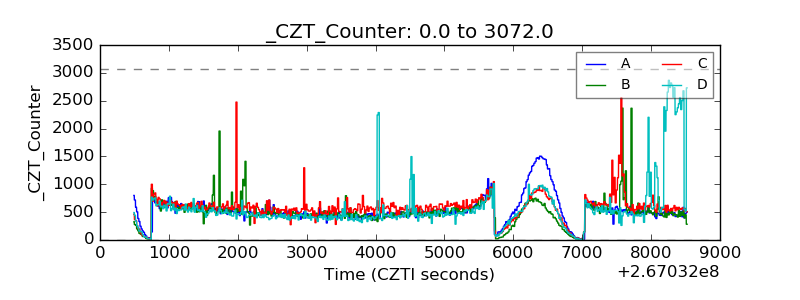 |
| +2.5 Volts monitor | 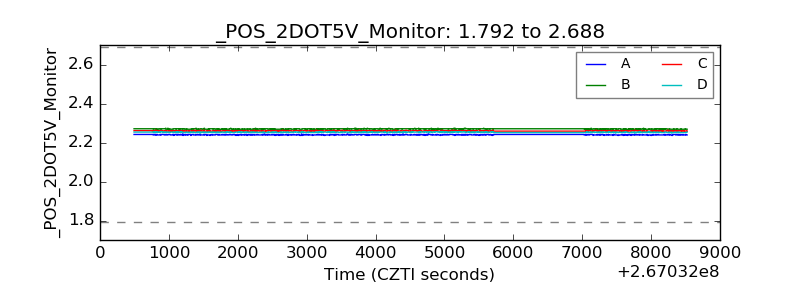 |
| +5 Volts monitor |  |
| _ROLL_ROT | 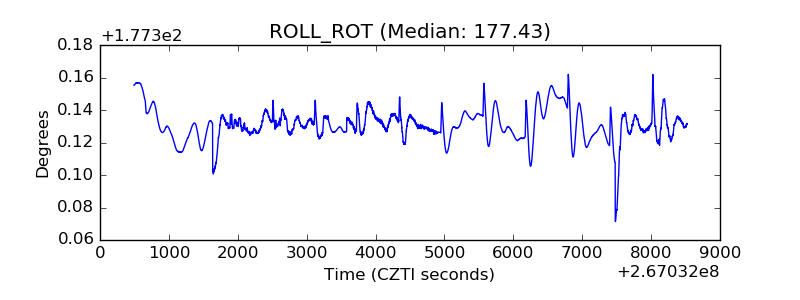 |
| _Roll_DEC |  |
| _Roll_RA | 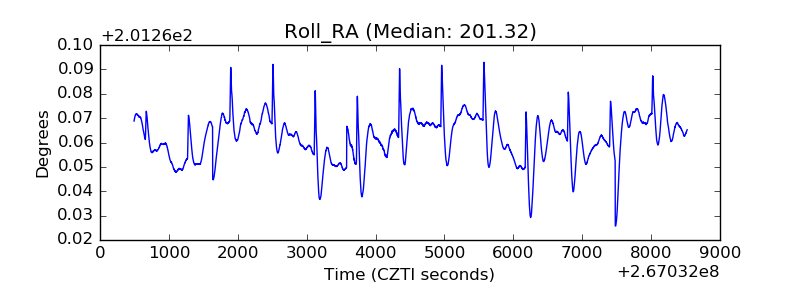 |
| Veto Counter | 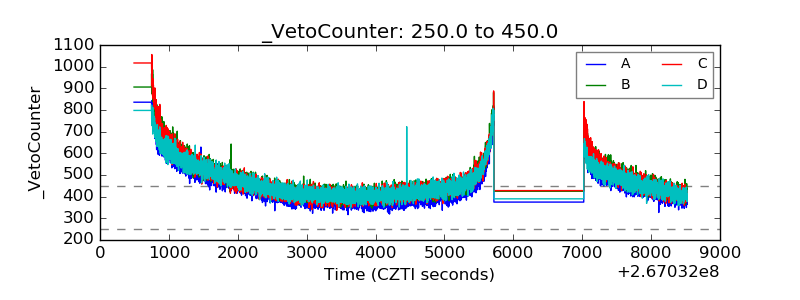 |