| Param | Original file | Final file |
|---|---|---|
| Filename | modeM0/AS1A04_048T01_9000002176_14723cztM0_level2.evt | modeM0/AS1A04_048T01_9000002176_14723cztM0_level2_quad_clean.evt |
| Size (bytes) | 513,305,280 | 99,008,640 |
| Size | 489.5 MB | 94.4 MB |
| Events in quadrant A | 3,278,752 | 653,867 |
| Events in quadrant B | 3,406,512 | 645,146 |
| Events in quadrant C | 4,130,754 | 622,649 |
| Events in quadrant D | 4,266,645 | 601,382 |
| Mode M9 | |||
|---|---|---|---|
| Quadrant | BADHDUFLAG | Total packets | Discarded packets |
| A | 0 | 11 | 0 |
| B | 0 | 11 | 0 |
| C | 0 | 11 | 0 |
| D | 0 | 12 | 0 |
| Mode M0 | |||
|---|---|---|---|
| Quadrant | BADHDUFLAG | Total packets | Discarded packets |
| A | 0 | 14203 | 3 |
| B | 0 | 14528 | 2 |
| C | 0 | 16703 | 2 |
| D | 0 | 17508 | 2 |
| Mode SS | |||
|---|---|---|---|
| Quadrant | BADHDUFLAG | Total packets | Discarded packets |
| A | 0 | 138 | 0 |
| B | 0 | 138 | 0 |
| C | 0 | 138 | 0 |
| D | 0 | 138 | 0 |
| Quadrant | Total seconds | Saturated seconds | Saturation percentage |
|---|---|---|---|
| A | 6822 | 18 | 0.263852% |
| B | 6822 | 52 | 0.762240% |
| C | 6822 | 99 | 1.451187% |
| D | 6822 | 304 | 4.456171% |
Noise dominated data is calculated using 1-second bins in cleaned event files. If a bin has >2000 counts, and if more than 50% of those come from <1% of pixels, then it is considered to be noise-dominated and hence unusable.
| Quadrant | # 1 sec bins | Bins with >0 counts | Bins with >2000 counts | High rate bins dominated by noise | Noise dominated (total time) | Noise dominated (detector-on time) | Marked lightcurve |
|---|---|---|---|---|---|---|---|
| A | 7583 | 6824 | 0 | 0 | 0.00% | 0.00% | 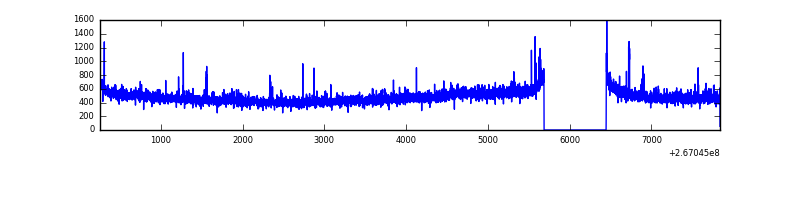 |
| B | 7583 | 6824 | 22 | 22 | 0.29% | 0.32% | 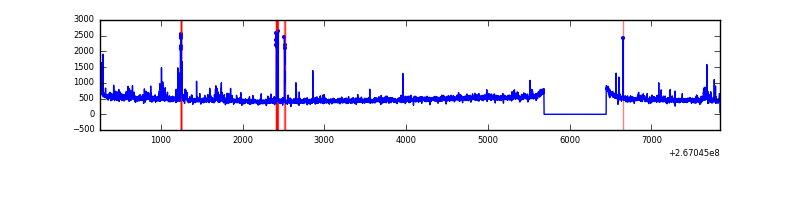 |
| C | 7583 | 6824 | 76 | 76 | 1.00% | 1.11% | 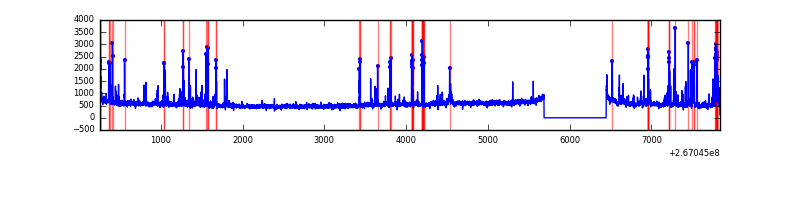 |
| D | 7583 | 6824 | 326 | 326 | 4.30% | 4.78% | 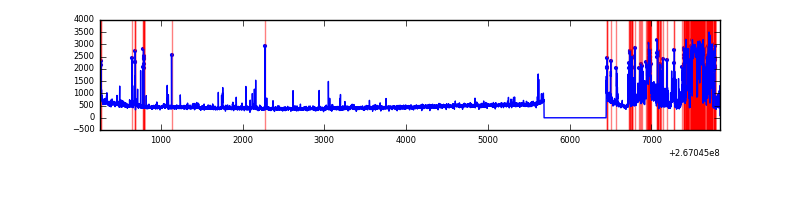 |
Top three noisy pixels from each quadrant. If the there are fewer than three noisy pixels in the level2.evt file, extra rows are filled as -1
| Pixel properties | Quadrant properties | ||||||
|---|---|---|---|---|---|---|---|
| Quadrant | DetID | PixID | Counts | Sigma | Mean | Median | Sigma |
| A | 12 | 189 | 52922 | 308.83 | 818 | 802 | 168.8 |
| A | 3 | 1 | 31171 | 179.94 | 818 | 802 | 168.8 |
| A | 8 | 15 | 21239 | 121.09 | 818 | 802 | 168.8 |
| B | 0 | 205 | 56388 | 356.55 | 812 | 794 | 155.9 |
| B | 10 | 16 | 55878 | 353.28 | 812 | 794 | 155.9 |
| B | 0 | 230 | 30778 | 192.3 | 812 | 794 | 155.9 |
| C | 3 | 233 | 655168 | 3646.92 | 774 | 778 | 179.4 |
| C | 4 | 254 | 437930 | 2436.25 | 774 | 778 | 179.4 |
| C | 0 | 207 | 11445 | 59.45 | 774 | 778 | 179.4 |
| D | 1 | 255 | 1142595 | 5608.83 | 766 | 751 | 203.6 |
| D | 12 | 16 | 70386 | 342.05 | 766 | 751 | 203.6 |
| D | 15 | 217 | 37995 | 182.94 | 766 | 751 | 203.6 |
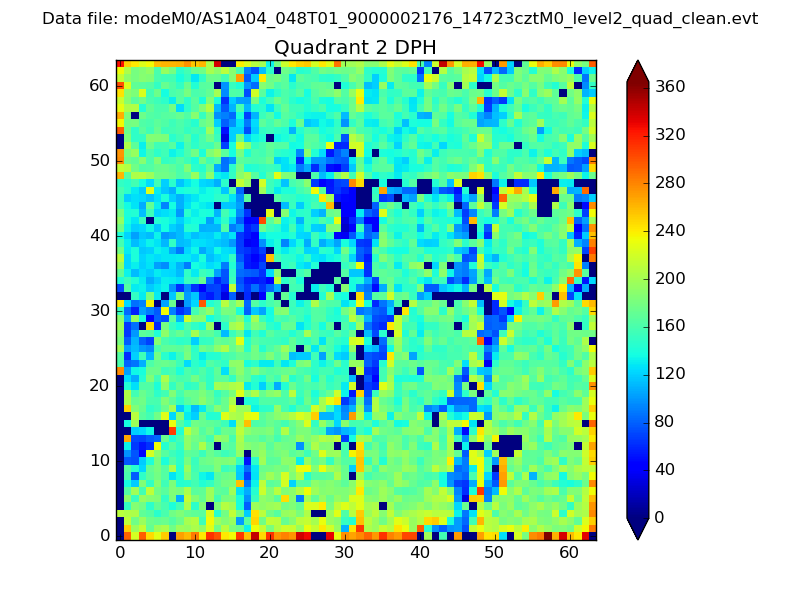
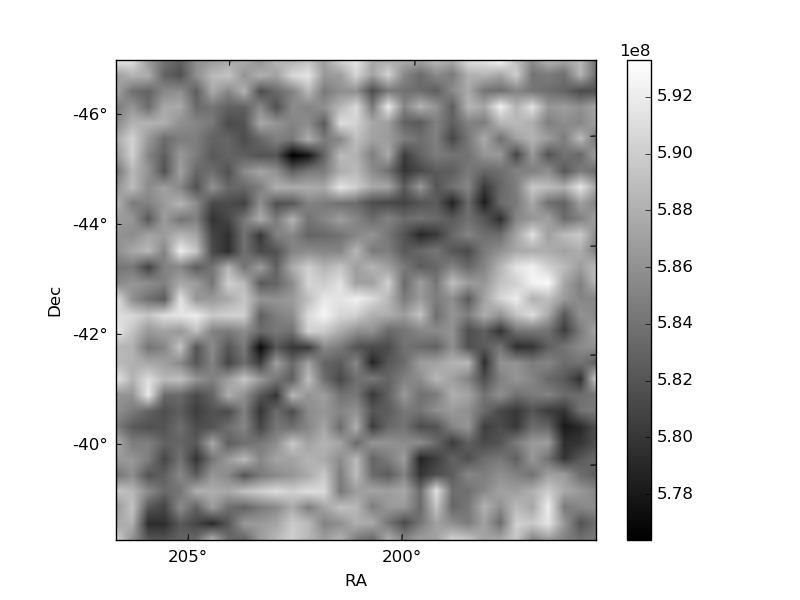
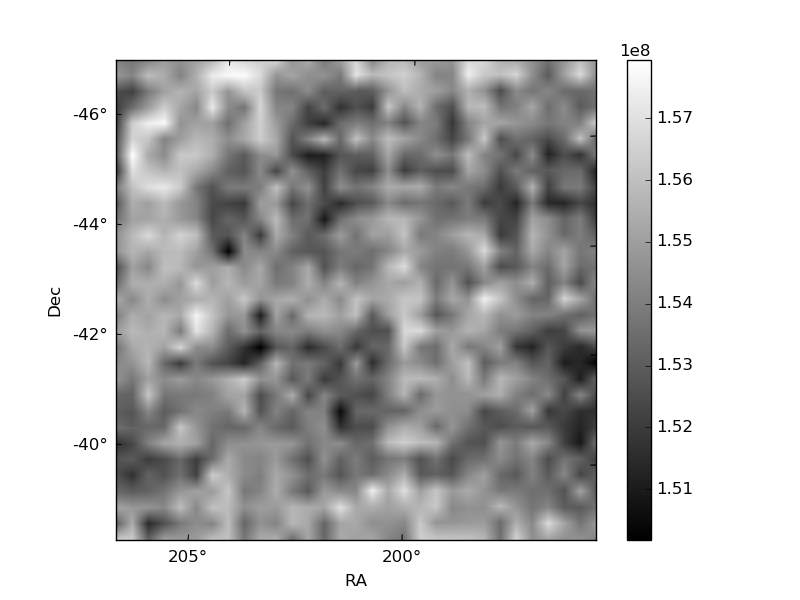
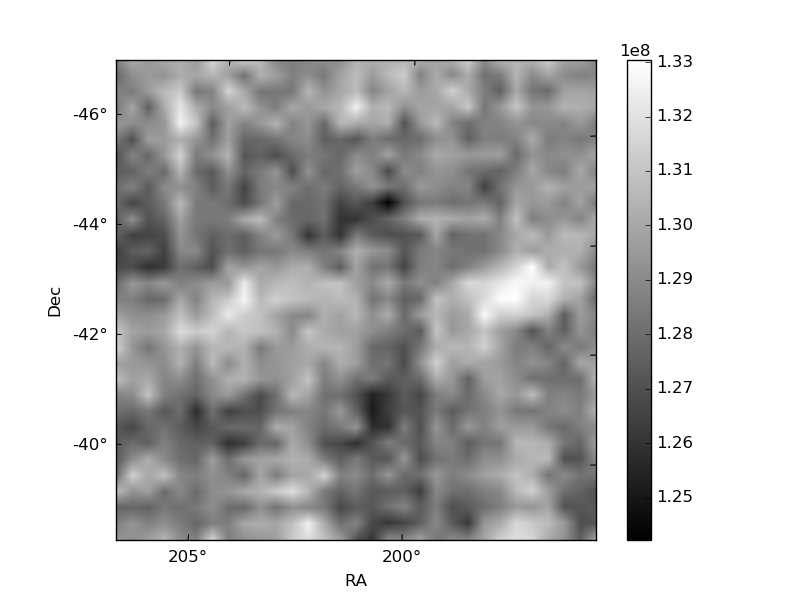
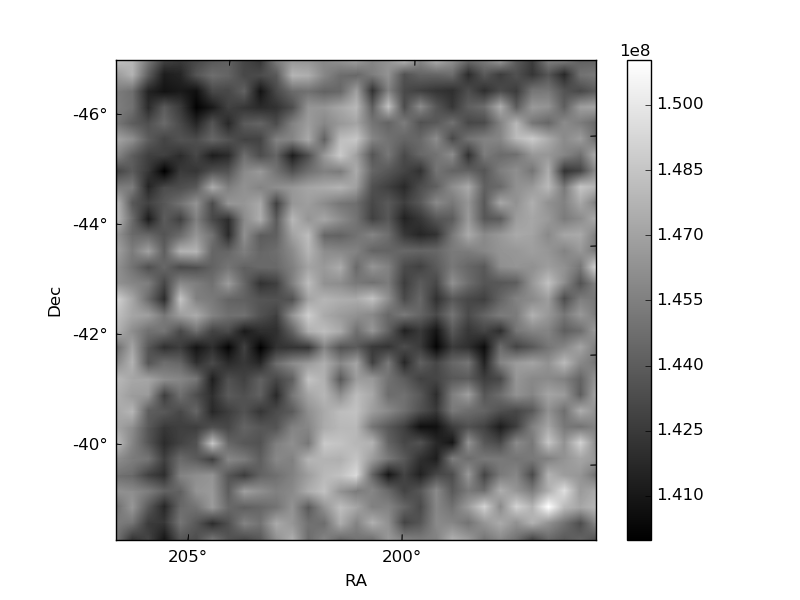
Histogram calculated using DETX and DETY for each event in the final _common_clean file
| Quadrant A | 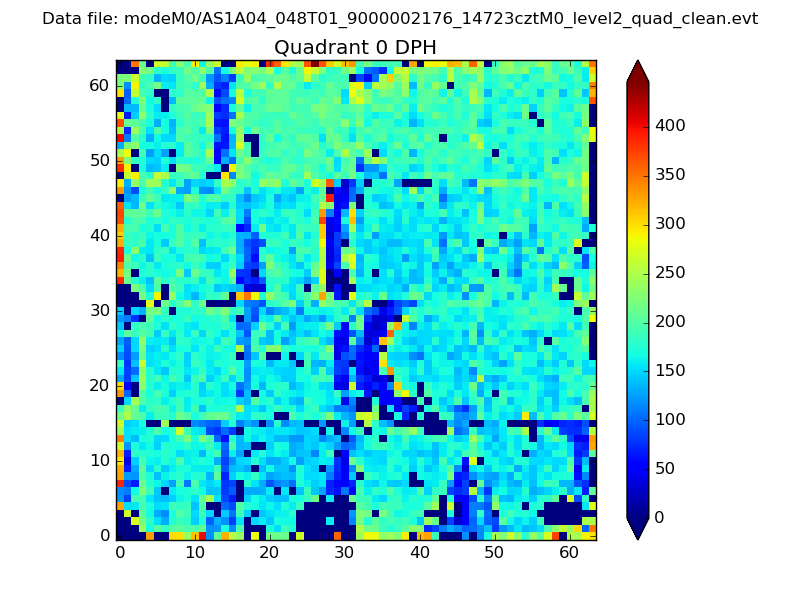 |
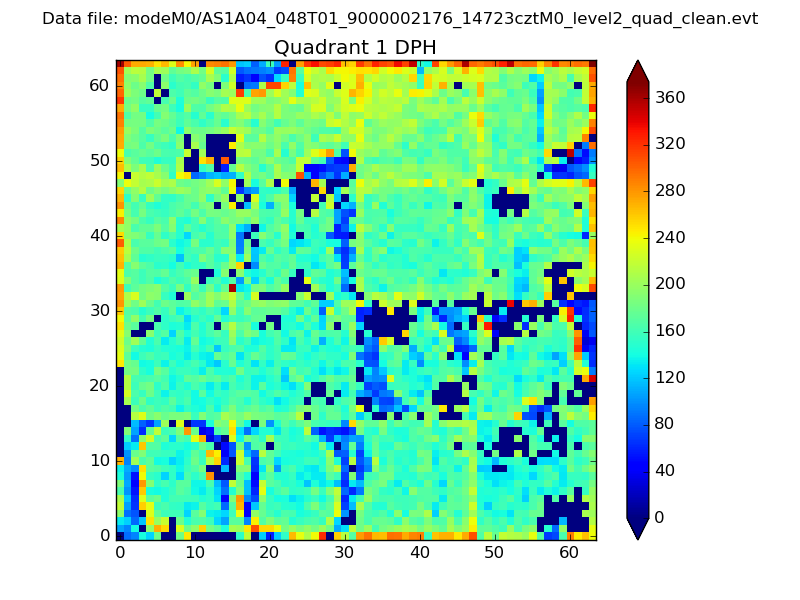 |
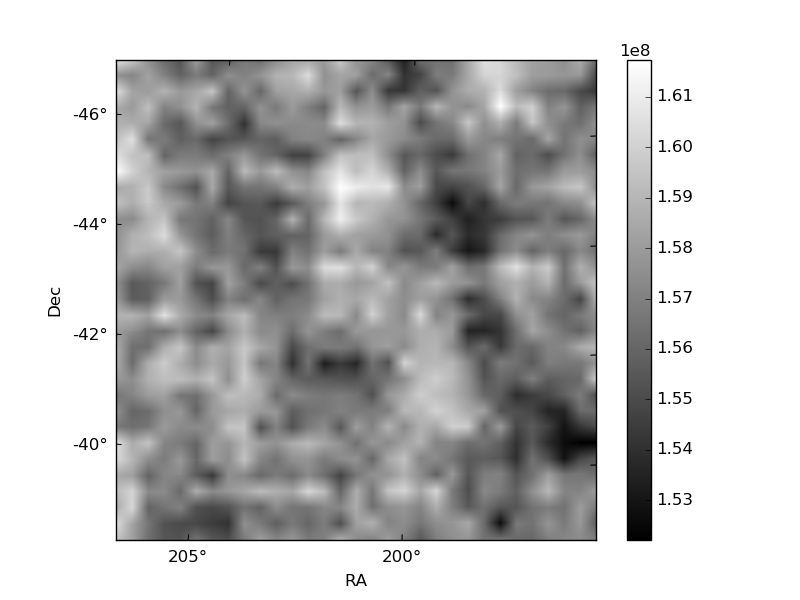
Quadrant B |
|---|---|---|---|
| Quadrant D | 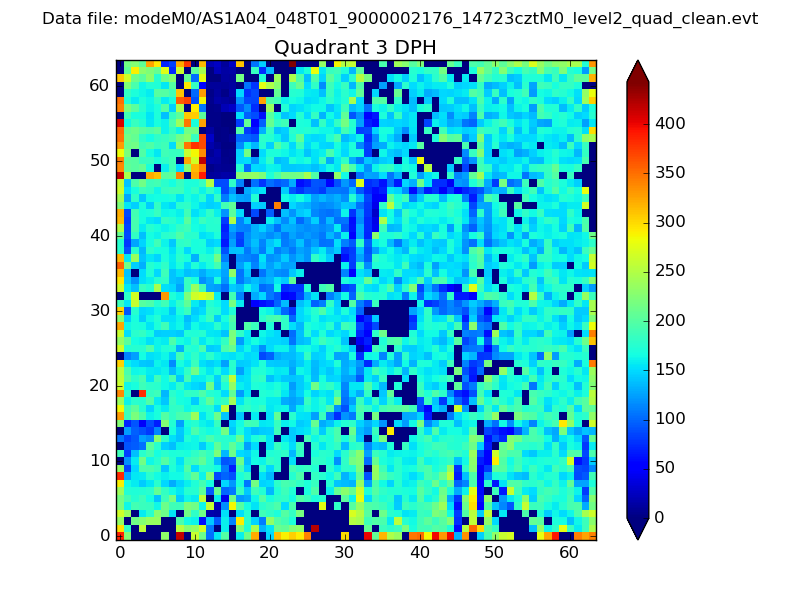 |
 |
Quadrant C |
| Plot type | Count rate plots | Images |
|---|---|---|
| Comparison with Poisson distribution Blue bars denote a histogram of data divided into 1 sec bins. Red curve is a Poisson curve with rate = median count rate of data. |
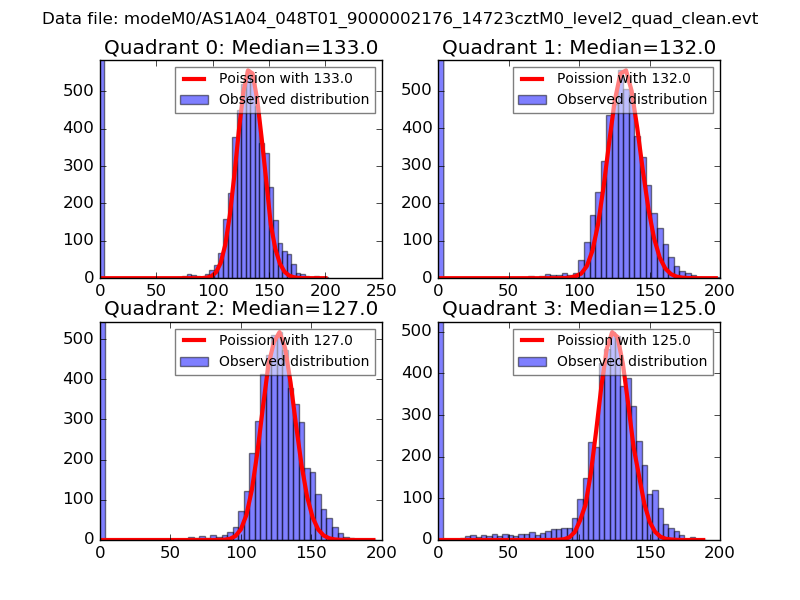 |
 |
| Quadrant-wise count rates Data is divided into 100 sec bins |
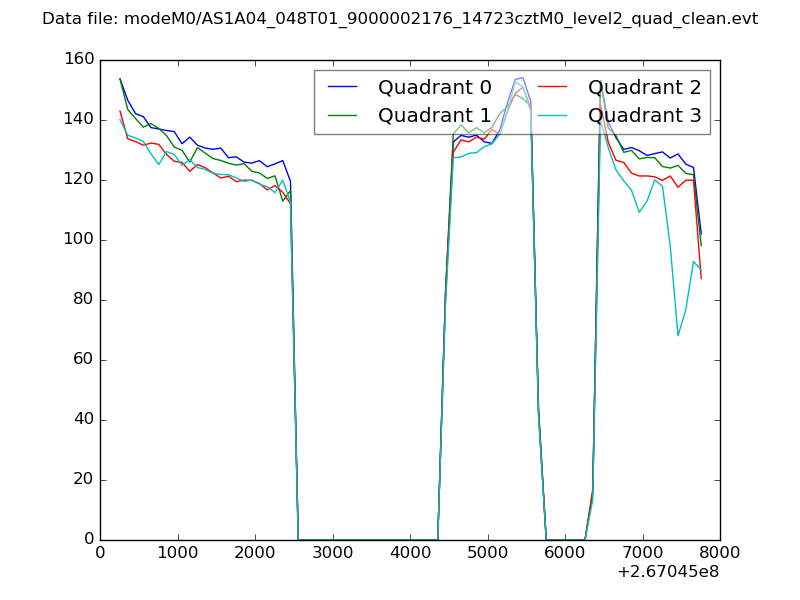 |
|
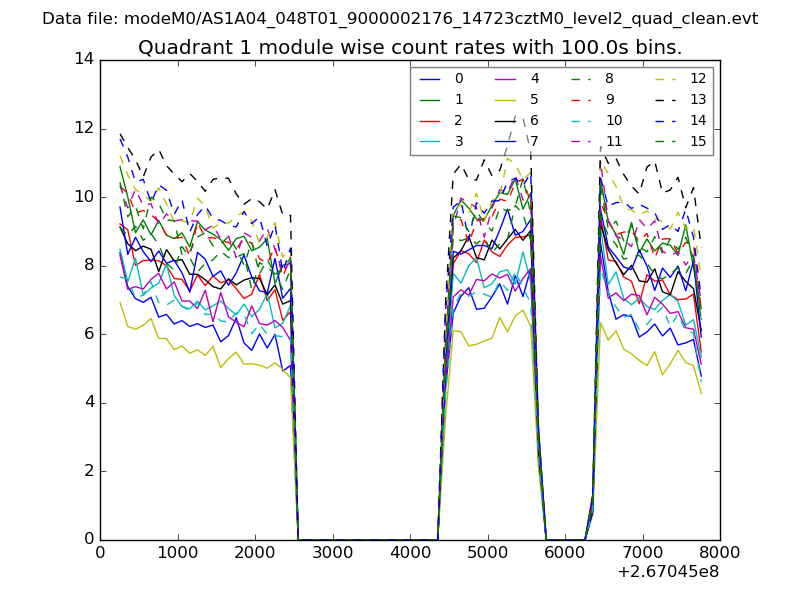
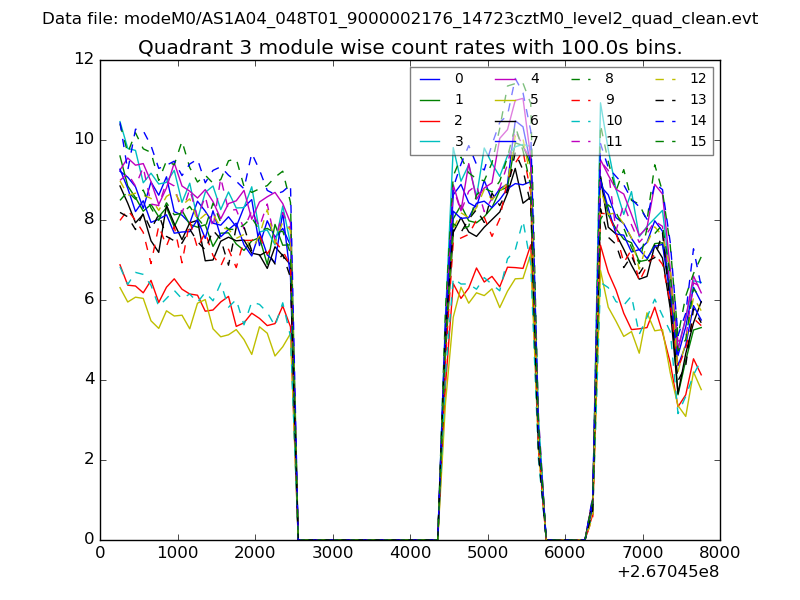
| Module-wise count rates for Quadrant A Data is divided into 100 sec bins |
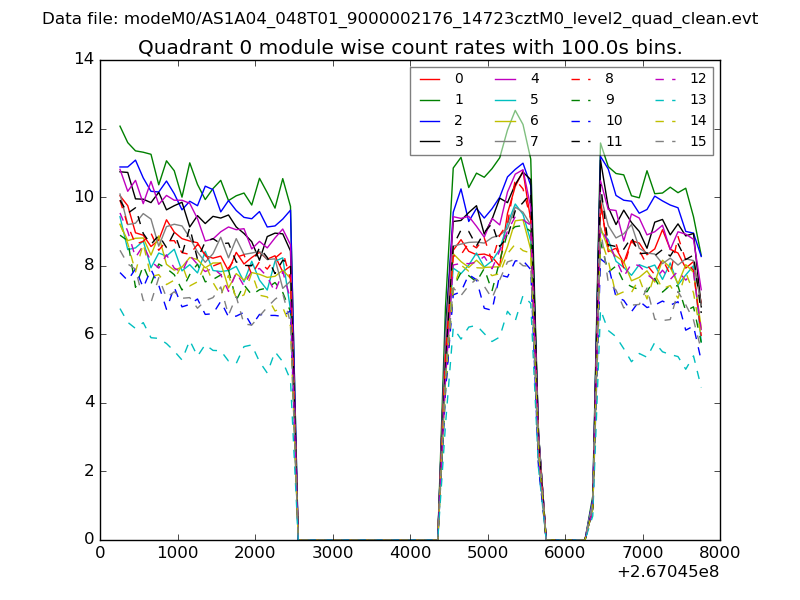 |
 |
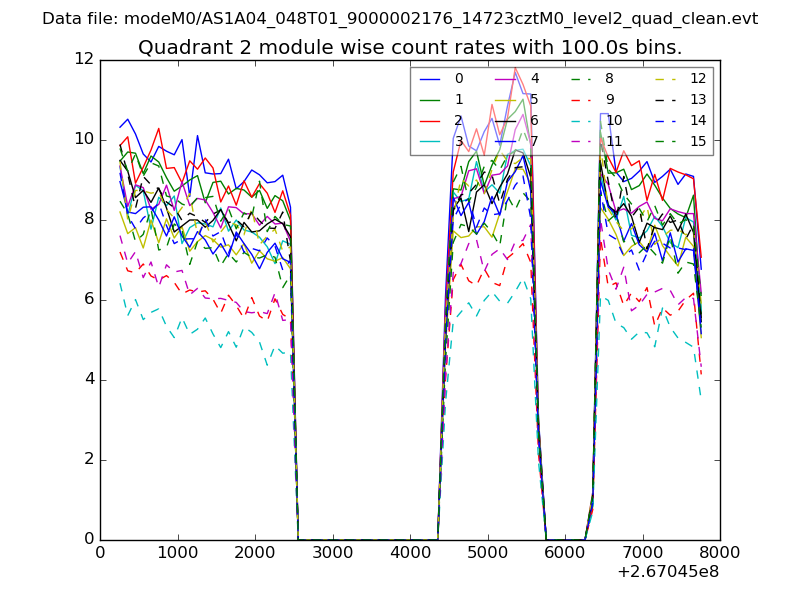
| Module-wise count rates for Quadrant B Data is divided into 100 sec bins |
 |
 |
| Module-wise count rates for Quadrant C Data is divided into 100 sec bins |
 |
 |
| Module-wise count rates for Quadrant D Data is divided into 100 sec bins |
 |
 |
| Parameter | Plot |
|---|---|
| CZT HV Monitor | 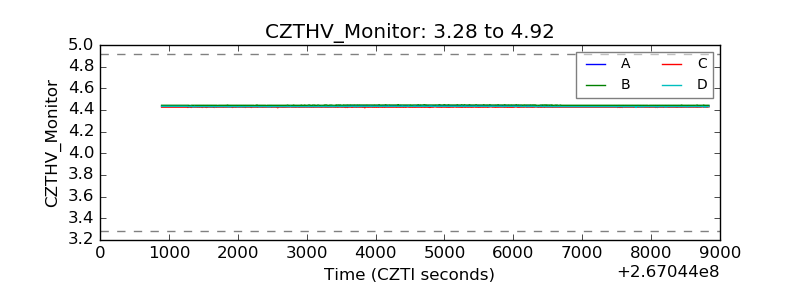 |
| D_VDD | 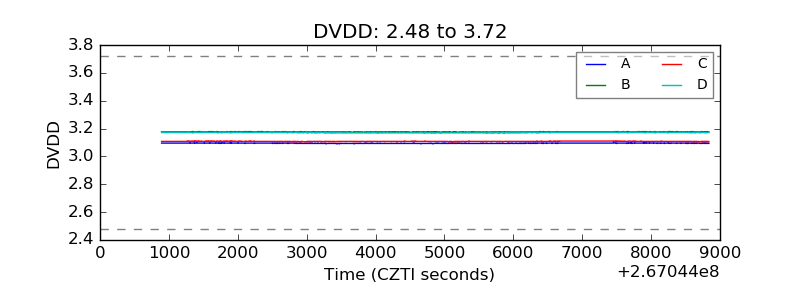 |
| Temperature 1 | 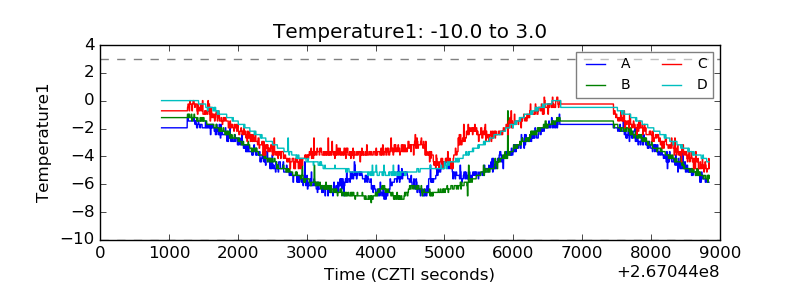 |
| Veto HV Monitor | 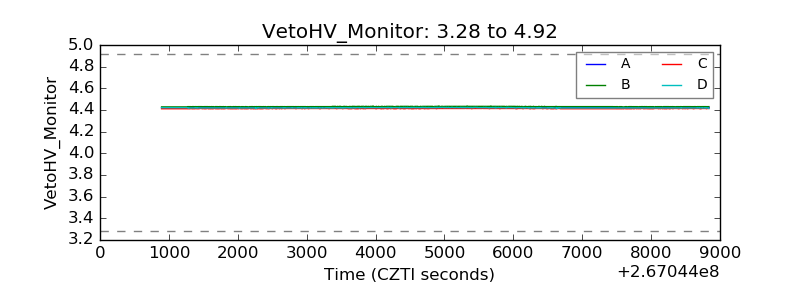 |
| Veto LLD | 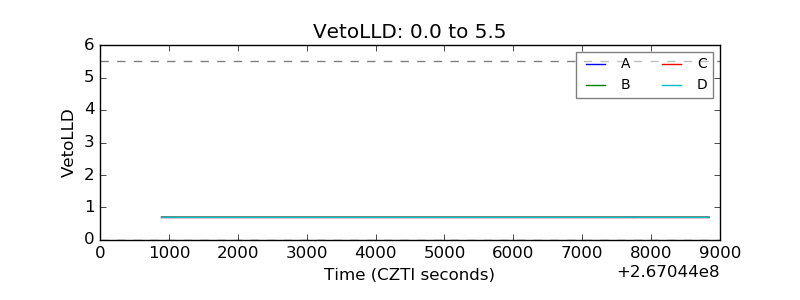 |
| Alpha Counter | 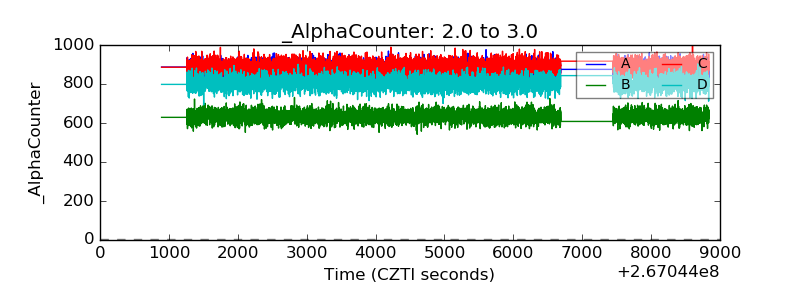 |
| _CPM_Rate | 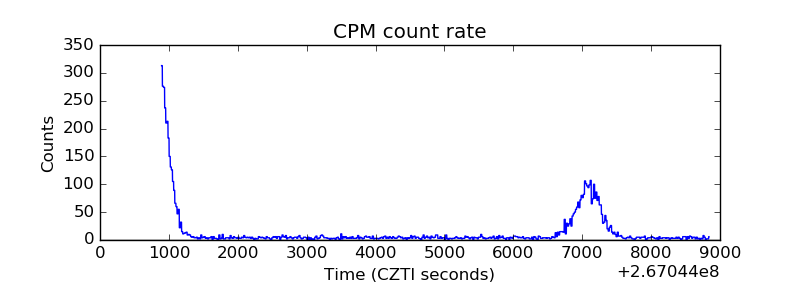 |
| CZT Counter | 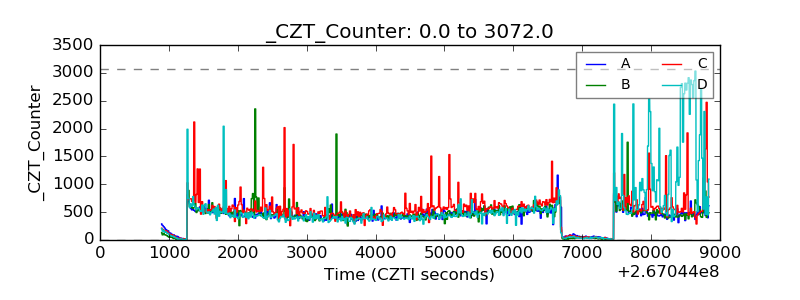 |
| +2.5 Volts monitor |  |
| +5 Volts monitor |  |
| _ROLL_ROT | 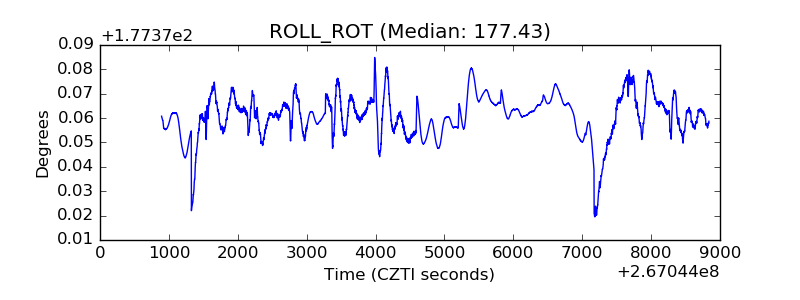 |
| _Roll_DEC | 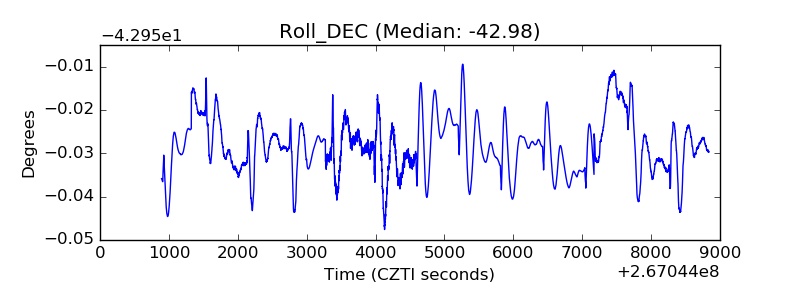 |
| _Roll_RA | 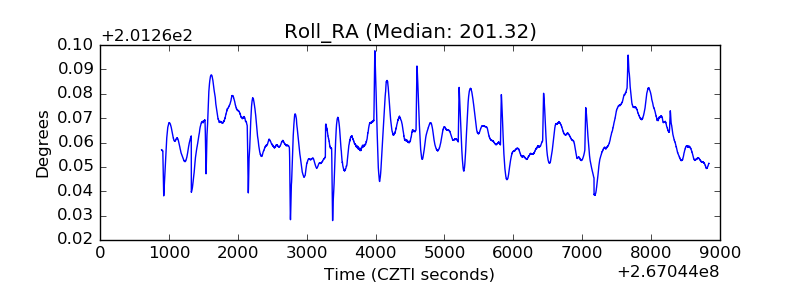 |
| Veto Counter | 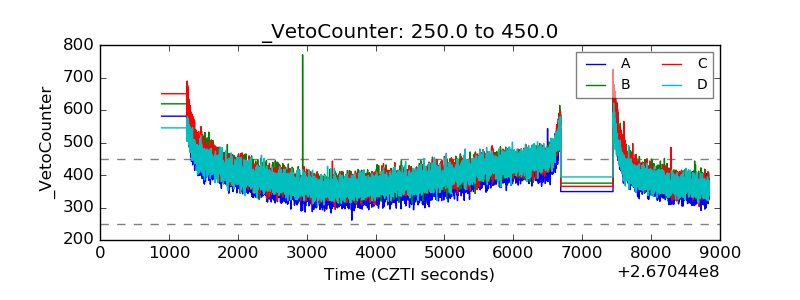 |