| Param | Original file | Final file |
|---|---|---|
| Filename | modeM0/AS1A04_048T01_9000002176_14724cztM0_level2.evt | modeM0/AS1A04_048T01_9000002176_14724cztM0_level2_quad_clean.evt |
| Size (bytes) | 542,001,600 | 106,030,080 |
| Size | 516.9 MB | 101.1 MB |
| Events in quadrant A | 3,580,954 | 696,401 |
| Events in quadrant B | 3,528,241 | 693,288 |
| Events in quadrant C | 4,095,073 | 671,618 |
| Events in quadrant D | 4,715,884 | 642,495 |
| Mode M9 | |||
|---|---|---|---|
| Quadrant | BADHDUFLAG | Total packets | Discarded packets |
| A | 0 | 7 | 0 |
| B | 0 | 7 | 0 |
| C | 0 | 7 | 0 |
| D | 0 | 8 | 0 |
| Mode M0 | |||
|---|---|---|---|
| Quadrant | BADHDUFLAG | Total packets | Discarded packets |
| A | 0 | 15299 | 3 |
| B | 0 | 15278 | 2 |
| C | 0 | 16755 | 2 |
| D | 0 | 19166 | 2 |
| Mode SS | |||
|---|---|---|---|
| Quadrant | BADHDUFLAG | Total packets | Discarded packets |
| A | 0 | 148 | 0 |
| B | 0 | 148 | 0 |
| C | 0 | 148 | 0 |
| D | 0 | 148 | 0 |
| Quadrant | Total seconds | Saturated seconds | Saturation percentage |
|---|---|---|---|
| A | 7286 | 57 | 0.782322% |
| B | 7286 | 61 | 0.837222% |
| C | 7286 | 61 | 0.837222% |
| D | 7286 | 359 | 4.927258% |
Noise dominated data is calculated using 1-second bins in cleaned event files. If a bin has >2000 counts, and if more than 50% of those come from <1% of pixels, then it is considered to be noise-dominated and hence unusable.
| Quadrant | # 1 sec bins | Bins with >0 counts | Bins with >2000 counts | High rate bins dominated by noise | Noise dominated (total time) | Noise dominated (detector-on time) | Marked lightcurve |
|---|---|---|---|---|---|---|---|
| A | 7582 | 7288 | 12 | 12 | 0.16% | 0.16% | 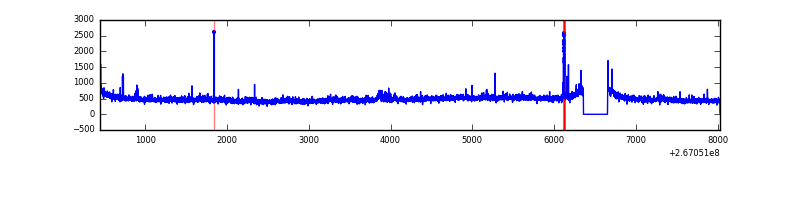 |
| B | 7582 | 7288 | 5 | 5 | 0.07% | 0.07% | 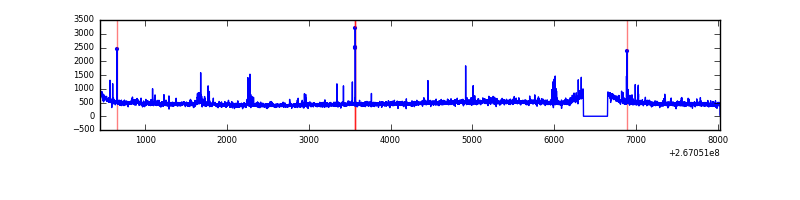 |
| C | 7582 | 7288 | 30 | 30 | 0.40% | 0.41% | 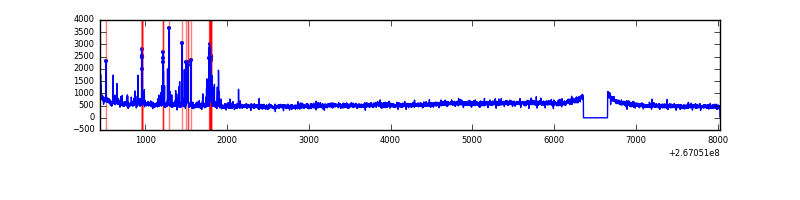 |
| D | 7582 | 7288 | 360 | 360 | 4.75% | 4.94% | 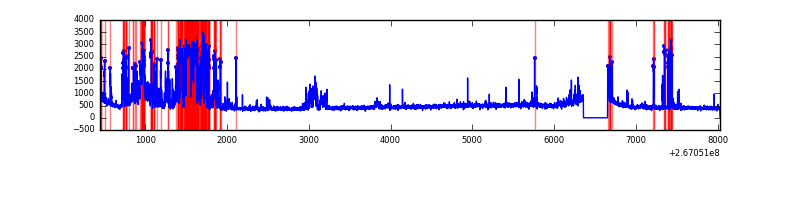 |
Top three noisy pixels from each quadrant. If the there are fewer than three noisy pixels in the level2.evt file, extra rows are filled as -1
| Pixel properties | Quadrant properties | ||||||
|---|---|---|---|---|---|---|---|
| Quadrant | DetID | PixID | Counts | Sigma | Mean | Median | Sigma |
| A | 12 | 189 | 106380 | 591.05 | 870 | 850 | 178.5 |
| A | 8 | 15 | 40956 | 224.62 | 870 | 850 | 178.5 |
| A | 15 | 69 | 32805 | 178.97 | 870 | 850 | 178.5 |
| B | 0 | 230 | 21910 | 126.0 | 867 | 845 | 167.2 |
| B | 0 | 205 | 20936 | 120.17 | 867 | 845 | 167.2 |
| B | 12 | 111 | 18544 | 105.86 | 867 | 845 | 167.2 |
| C | 3 | 233 | 663105 | 3433.51 | 828 | 829 | 192.9 |
| C | 4 | 254 | 196015 | 1011.92 | 828 | 829 | 192.9 |
| C | 13 | 61 | 6109 | 27.37 | 828 | 829 | 192.9 |
| D | 1 | 255 | 1171865 | 5736.36 | 822 | 798 | 204.1 |
| D | 10 | 199 | 104308 | 507.03 | 822 | 798 | 204.1 |
| D | 15 | 0 | 97423 | 473.31 | 822 | 798 | 204.1 |
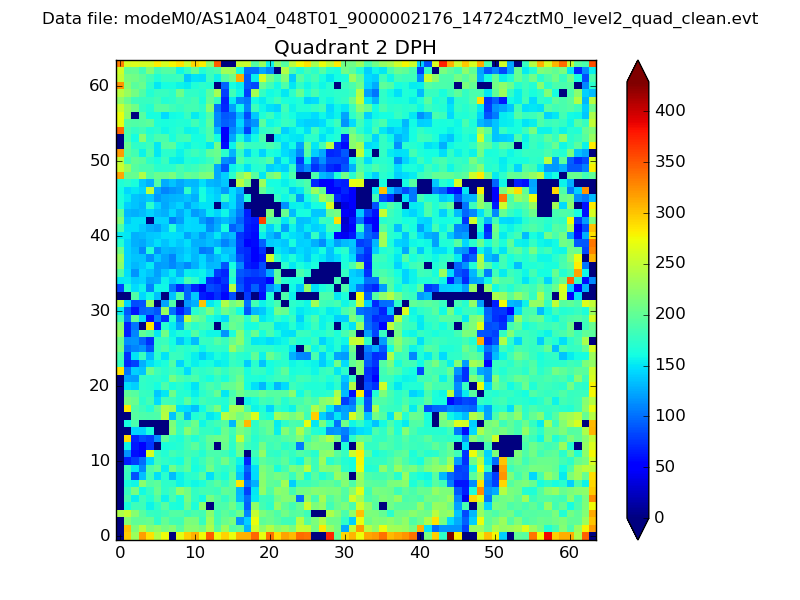
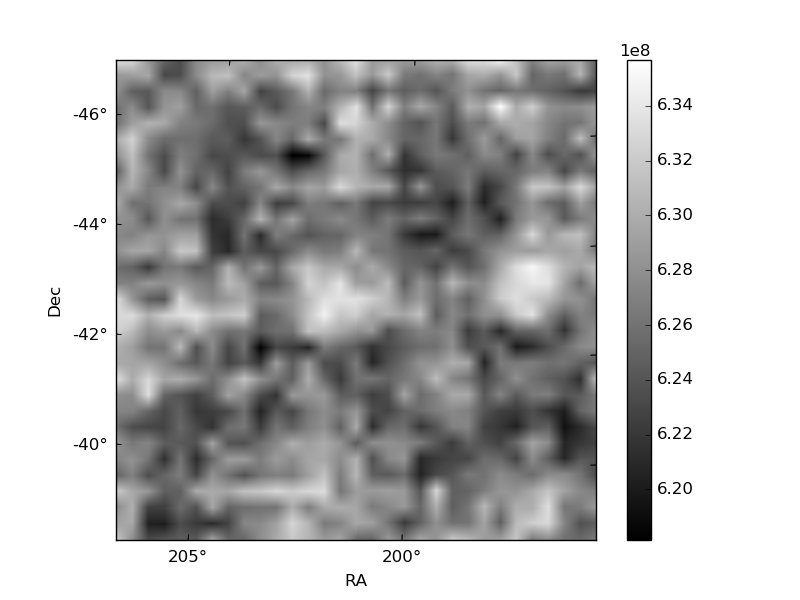
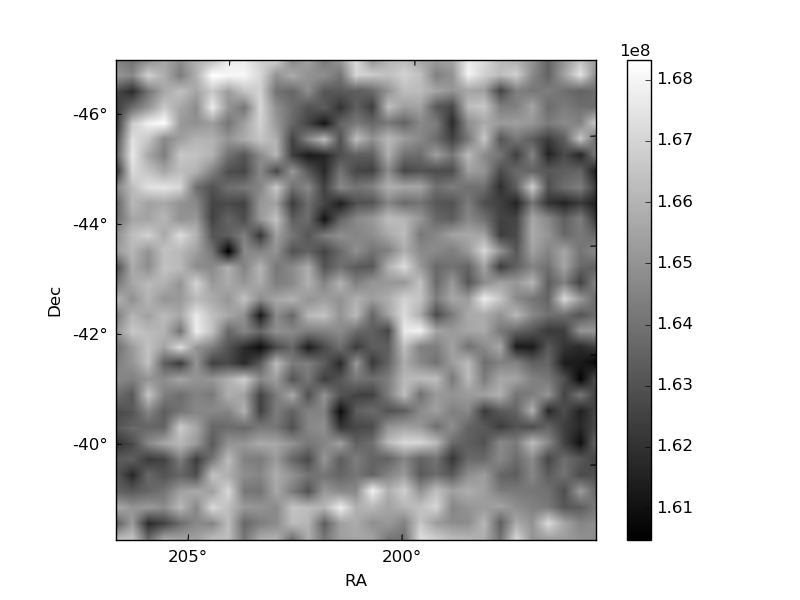
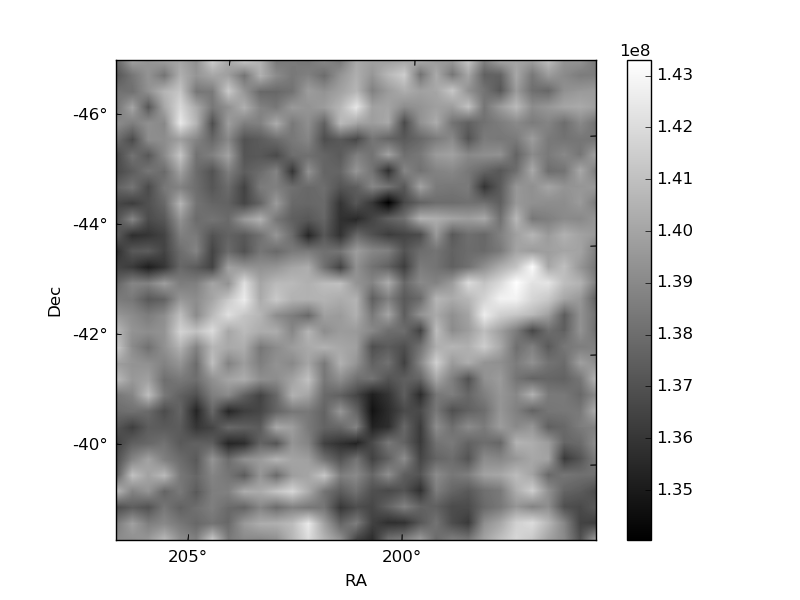
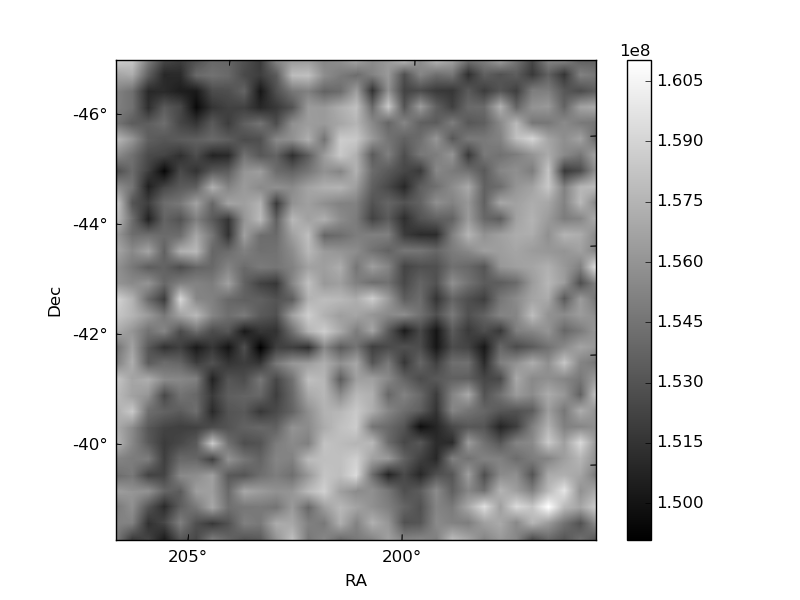
Histogram calculated using DETX and DETY for each event in the final _common_clean file
| Quadrant A | 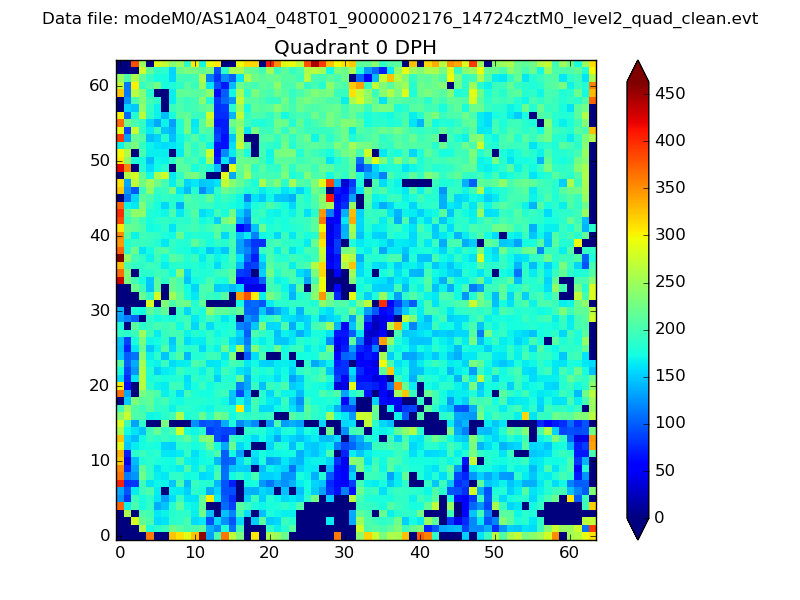 |
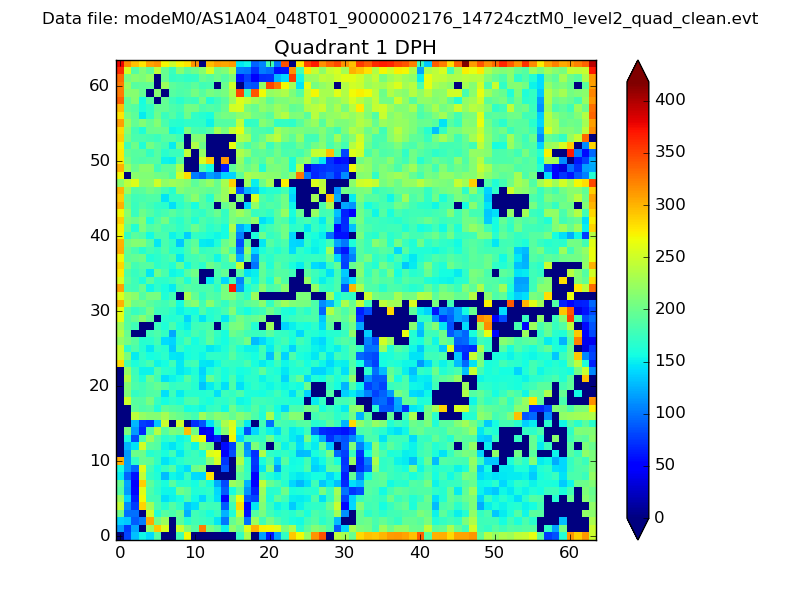 |
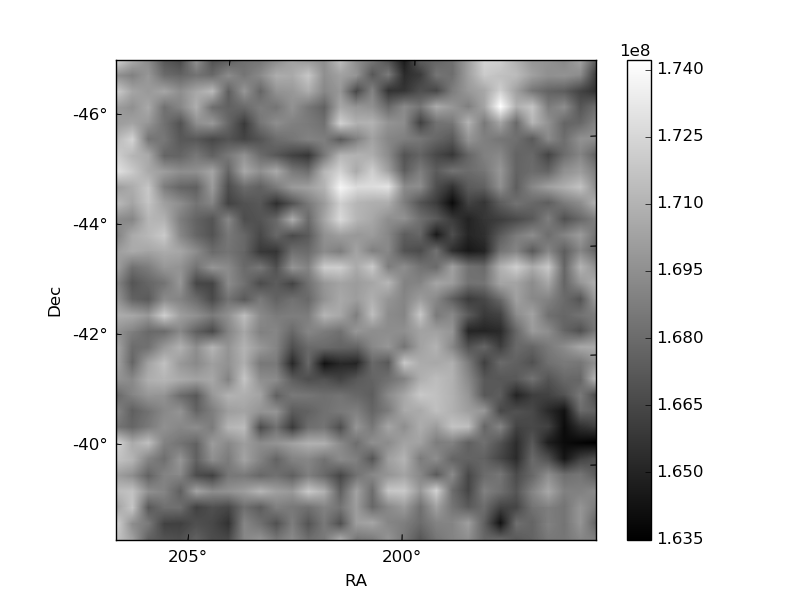
Quadrant B |
|---|---|---|---|
| Quadrant D | 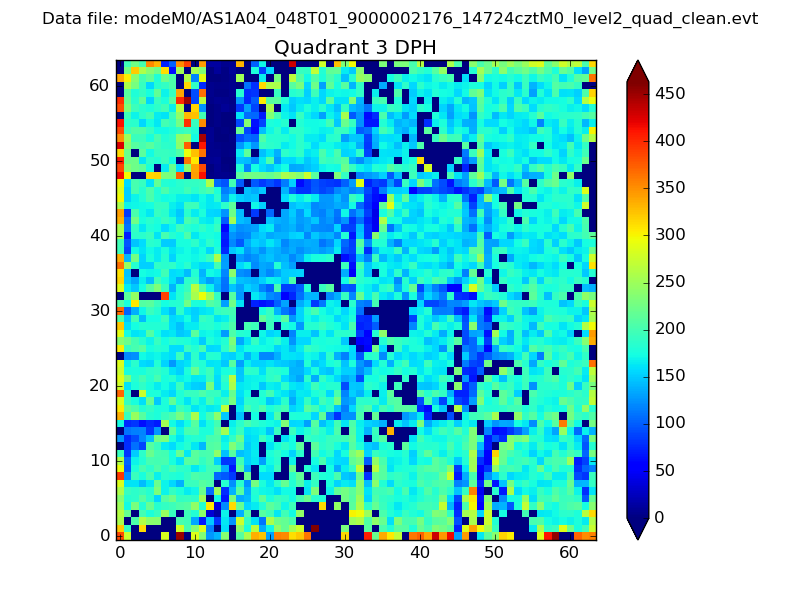 |
 |
Quadrant C |
| Plot type | Count rate plots | Images |
|---|---|---|
| Comparison with Poisson distribution Blue bars denote a histogram of data divided into 1 sec bins. Red curve is a Poisson curve with rate = median count rate of data. |
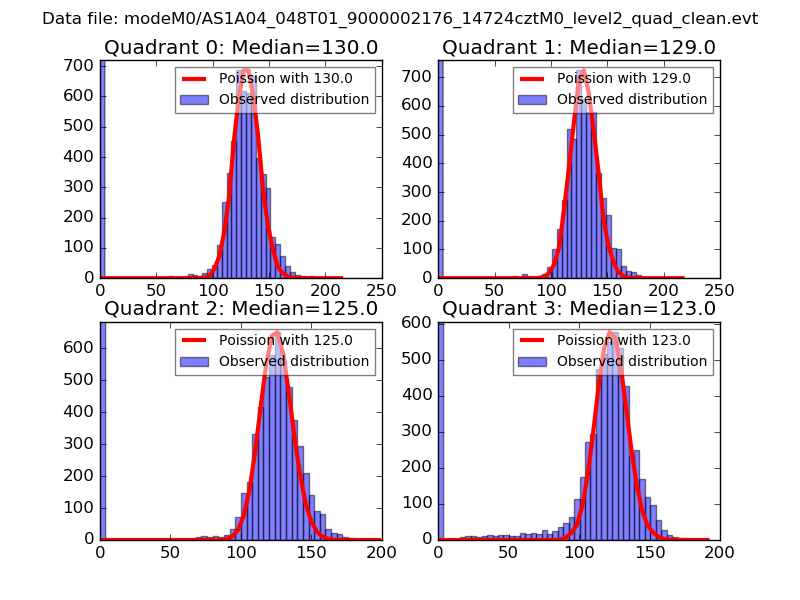 |
 |
| Quadrant-wise count rates Data is divided into 100 sec bins |
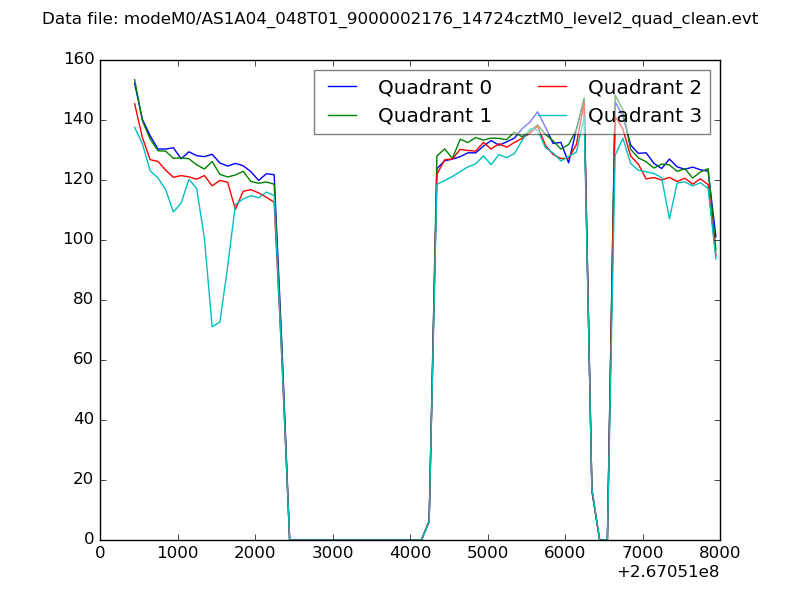 |
|
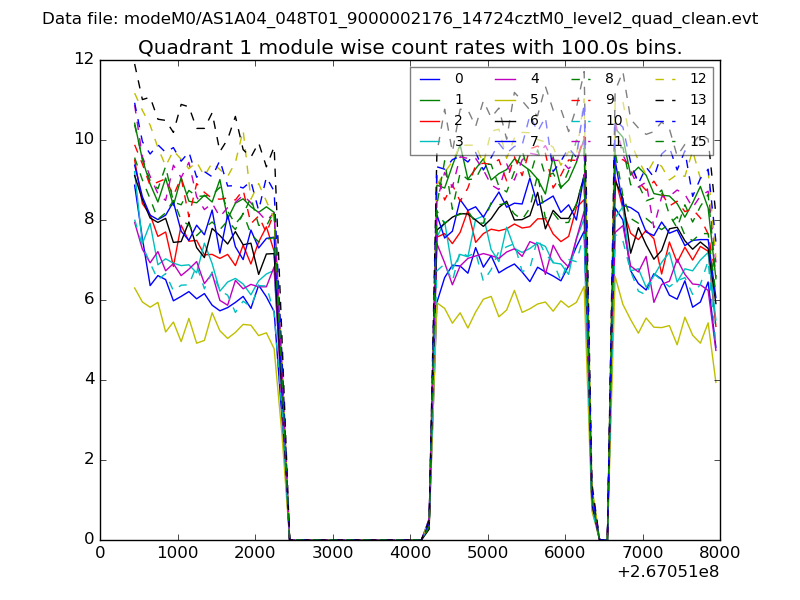
| Module-wise count rates for Quadrant A Data is divided into 100 sec bins |
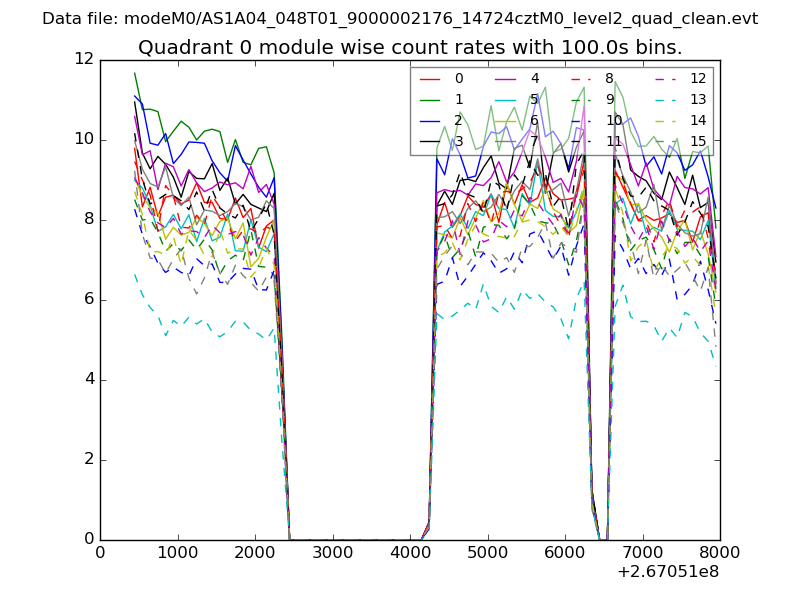 |
 |
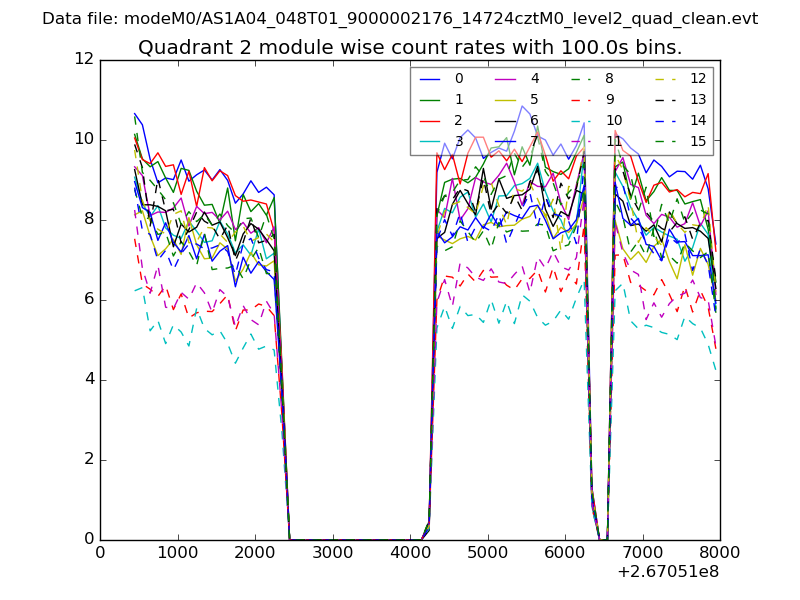
| Module-wise count rates for Quadrant B Data is divided into 100 sec bins |
 |
 |
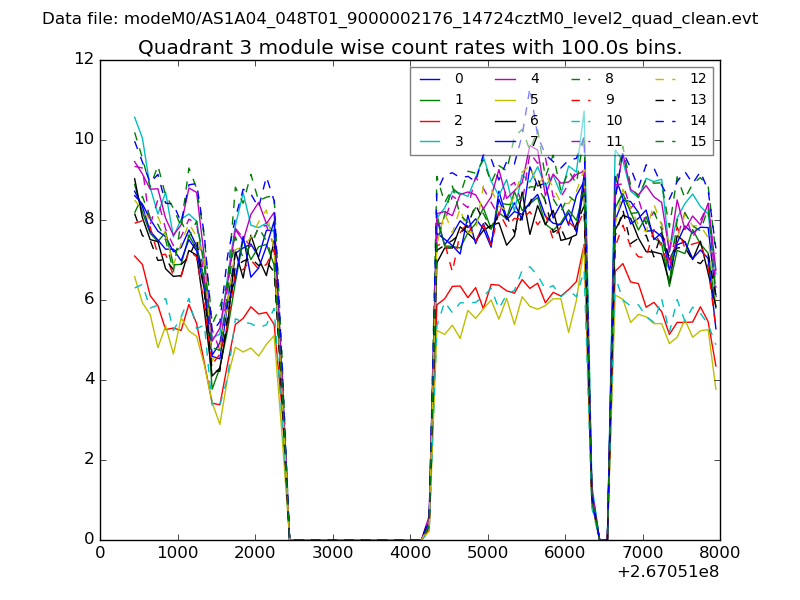
| Module-wise count rates for Quadrant C Data is divided into 100 sec bins |
 |
 |
| Module-wise count rates for Quadrant D Data is divided into 100 sec bins |
 |
 |
| Parameter | Plot |
|---|---|
| CZT HV Monitor | 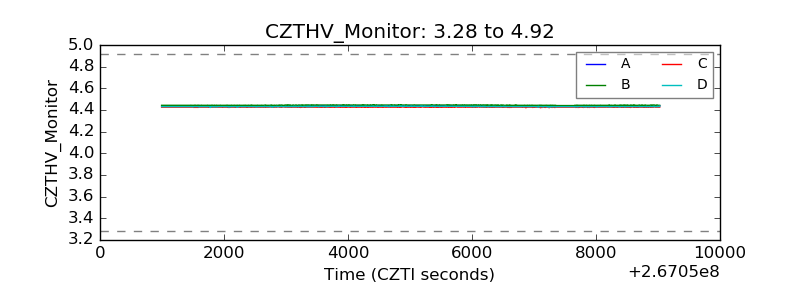 |
| D_VDD | 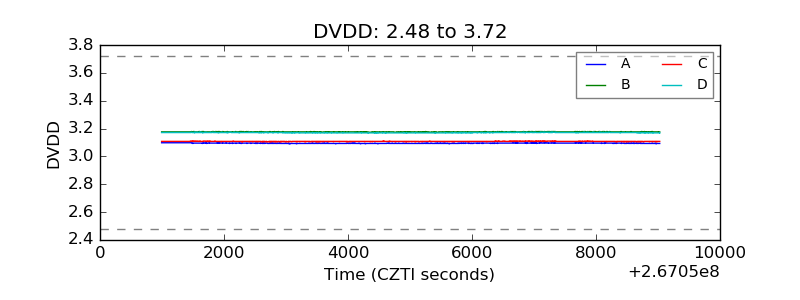 |
| Temperature 1 | 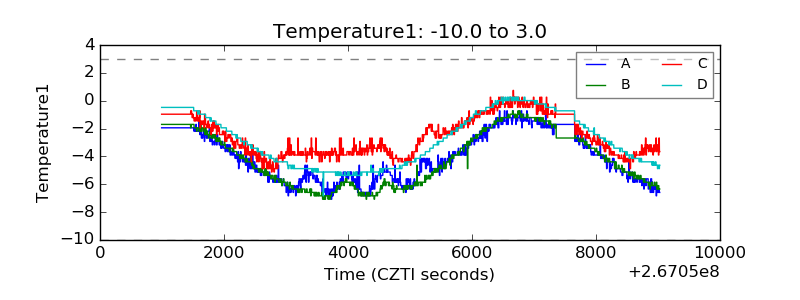 |
| Veto HV Monitor | 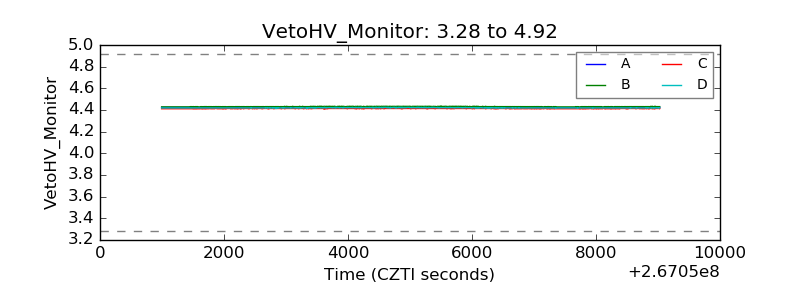 |
| Veto LLD | 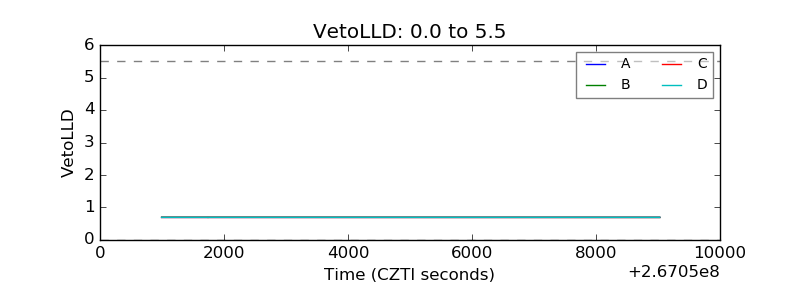 |
| Alpha Counter | 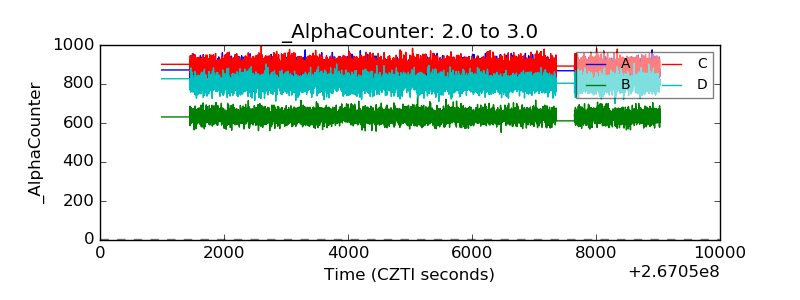 |
| _CPM_Rate | 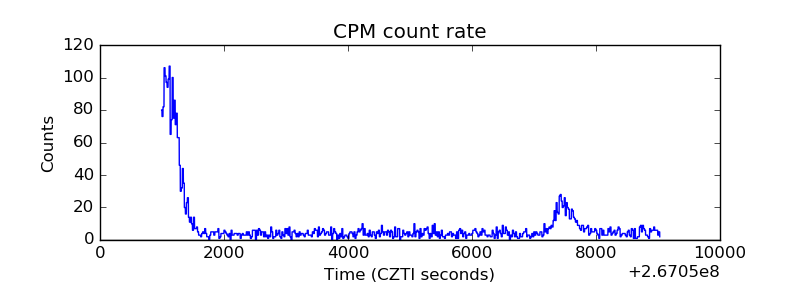 |
| CZT Counter | 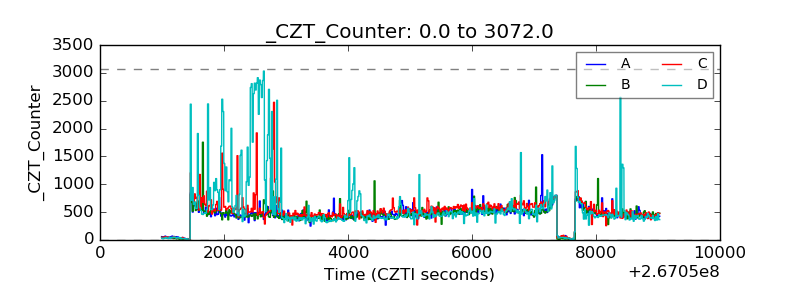 |
| +2.5 Volts monitor |  |
| +5 Volts monitor | 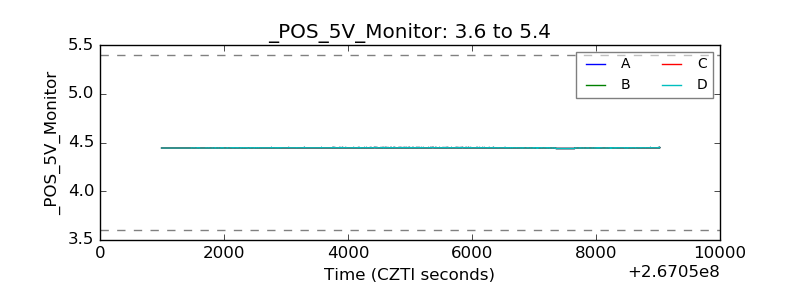 |
| _ROLL_ROT | 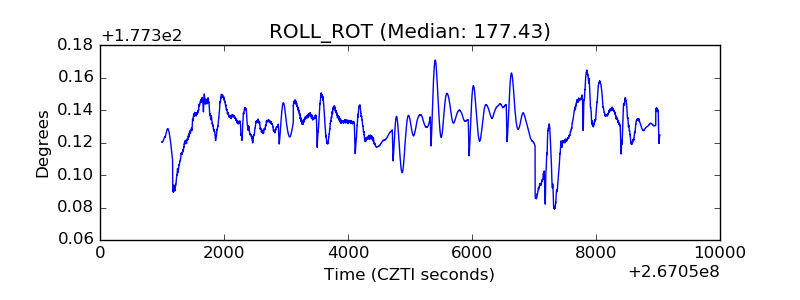 |
| _Roll_DEC | 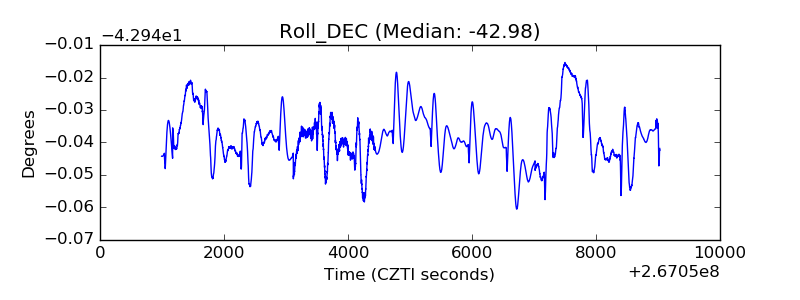 |
| _Roll_RA | 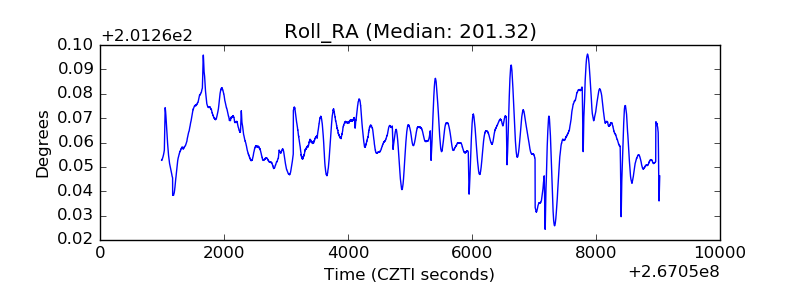 |
| Veto Counter | 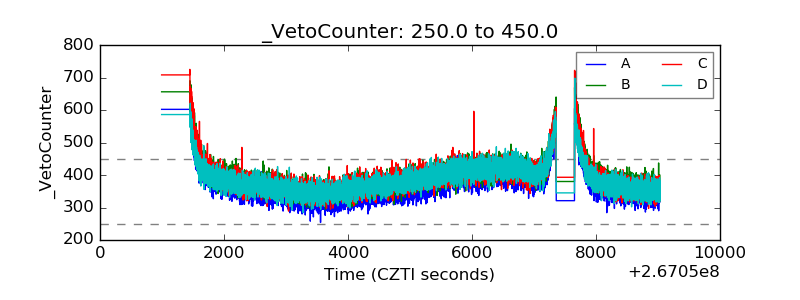 |