| Param | Original file | Final file |
|---|---|---|
| Filename | modeM0/AS1A04_048T01_9000002176_14725cztM0_level2.evt | modeM0/AS1A04_048T01_9000002176_14725cztM0_level2_quad_clean.evt |
| Size (bytes) | 551,246,400 | 115,076,160 |
| Size | 525.7 MB | 109.7 MB |
| Events in quadrant A | 4,095,817 | 745,140 |
| Events in quadrant B | 3,945,708 | 746,589 |
| Events in quadrant C | 4,291,968 | 722,312 |
| Events in quadrant D | 3,816,563 | 713,768 |
| Mode M9 | |||
|---|---|---|---|
| Quadrant | BADHDUFLAG | Total packets | Discarded packets |
| A | 0 | 5 | 0 |
| B | 0 | 5 | 0 |
| C | 0 | 5 | 0 |
| D | 0 | 5 | 0 |
| Mode M0 | |||
|---|---|---|---|
| Quadrant | BADHDUFLAG | Total packets | Discarded packets |
| A | 0 | 17435 | 3 |
| B | 0 | 16951 | 2 |
| C | 0 | 17836 | 2 |
| D | 0 | 17166 | 2 |
| Mode SS | |||
|---|---|---|---|
| Quadrant | BADHDUFLAG | Total packets | Discarded packets |
| A | 0 | 166 | 0 |
| B | 0 | 166 | 0 |
| C | 0 | 166 | 0 |
| D | 0 | 166 | 0 |
| Quadrant | Total seconds | Saturated seconds | Saturation percentage |
|---|---|---|---|
| A | 8012 | 123 | 1.535197% |
| B | 8012 | 116 | 1.447828% |
| C | 8012 | 105 | 1.310534% |
| D | 8012 | 103 | 1.285572% |
Noise dominated data is calculated using 1-second bins in cleaned event files. If a bin has >2000 counts, and if more than 50% of those come from <1% of pixels, then it is considered to be noise-dominated and hence unusable.
| Quadrant | # 1 sec bins | Bins with >0 counts | Bins with >2000 counts | High rate bins dominated by noise | Noise dominated (total time) | Noise dominated (detector-on time) | Marked lightcurve |
|---|---|---|---|---|---|---|---|
| A | 8513 | 8014 | 14 | 14 | 0.16% | 0.17% | 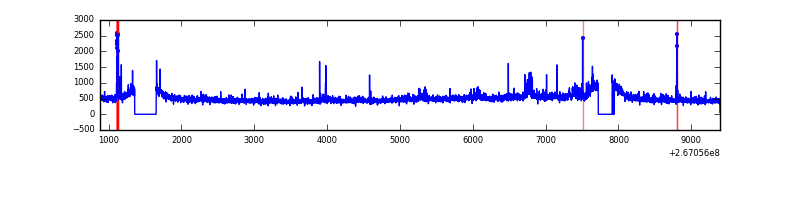 |
| B | 8513 | 8015 | 3 | 3 | 0.04% | 0.04% | 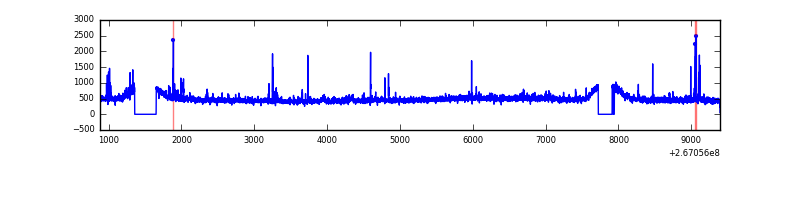 |
| C | 8513 | 8014 | 20 | 20 | 0.23% | 0.25% | 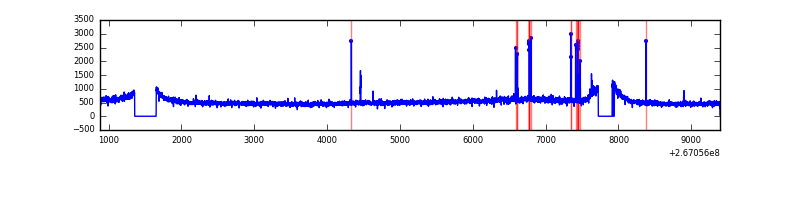 |
| D | 8513 | 8016 | 39 | 39 | 0.46% | 0.49% | 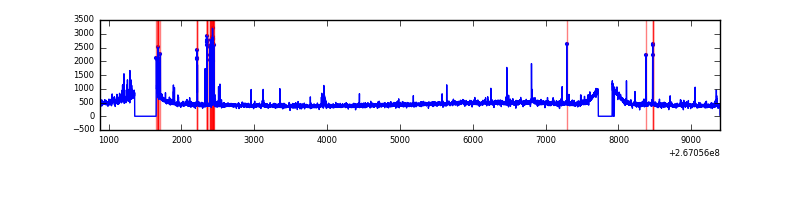 |
Top three noisy pixels from each quadrant. If the there are fewer than three noisy pixels in the level2.evt file, extra rows are filled as -1
| Pixel properties | Quadrant properties | ||||||
|---|---|---|---|---|---|---|---|
| Quadrant | DetID | PixID | Counts | Sigma | Mean | Median | Sigma |
| A | 8 | 15 | 176253 | 878.31 | 968 | 944 | 199.6 |
| A | 12 | 189 | 110765 | 550.21 | 968 | 944 | 199.6 |
| A | 15 | 69 | 33008 | 160.64 | 968 | 944 | 199.6 |
| B | 0 | 229 | 57136 | 304.76 | 964 | 939 | 184.4 |
| B | 0 | 205 | 30472 | 160.16 | 964 | 939 | 184.4 |
| B | 12 | 111 | 20949 | 108.52 | 964 | 939 | 184.4 |
| C | 3 | 233 | 582636 | 2692.15 | 926 | 929 | 216.1 |
| C | 0 | 207 | 70061 | 319.94 | 926 | 929 | 216.1 |
| C | 6 | 96 | 14587 | 63.21 | 926 | 929 | 216.1 |
| D | 15 | 0 | 89865 | 356.75 | 924 | 904 | 249.4 |
| D | 12 | 16 | 83072 | 329.51 | 924 | 904 | 249.4 |
| D | 2 | 234 | 30648 | 119.28 | 924 | 904 | 249.4 |
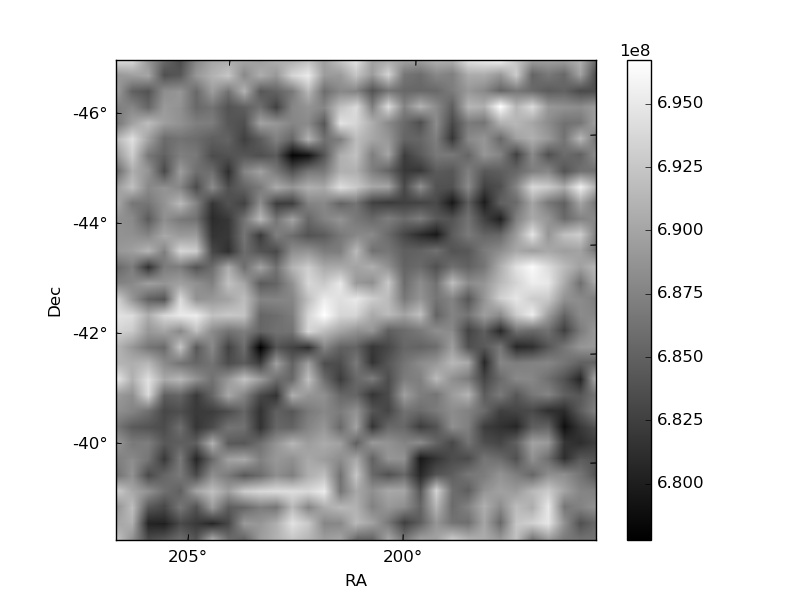
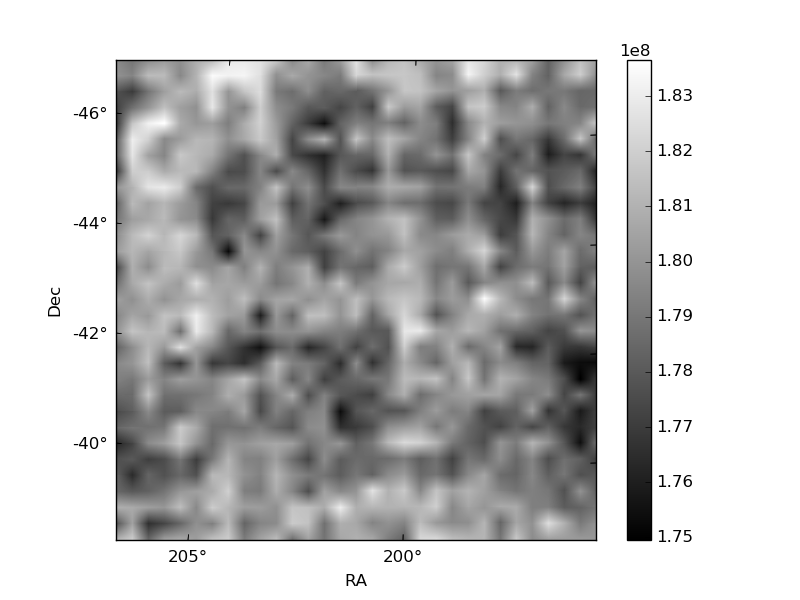
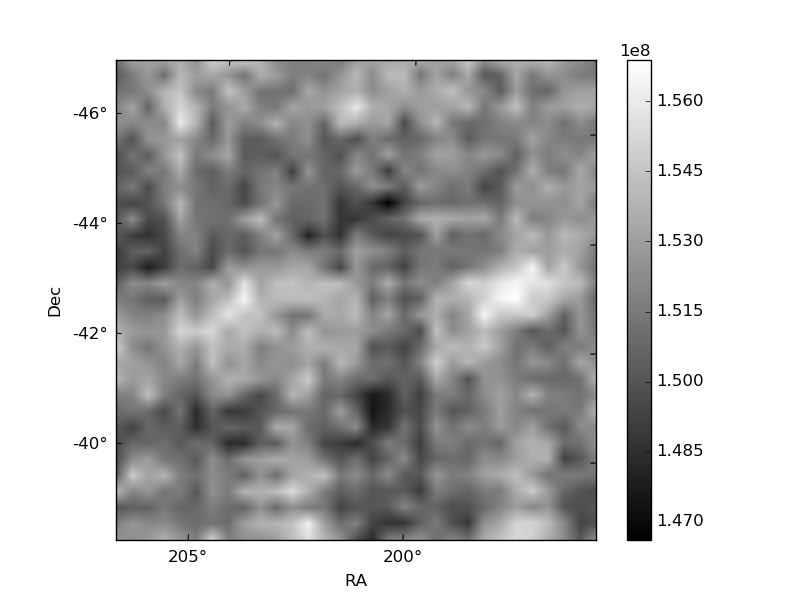
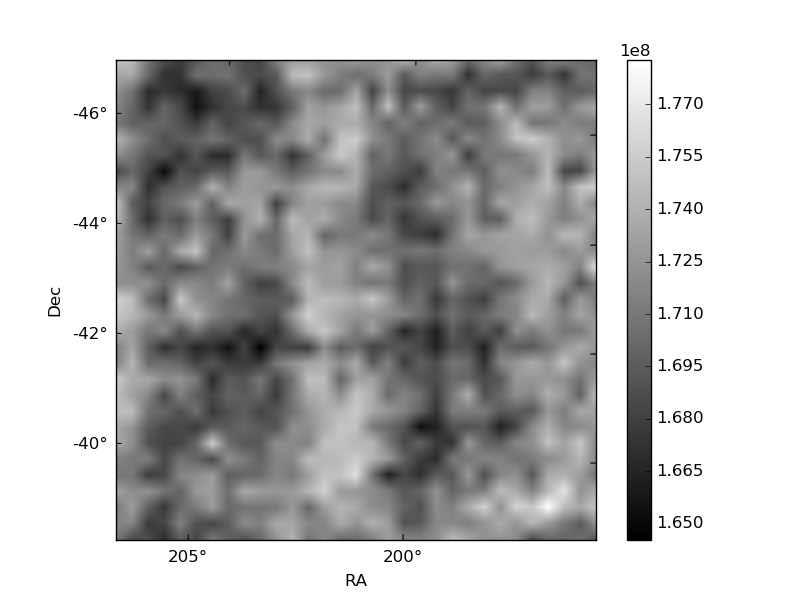
Histogram calculated using DETX and DETY for each event in the final _common_clean file
| Quadrant A | 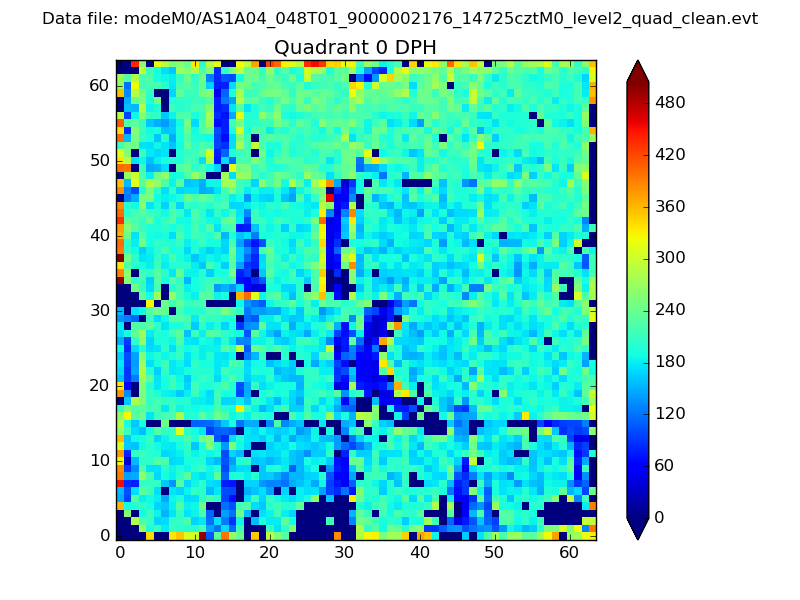 |
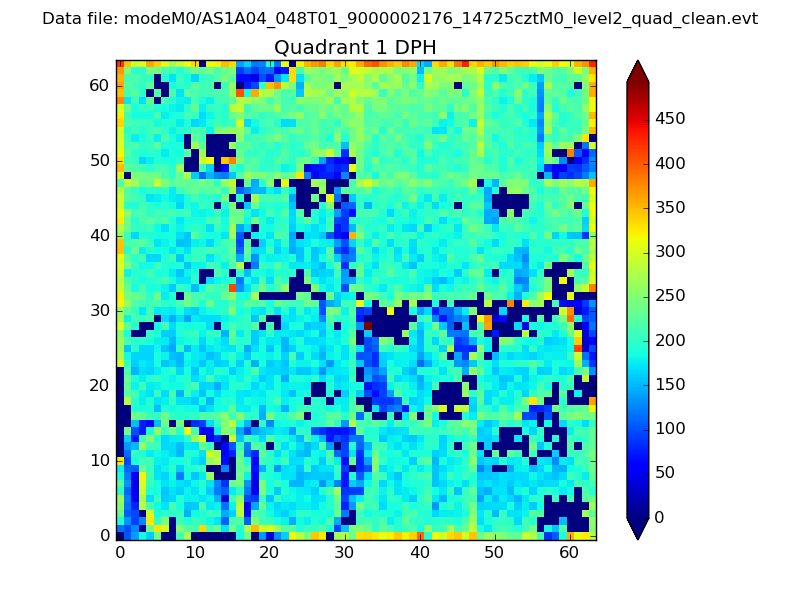 |
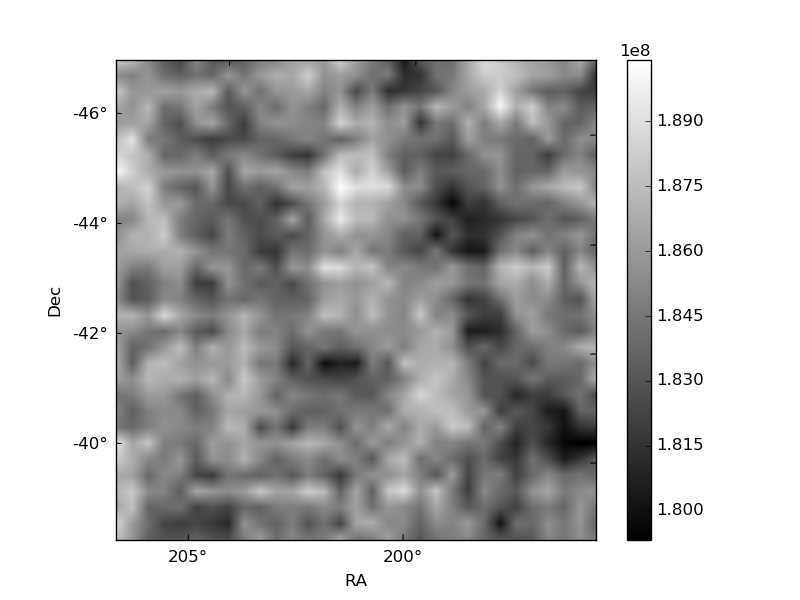
Quadrant B |
|---|---|---|---|
| Quadrant D | 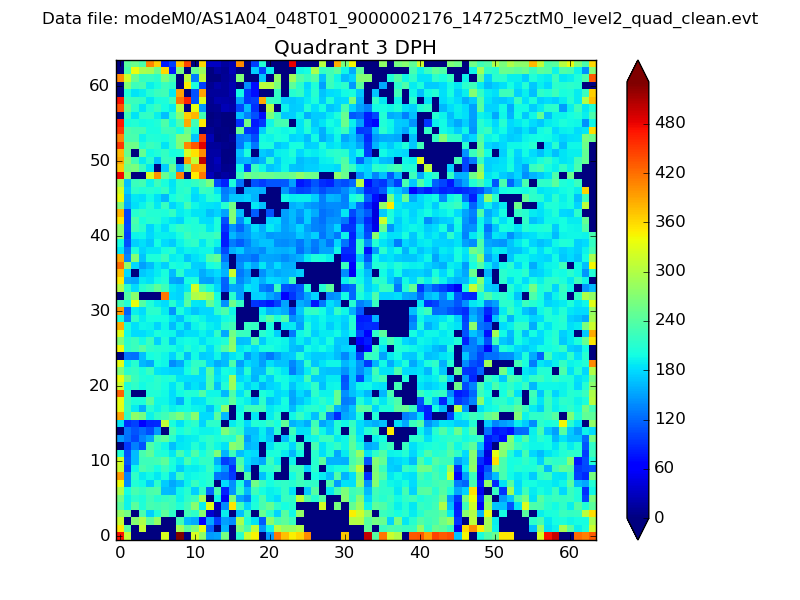 |
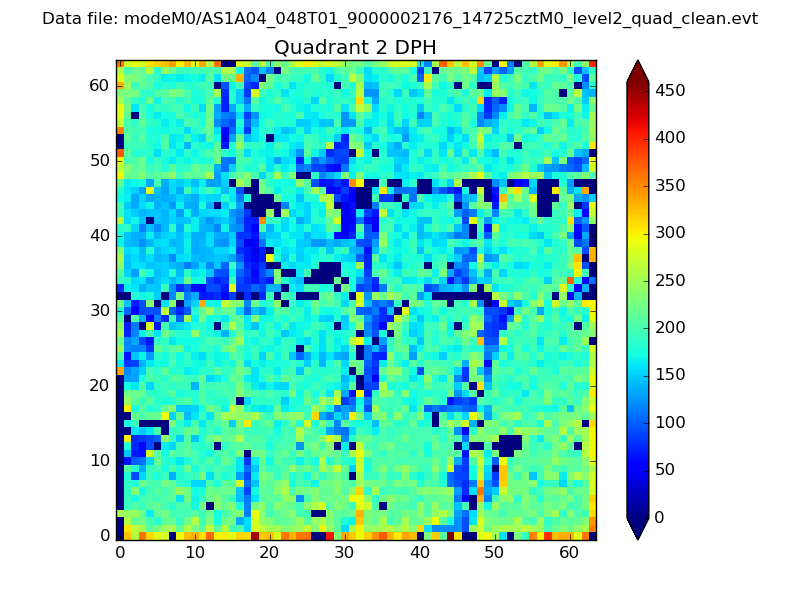 |
Quadrant C |
| Plot type | Count rate plots | Images |
|---|---|---|
| Comparison with Poisson distribution Blue bars denote a histogram of data divided into 1 sec bins. Red curve is a Poisson curve with rate = median count rate of data. |
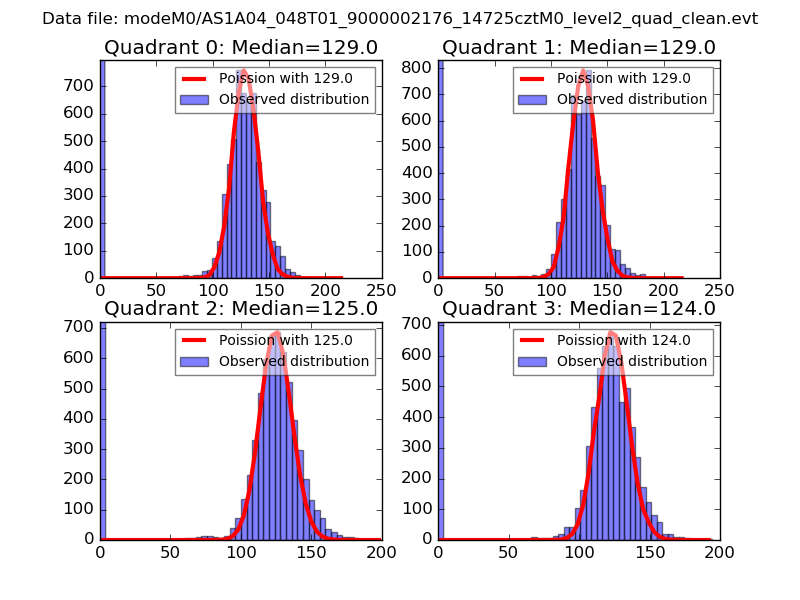 |
 |
| Quadrant-wise count rates Data is divided into 100 sec bins |
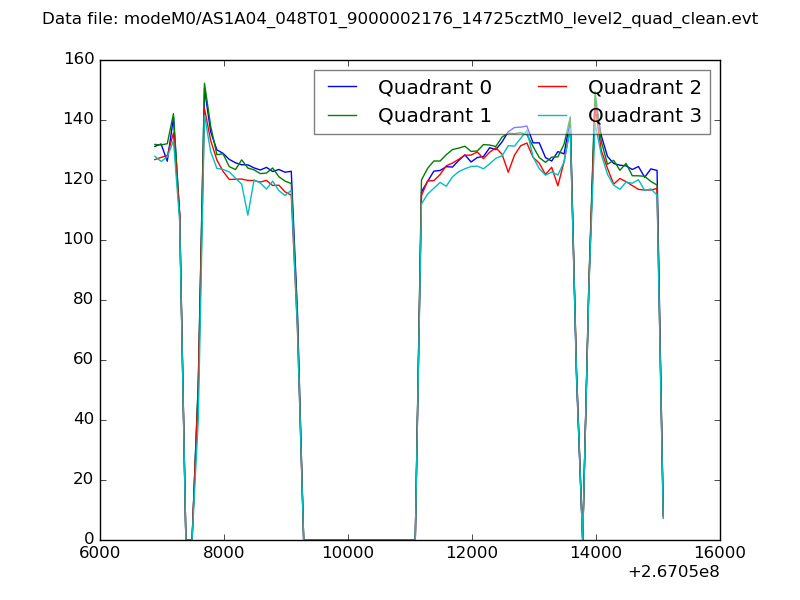 |
|
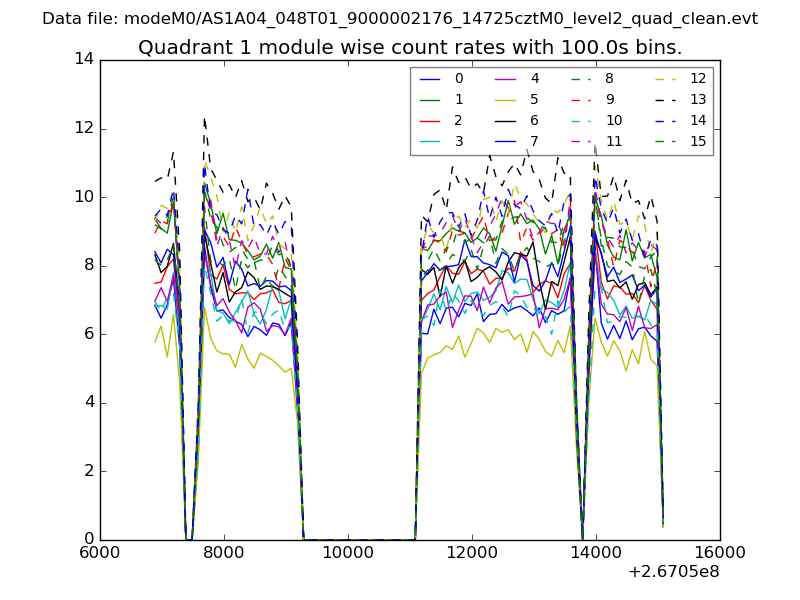
| Module-wise count rates for Quadrant A Data is divided into 100 sec bins |
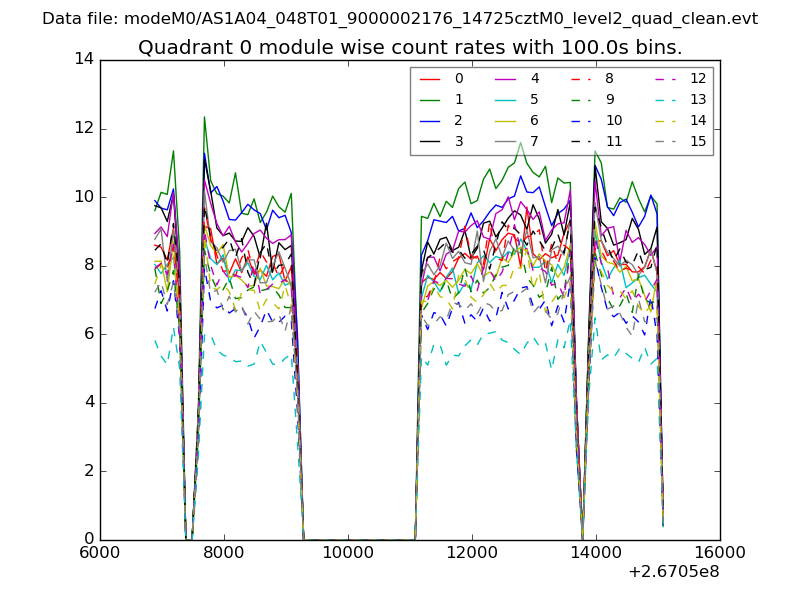 |
 |
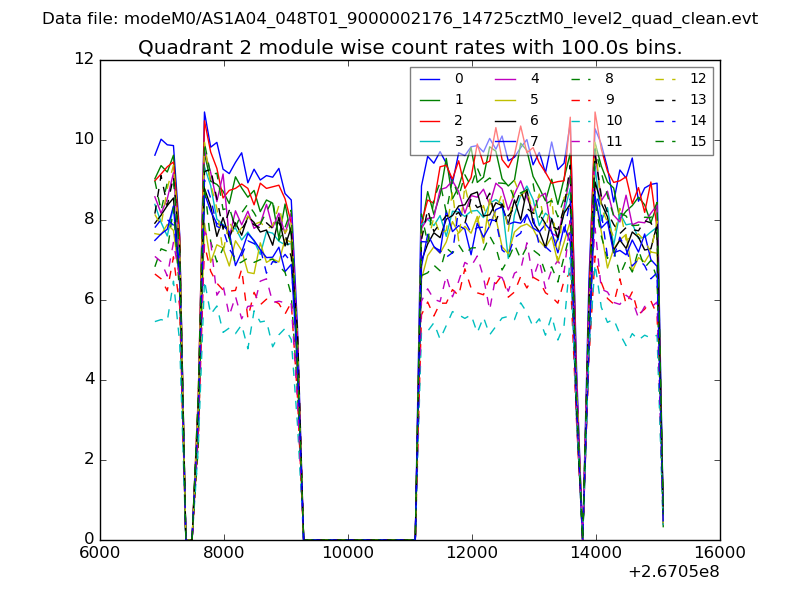
| Module-wise count rates for Quadrant B Data is divided into 100 sec bins |
 |
 |
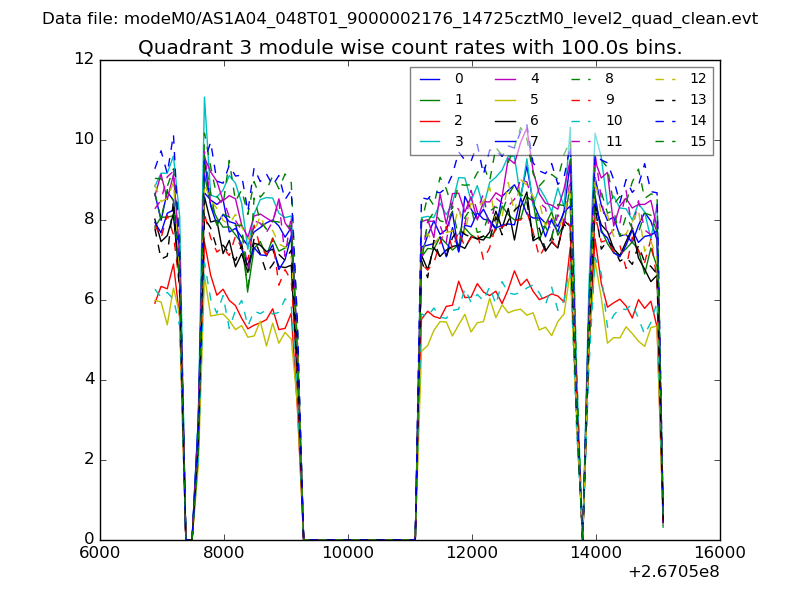
| Module-wise count rates for Quadrant C Data is divided into 100 sec bins |
 |
 |
| Module-wise count rates for Quadrant D Data is divided into 100 sec bins |
 |
 |
| Parameter | Plot |
|---|---|
| CZT HV Monitor | 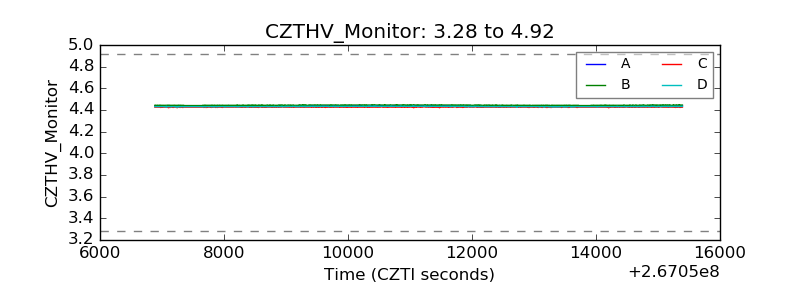 |
| D_VDD | 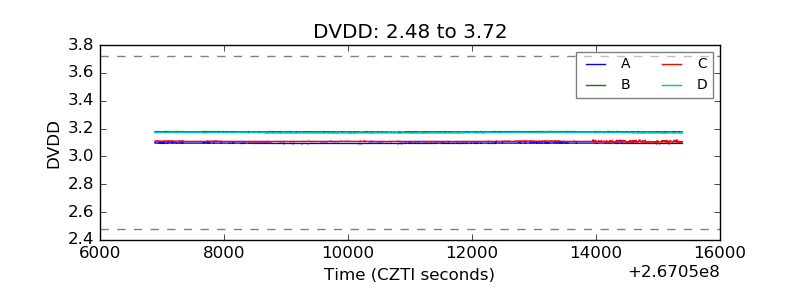 |
| Temperature 1 |  |
| Veto HV Monitor | 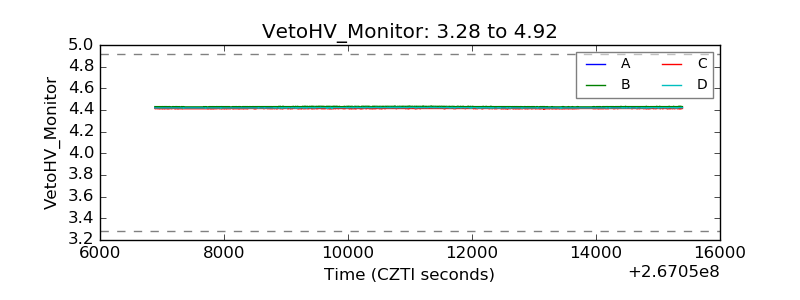 |
| Veto LLD | 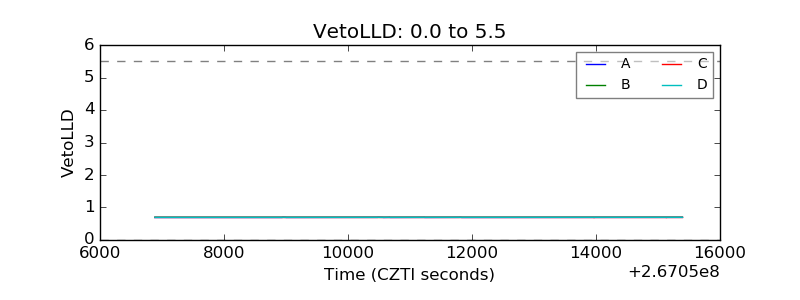 |
| Alpha Counter | 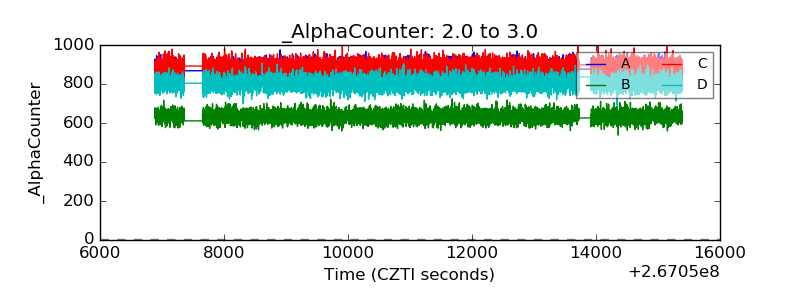 |
| _CPM_Rate | 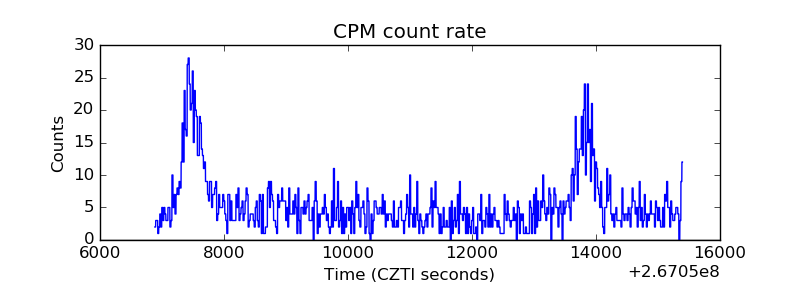 |
| CZT Counter | 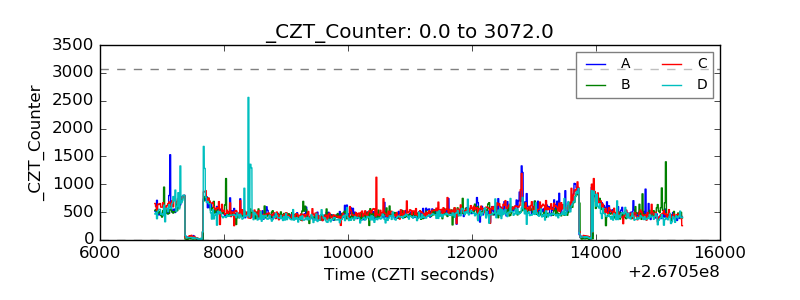 |
| +2.5 Volts monitor | 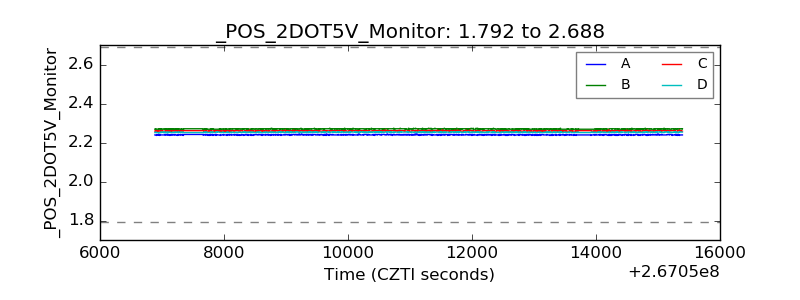 |
| +5 Volts monitor |  |
| _ROLL_ROT | 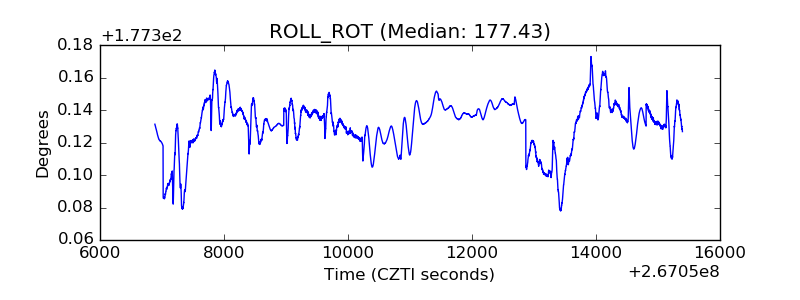 |
| _Roll_DEC | 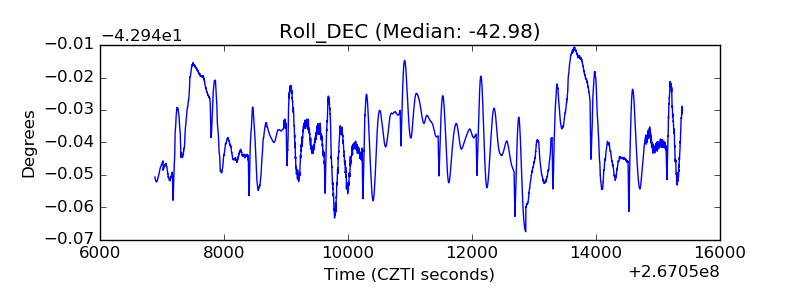 |
| _Roll_RA | 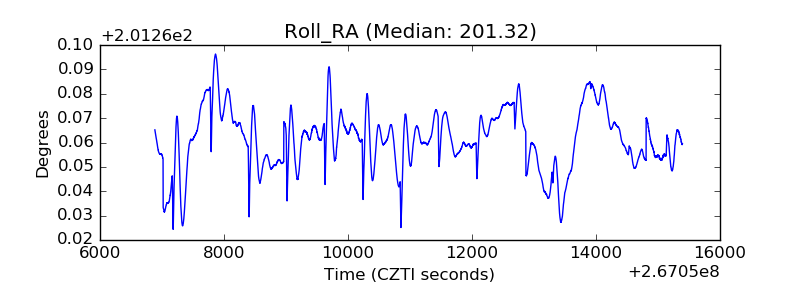 |
| Veto Counter | 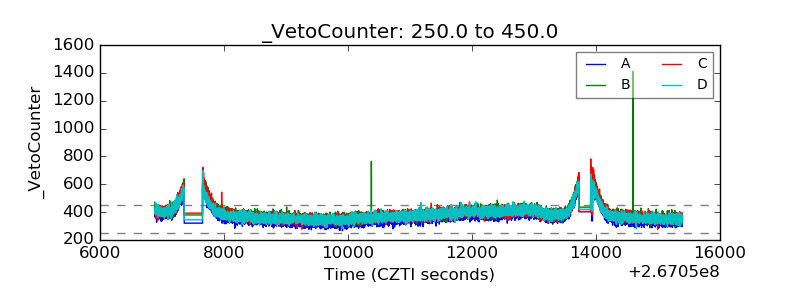 |