| Param | Original file | Final file |
|---|---|---|
| Filename | modeM0/AS1A04_048T01_9000002176_14726cztM0_level2.evt | modeM0/AS1A04_048T01_9000002176_14726cztM0_level2_quad_clean.evt |
| Size (bytes) | 421,032,960 | 79,067,520 |
| Size | 401.5 MB | 75.4 MB |
| Events in quadrant A | 3,024,289 | 503,978 |
| Events in quadrant B | 2,937,918 | 504,606 |
| Events in quadrant C | 3,252,862 | 489,415 |
| Events in quadrant D | 3,135,115 | 484,368 |
| Mode M9 | |||
|---|---|---|---|
| Quadrant | BADHDUFLAG | Total packets | Discarded packets |
| A | 0 | 2 | 0 |
| B | 0 | 2 | 0 |
| C | 0 | 2 | 0 |
| D | 0 | 2 | 0 |
| Mode M0 | |||
|---|---|---|---|
| Quadrant | BADHDUFLAG | Total packets | Discarded packets |
| A | 0 | 12912 | 1 |
| B | 0 | 12537 | 1 |
| C | 0 | 13321 | 1 |
| D | 0 | 13564 | 1 |
| Mode SS | |||
|---|---|---|---|
| Quadrant | BADHDUFLAG | Total packets | Discarded packets |
| A | 0 | 120 | 0 |
| B | 0 | 120 | 0 |
| C | 0 | 120 | 0 |
| D | 0 | 120 | 0 |
| Quadrant | Total seconds | Saturated seconds | Saturation percentage |
|---|---|---|---|
| A | 5895 | 79 | 1.340119% |
| B | 5895 | 86 | 1.458863% |
| C | 5895 | 114 | 1.933842% |
| D | 5895 | 65 | 1.102629% |
Noise dominated data is calculated using 1-second bins in cleaned event files. If a bin has >2000 counts, and if more than 50% of those come from <1% of pixels, then it is considered to be noise-dominated and hence unusable.
| Quadrant | # 1 sec bins | Bins with >0 counts | Bins with >2000 counts | High rate bins dominated by noise | Noise dominated (total time) | Noise dominated (detector-on time) | Marked lightcurve |
|---|---|---|---|---|---|---|---|
| A | 6101 | 5896 | 3 | 3 | 0.05% | 0.05% | 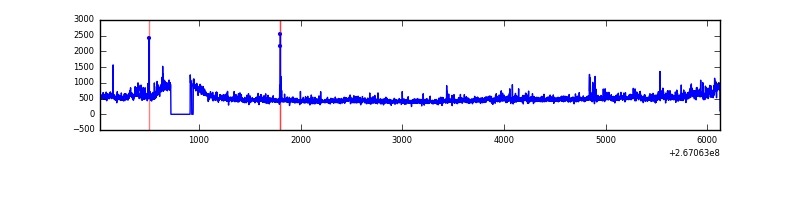 |
| B | 6101 | 5897 | 8 | 8 | 0.13% | 0.14% | 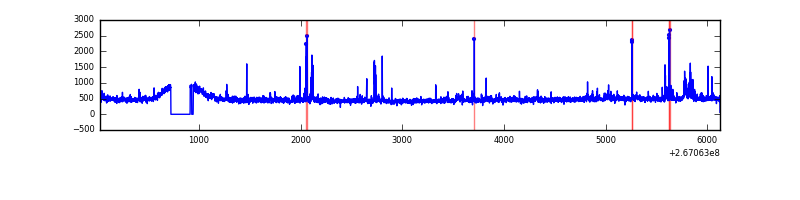 |
| C | 6101 | 5896 | 62 | 62 | 1.02% | 1.05% | 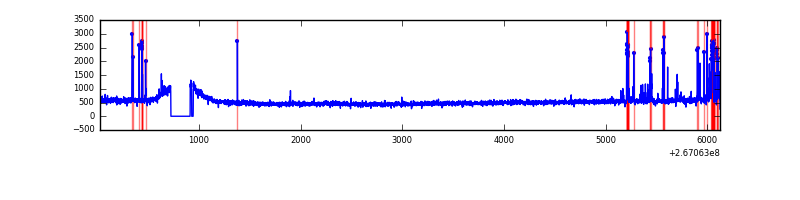 |
| D | 6101 | 5898 | 23 | 23 | 0.38% | 0.39% | 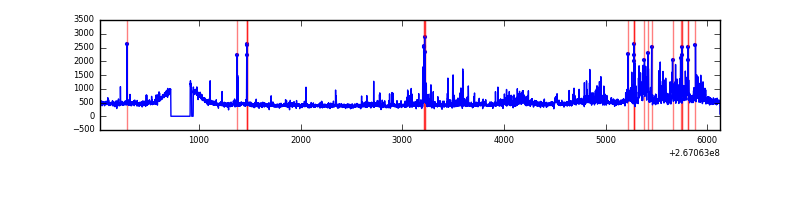 |
Top three noisy pixels from each quadrant. If the there are fewer than three noisy pixels in the level2.evt file, extra rows are filled as -1
| Pixel properties | Quadrant properties | ||||||
|---|---|---|---|---|---|---|---|
| Quadrant | DetID | PixID | Counts | Sigma | Mean | Median | Sigma |
| A | 8 | 15 | 185429 | 1279.73 | 703 | 687 | 144.4 |
| A | 12 | 189 | 93364 | 641.99 | 703 | 687 | 144.4 |
| A | 9 | 143 | 18254 | 121.69 | 703 | 687 | 144.4 |
| B | 0 | 229 | 63673 | 459.92 | 701 | 682 | 137.0 |
| B | 0 | 205 | 35987 | 257.78 | 701 | 682 | 137.0 |
| B | 4 | 142 | 25277 | 179.58 | 701 | 682 | 137.0 |
| C | 3 | 233 | 377891 | 2398.81 | 673 | 675 | 157.3 |
| C | 0 | 207 | 224391 | 1422.66 | 673 | 675 | 157.3 |
| C | 8 | 128 | 9530 | 56.31 | 673 | 675 | 157.3 |
| D | 12 | 16 | 478039 | 2647.41 | 675 | 658 | 180.3 |
| D | 2 | 152 | 38925 | 212.22 | 675 | 658 | 180.3 |
| D | 2 | 234 | 23386 | 126.04 | 675 | 658 | 180.3 |
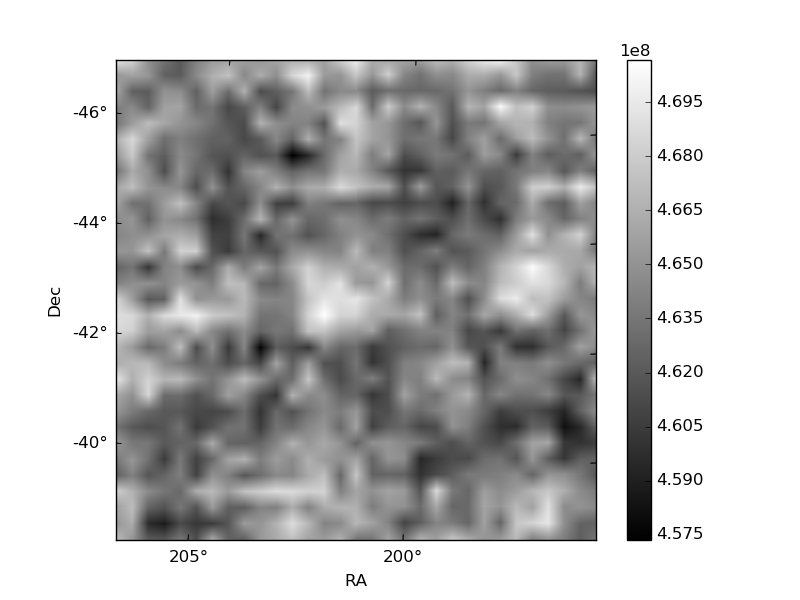
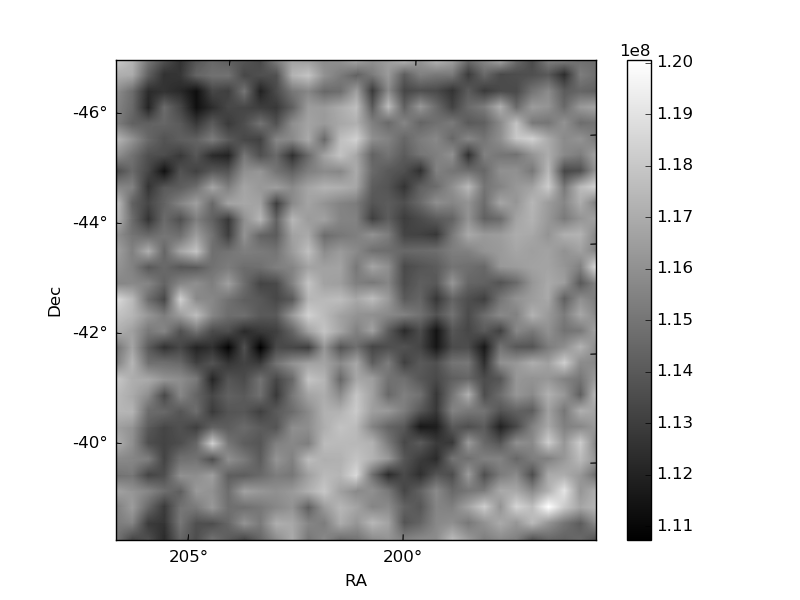
Histogram calculated using DETX and DETY for each event in the final _common_clean file
| Quadrant A | 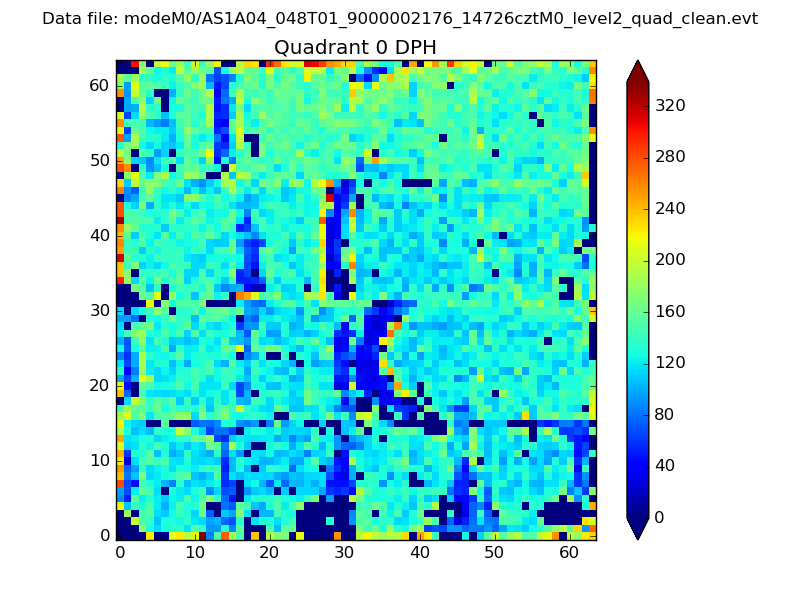 |
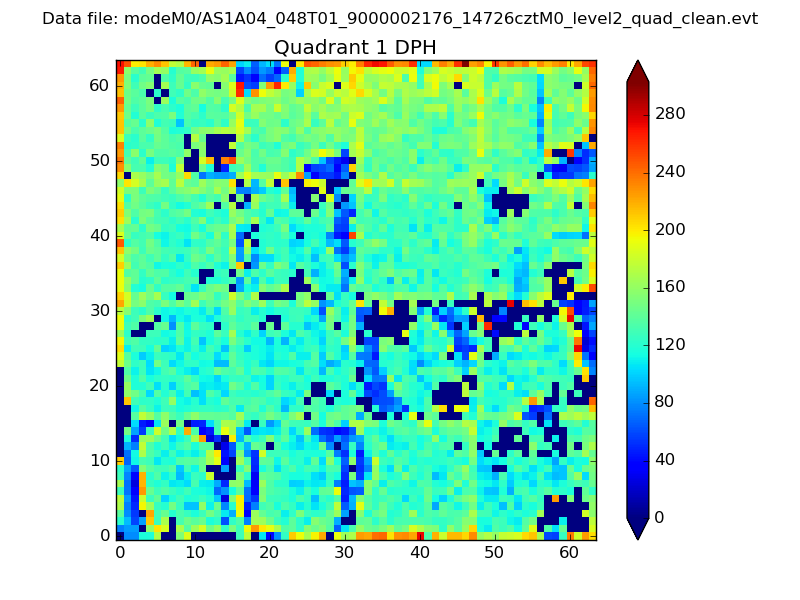 |
Quadrant B |
|---|---|---|---|
| Quadrant D | 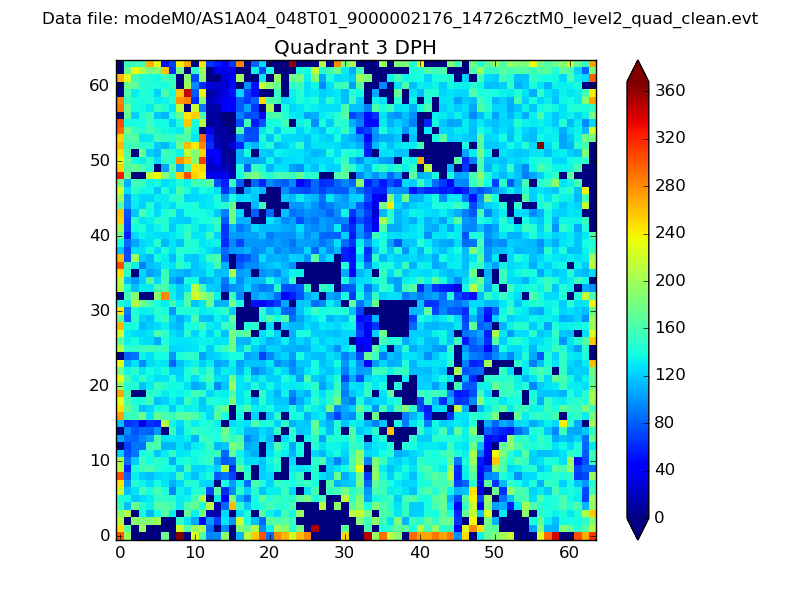 |
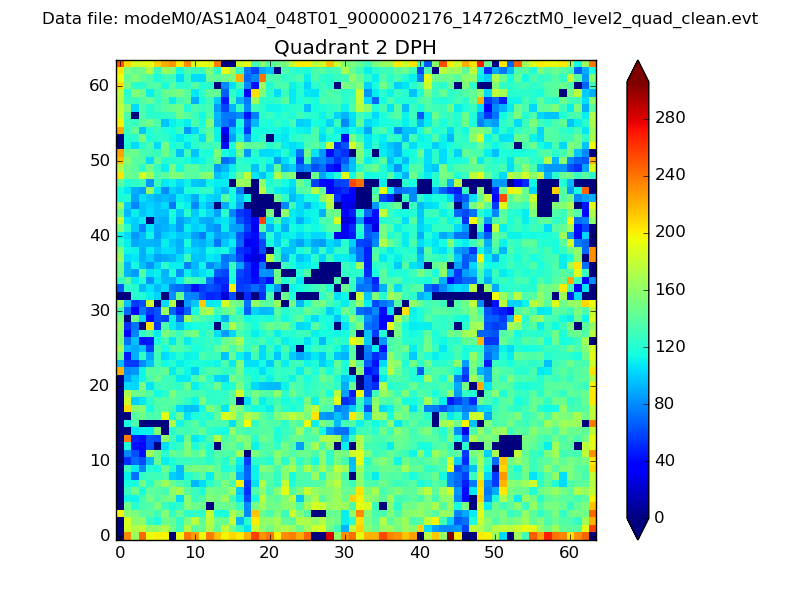 |
Quadrant C |
| Plot type | Count rate plots | Images |
|---|---|---|
| Comparison with Poisson distribution Blue bars denote a histogram of data divided into 1 sec bins. Red curve is a Poisson curve with rate = median count rate of data. |
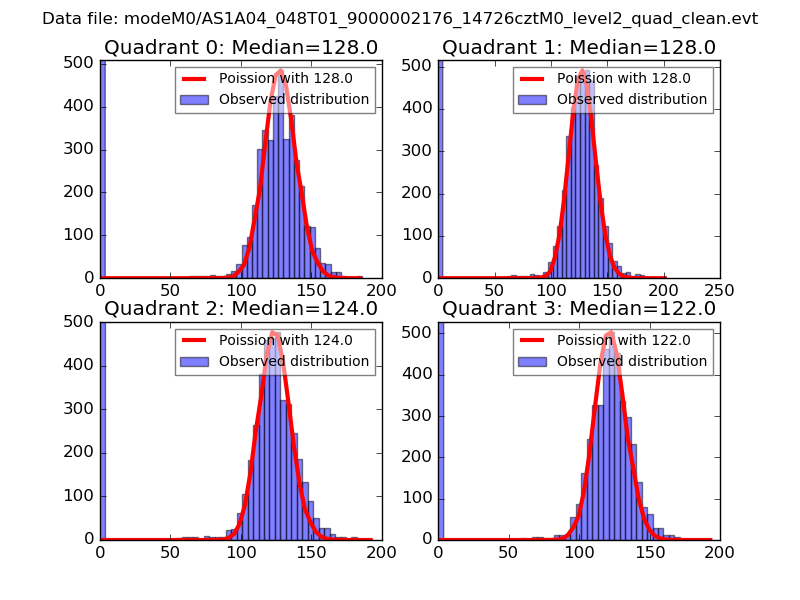 |
 |
| Quadrant-wise count rates Data is divided into 100 sec bins |
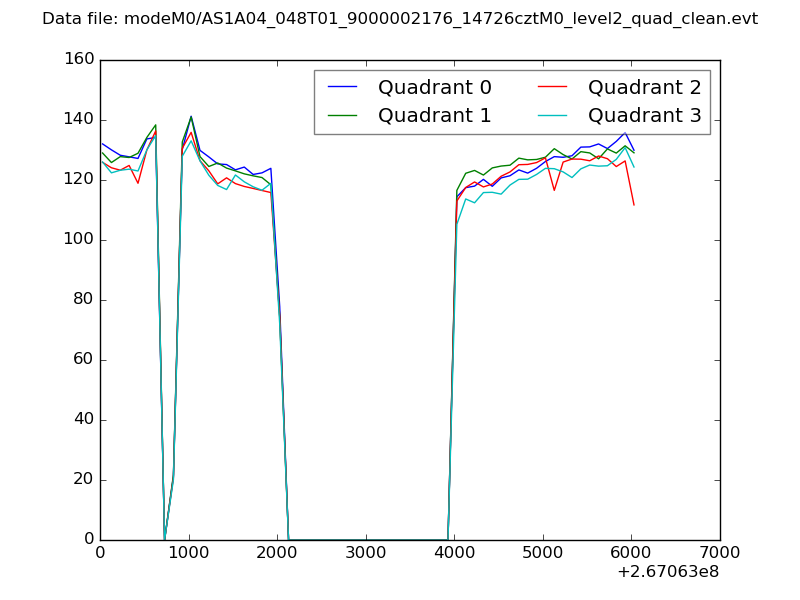 |
|
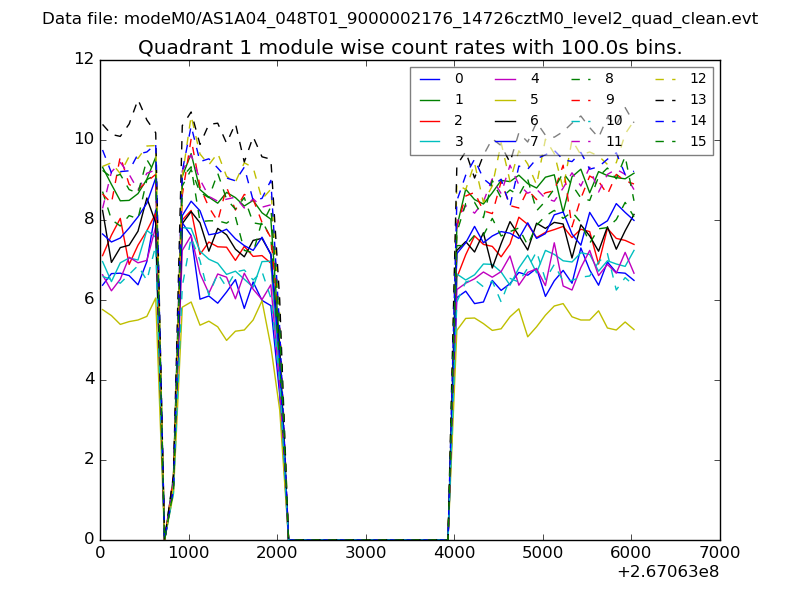
| Module-wise count rates for Quadrant A Data is divided into 100 sec bins |
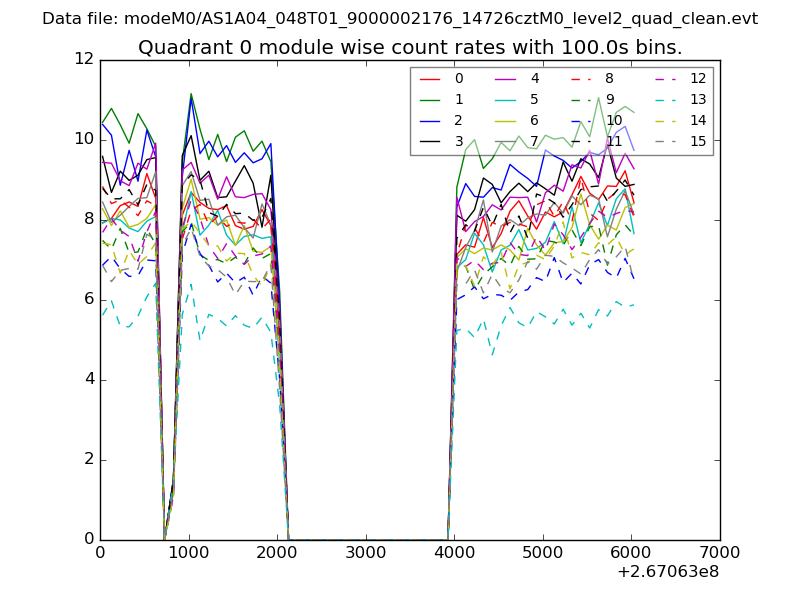 |
 |
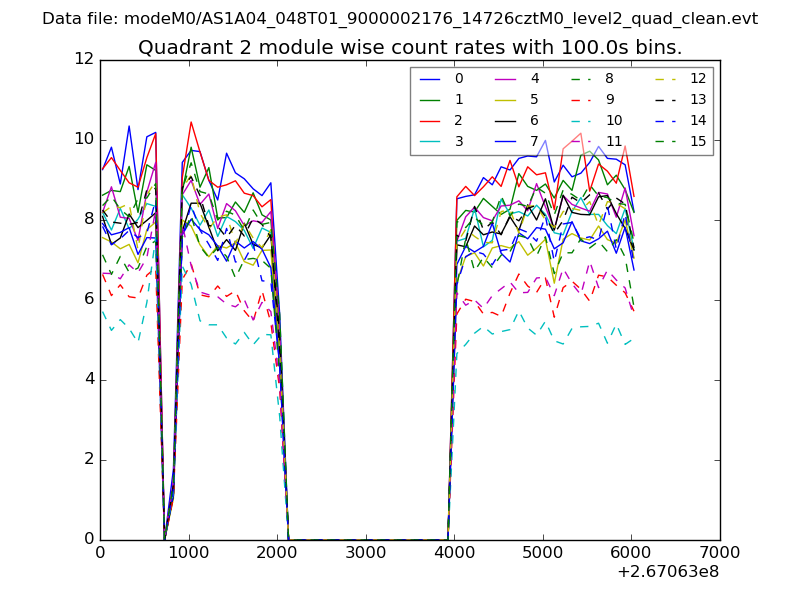
| Module-wise count rates for Quadrant B Data is divided into 100 sec bins |
 |
 |
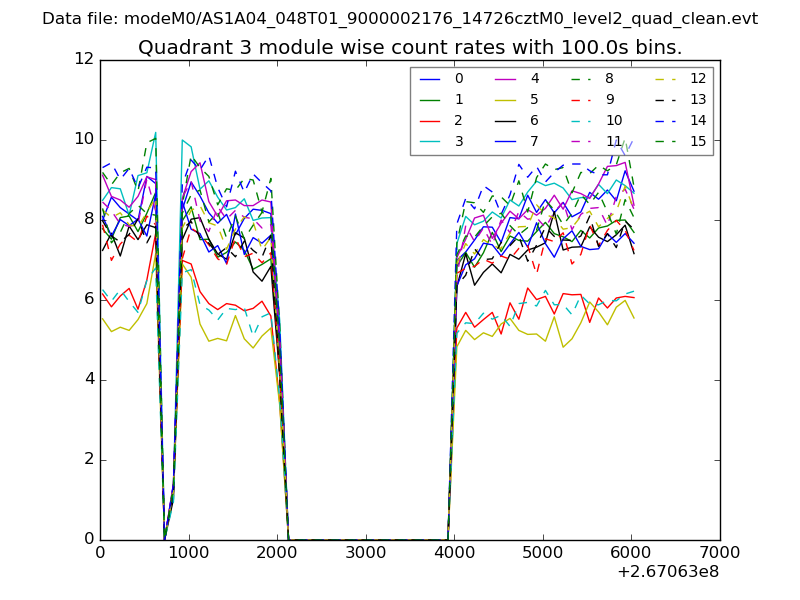
| Module-wise count rates for Quadrant C Data is divided into 100 sec bins |
 |
 |
| Module-wise count rates for Quadrant D Data is divided into 100 sec bins |
 |
 |
| Parameter | Plot |
|---|---|
| CZT HV Monitor | 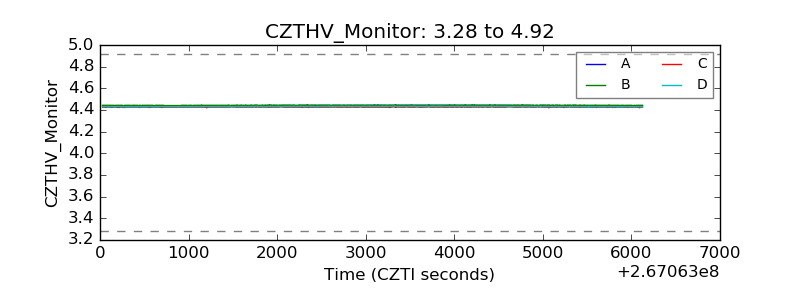 |
| D_VDD | 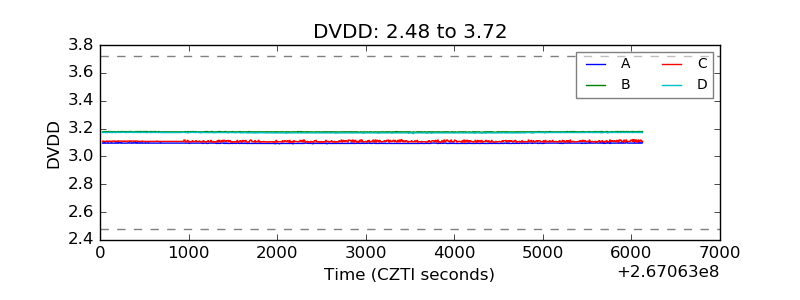 |
| Temperature 1 | 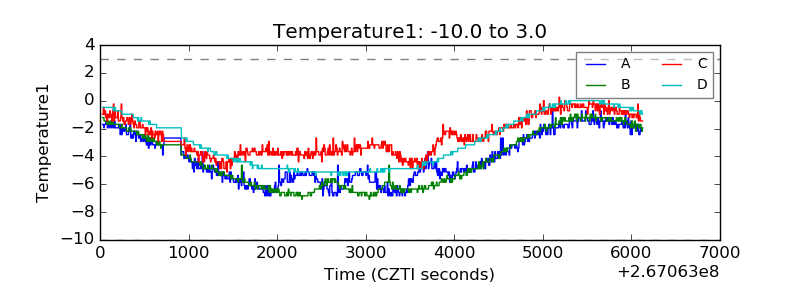 |
| Veto HV Monitor | 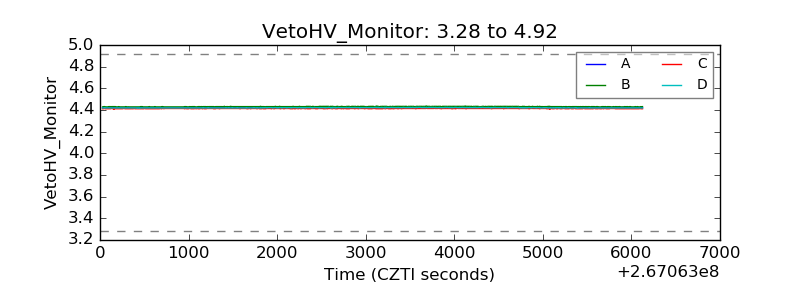 |
| Veto LLD | 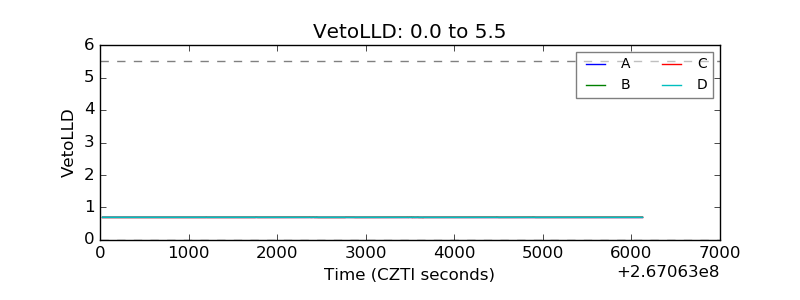 |
| Alpha Counter | 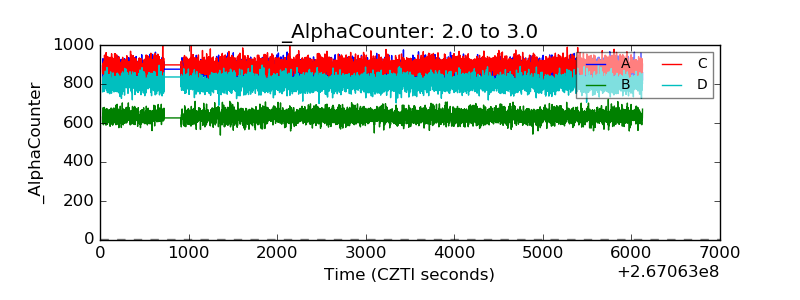 |
| _CPM_Rate | 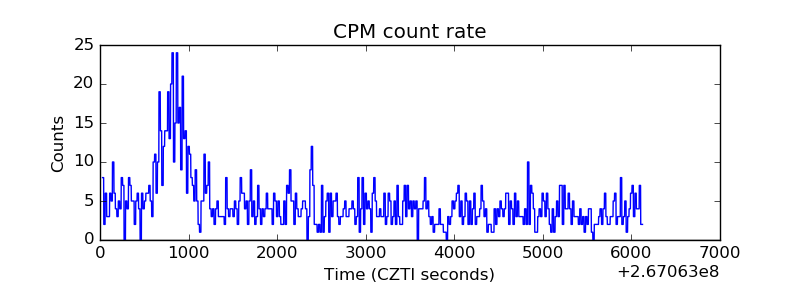 |
| CZT Counter | 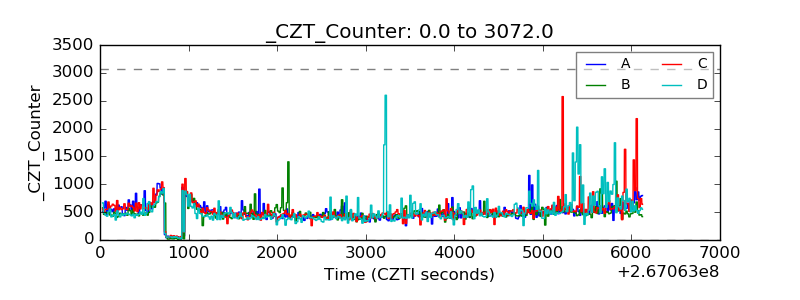 |
| +2.5 Volts monitor | 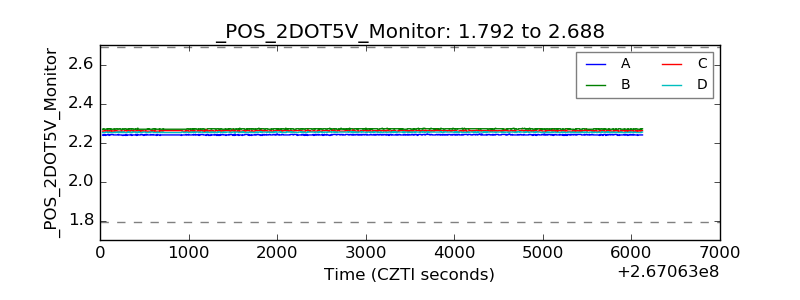 |
| +5 Volts monitor |  |
| _ROLL_ROT | 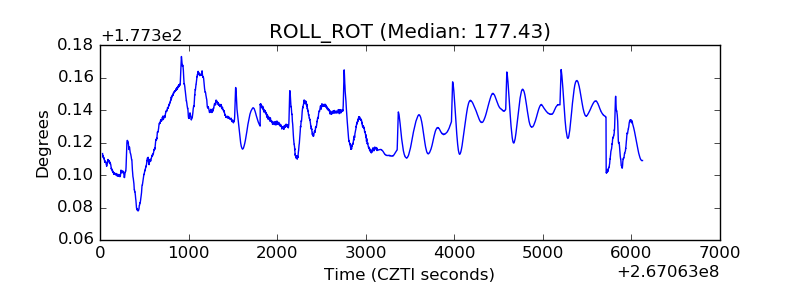 |
| _Roll_DEC | 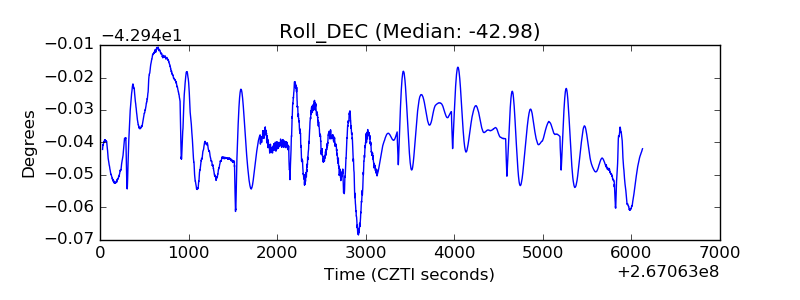 |
| _Roll_RA |  |
| Veto Counter | 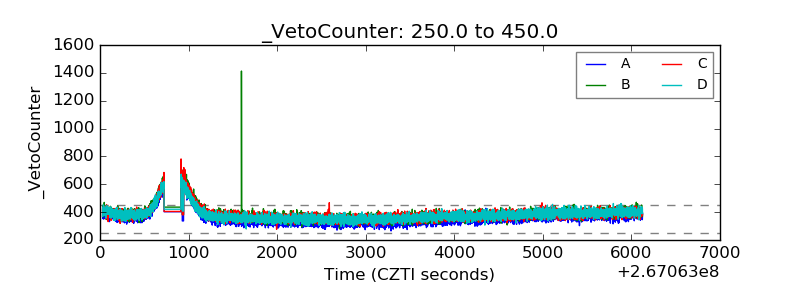 |