| Param | Original file | Final file |
|---|---|---|
| Filename | modeM0/AS1A04_203T01_9000002180cztM0_level2.fits | modeM0/AS1A04_203T01_9000002180cztM0_level2_quad_clean.evt |
| Size (bytes) | 805,812,480 | 704,162,880 |
| Size | 768.5 MB | 671.5 MB |
| Events in quadrant A | 4,493,044 | 3,520,523 |
| Events in quadrant B | 4,807,362 | 4,227,748 |
| Events in quadrant C | 4,907,860 | 3,997,272 |
| Events in quadrant D | 4,390,330 | 3,784,208 |
| Mode M0 | |||
|---|---|---|---|
| Quadrant | BADHDUFLAG | Total packets | Discarded packets |
| A | 0 | 408495 | 0 |
| B | 0 | 193424 | 0 |
| C | 0 | 202889 | 0 |
| D | 0 | 178000 | 0 |
| Mode SS | |||
|---|---|---|---|
| Quadrant | BADHDUFLAG | Total packets | Discarded packets |
| A | 0 | 1720 | 0 |
| B | 0 | 1720 | 0 |
| C | 0 | 1720 | 0 |
| D | 0 | 1720 | 0 |
| Mode M9 | |||
|---|---|---|---|
| Quadrant | BADHDUFLAG | Total packets | Discarded packets |
| A | 0 | 121 | 0 |
| B | 0 | 121 | 0 |
| C | 0 | 121 | 0 |
| D | 0 | 121 | 0 |
| Quadrant | Total seconds | Saturated seconds | Saturation percentage |
|---|---|---|---|
| A | 84517 | 23685 | 28.023948% |
| B | 84517 | 2594 | 3.069205% |
| C | 84517 | 1390 | 1.644640% |
| D | 84517 | 850 | 1.005715% |
Noise dominated data is calculated using 1-second bins in cleaned event files. If a bin has >2000 counts, and if more than 50% of those come from <1% of pixels, then it is considered to be noise-dominated and hence unusable.
| Quadrant | # 1 sec bins | Bins with >0 counts | Bins with >2000 counts | High rate bins dominated by noise | Noise dominated (total time) | Noise dominated (detector-on time) | Marked lightcurve |
|---|---|---|---|---|---|---|---|
| A | 96642 | 84497 | 0 | 0 | 0.00% | 0.00% |  |
| B | 96642 | 84494 | 0 | 0 | 0.00% | 0.00% | 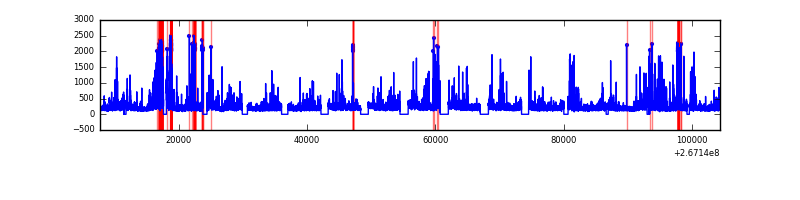 |
| C | 96642 | 84495 | 0 | 0 | 0.00% | 0.00% | 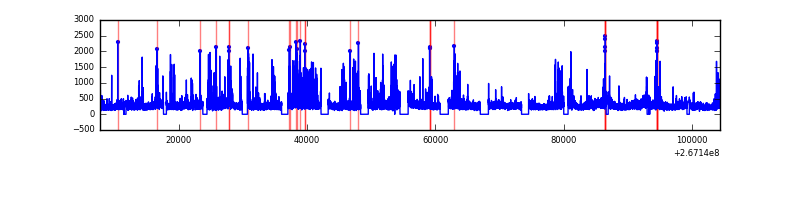 |
| D | 96642 | 84503 | 0 | 0 | 0.00% | 0.00% | 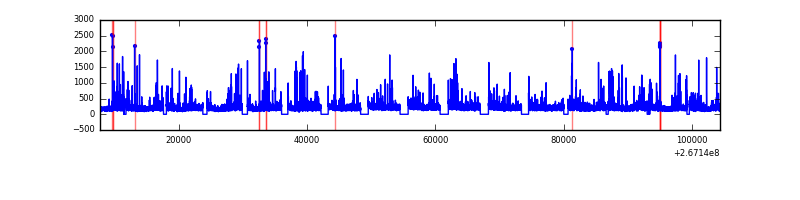 |
Top three noisy pixels from each quadrant. If the there are fewer than three noisy pixels in the level2.evt file, extra rows are filled as -1
| Pixel properties | Quadrant properties | ||||||
|---|---|---|---|---|---|---|---|
| Quadrant | DetID | PixID | Counts | Sigma | Mean | Median | Sigma |
| A | 0 | 29 | 4314 | 11.09 | 1170 | 1096 | 290.0 |
| A | 7 | 110 | 3677 | 8.9 | 1170 | 1096 | 290.0 |
| A | 9 | 19 | 3297 | 7.59 | 1170 | 1096 | 290.0 |
| B | 2 | 9 | 4195 | 11.92 | 1269 | 1210 | 250.4 |
| B | 3 | 17 | 3205 | 7.97 | 1269 | 1210 | 250.4 |
| B | 3 | 80 | 3183 | 7.88 | 1269 | 1210 | 250.4 |
| C | 3 | 126 | 3332 | 6.43 | 1296 | 1204 | 330.8 |
| C | 12 | 241 | 3311 | 6.37 | 1296 | 1204 | 330.8 |
| C | 2 | 191 | 3275 | 6.26 | 1296 | 1204 | 330.8 |
| D | 3 | 14 | 3231 | 6.2 | 1254 | 1140 | 337.0 |
| D | 6 | 231 | 3153 | 5.97 | 1254 | 1140 | 337.0 |
| D | 10 | 189 | 3110 | 5.85 | 1254 | 1140 | 337.0 |
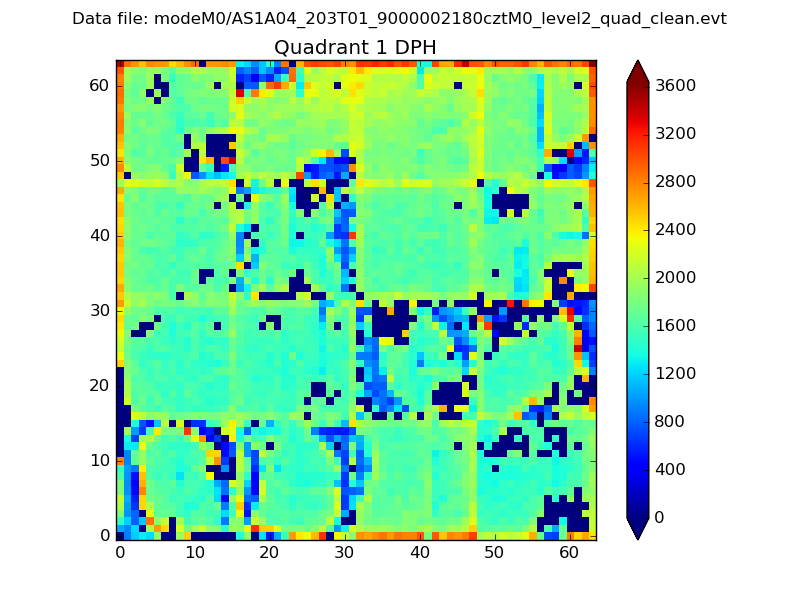
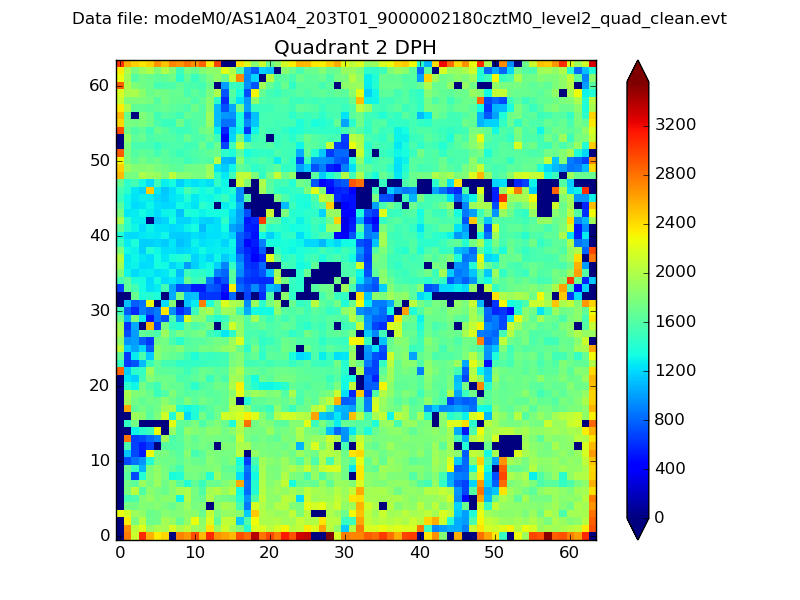
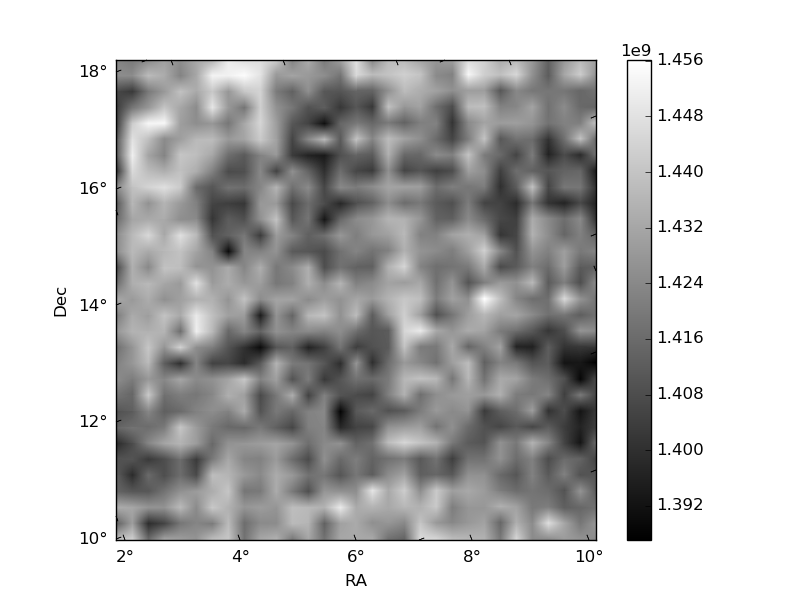
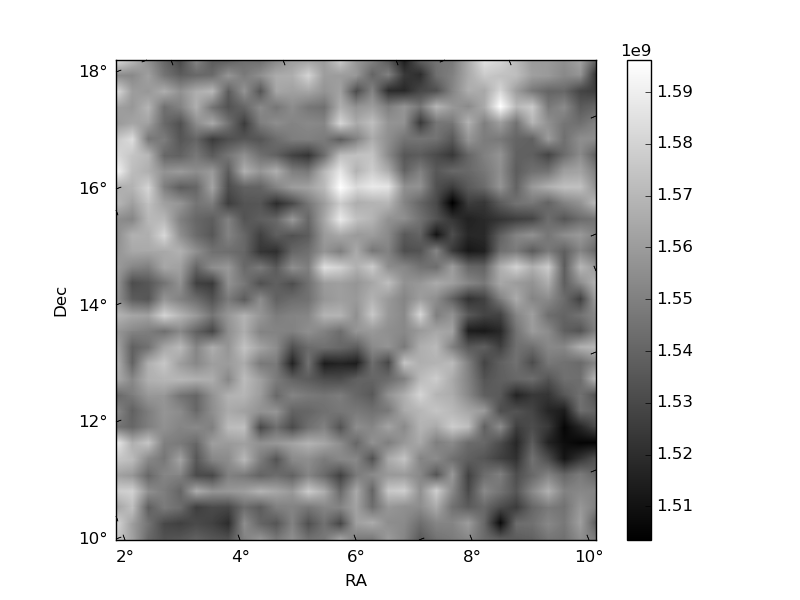
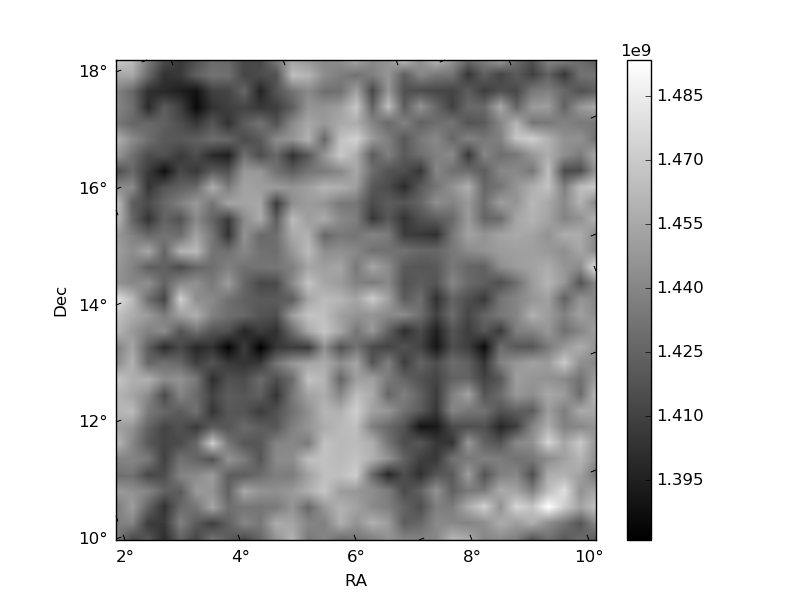
Histogram calculated using DETX and DETY for each event in the final _common_clean file
| Quadrant A | 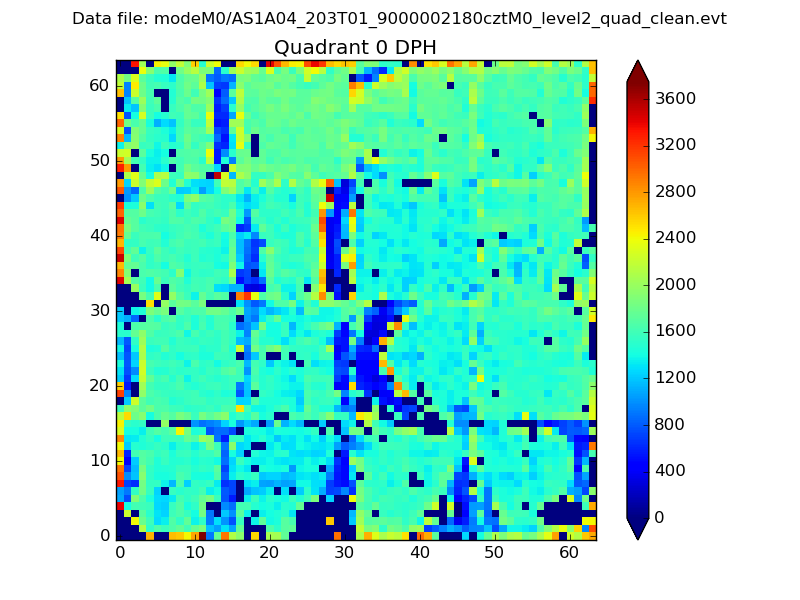 |
 |
Quadrant B |
|---|---|---|---|
| Quadrant D | 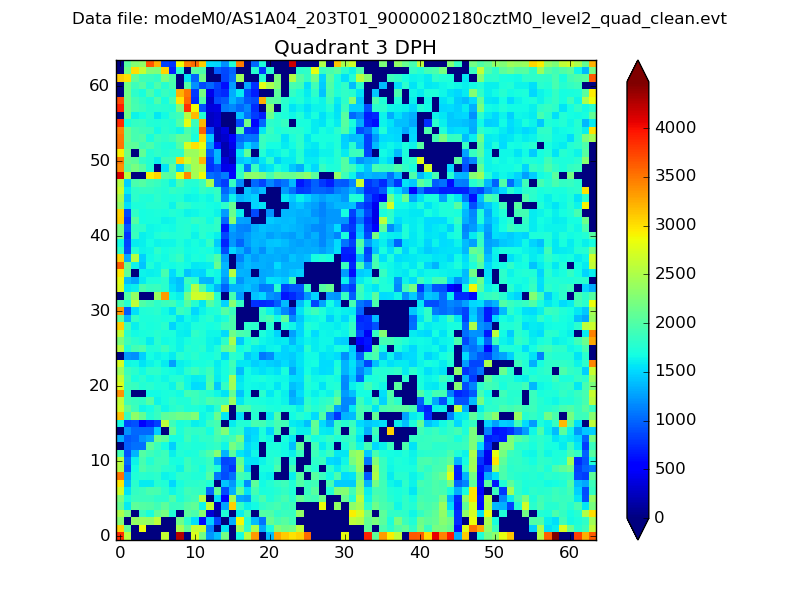 |
 |
Quadrant C |
| Plot type | Count rate plots | Images |
|---|---|---|
| Comparison with Poisson distribution Blue bars denote a histogram of data divided into 1 sec bins. Red curve is a Poisson curve with rate = median count rate of data. |
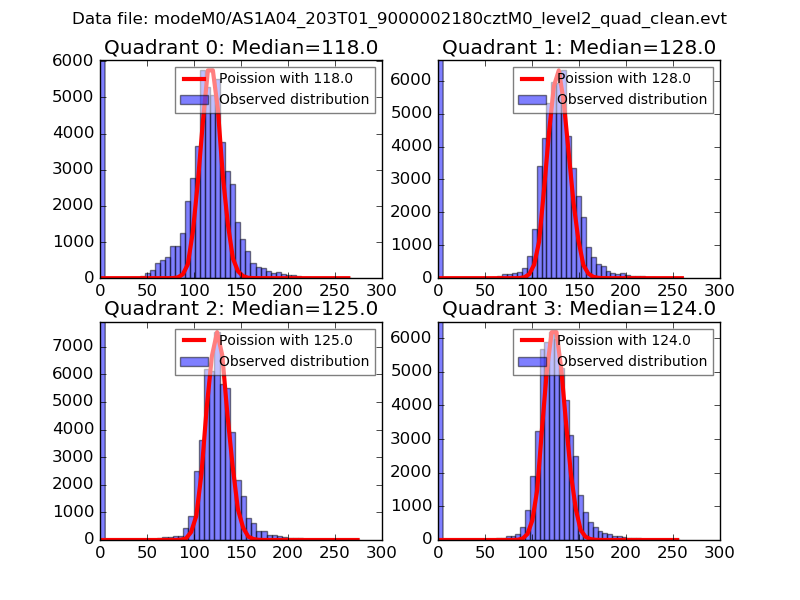 |
 |
| Quadrant-wise count rates Data is divided into 100 sec bins |
 |
|
| Module-wise count rates for Quadrant A Data is divided into 100 sec bins |
 |
 |
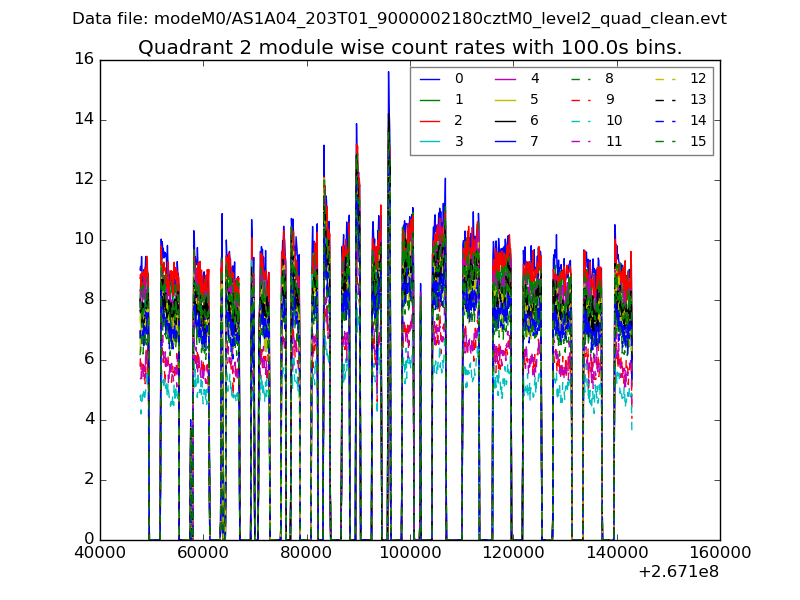
| Module-wise count rates for Quadrant B Data is divided into 100 sec bins |
 |
 |
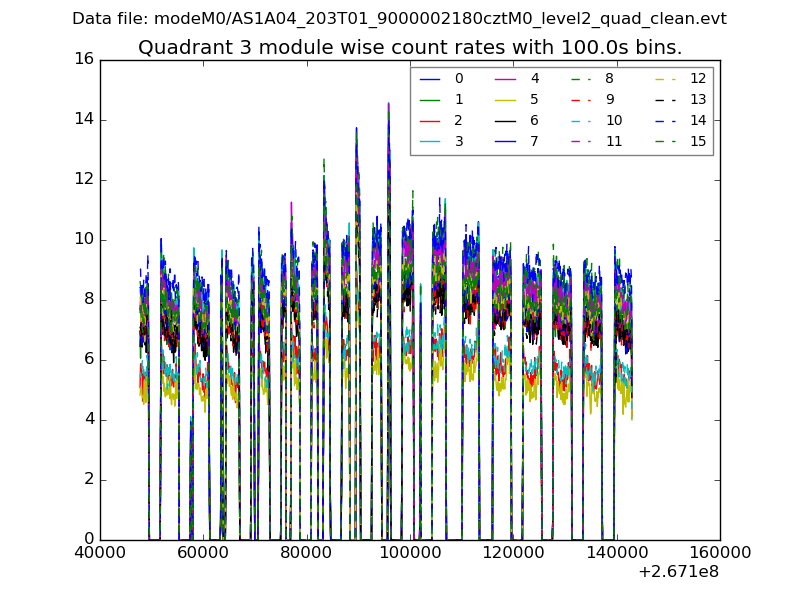
| Module-wise count rates for Quadrant C Data is divided into 100 sec bins |
 |
 |
| Module-wise count rates for Quadrant D Data is divided into 100 sec bins |
 |
 |
| Parameter | Plot |
|---|---|
| CZT HV Monitor | 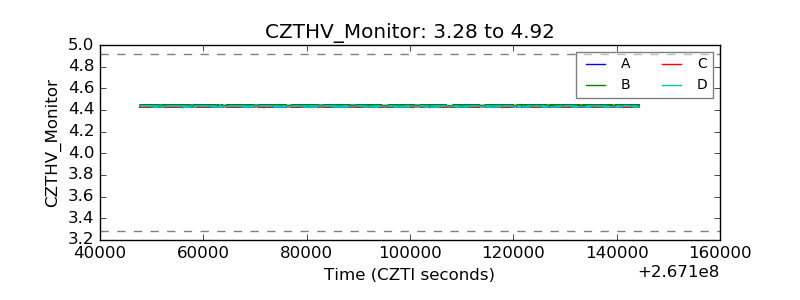 |
| D_VDD |  |
| Temperature 1 | 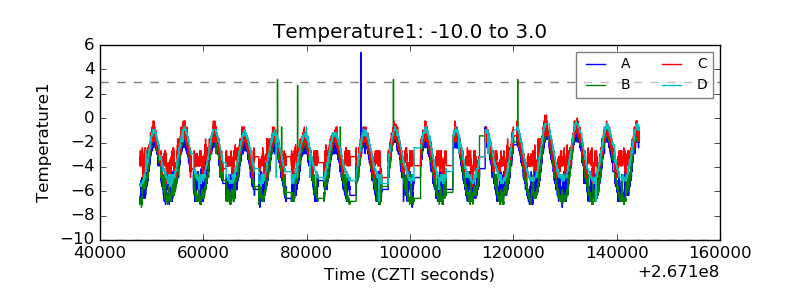 |
| Veto HV Monitor | 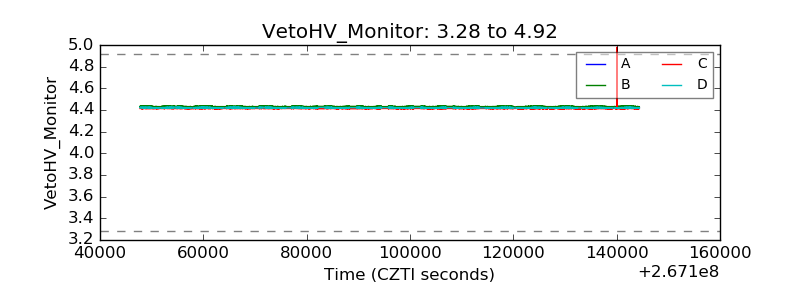 |
| Veto LLD | 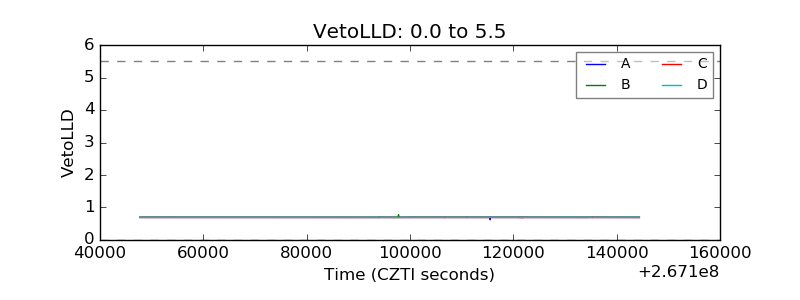 |
| Alpha Counter |  |
| _CPM_Rate | 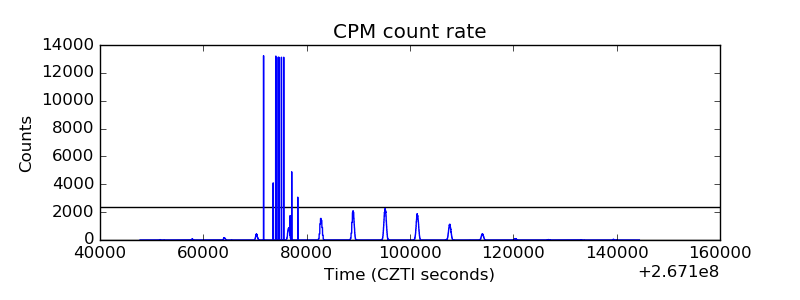 |
| CZT Counter | 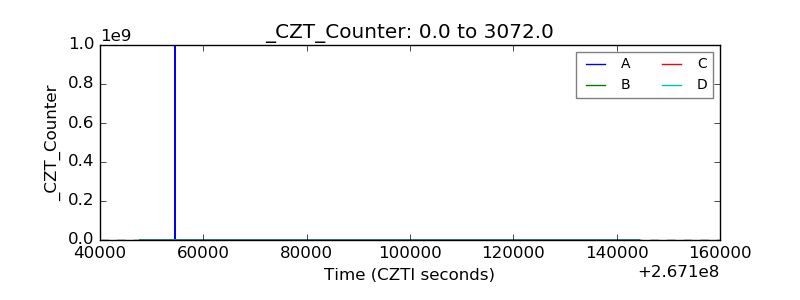 |
| +2.5 Volts monitor | 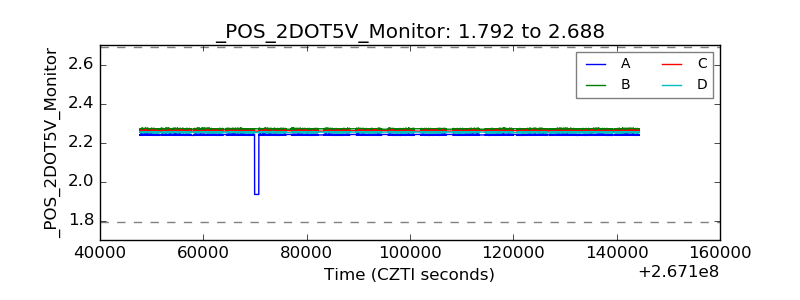 |
| +5 Volts monitor | 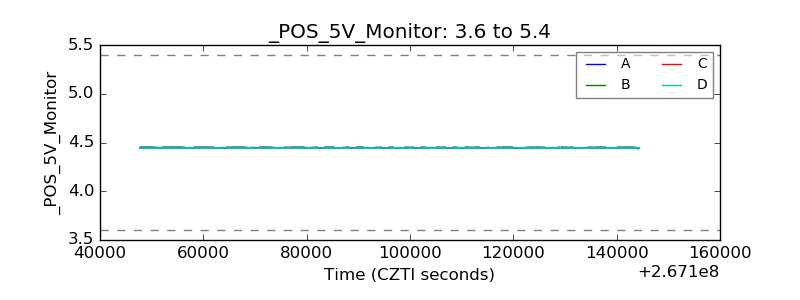 |
| _ROLL_ROT | 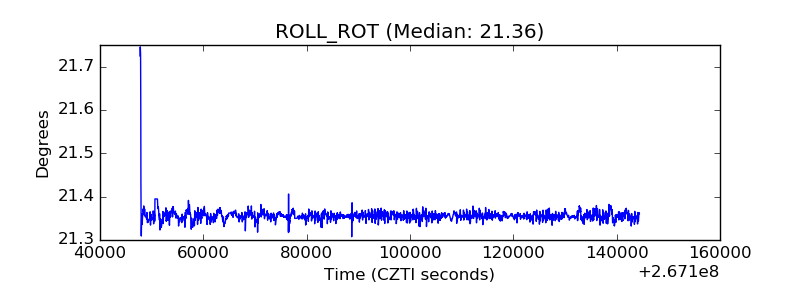 |
| _Roll_DEC | 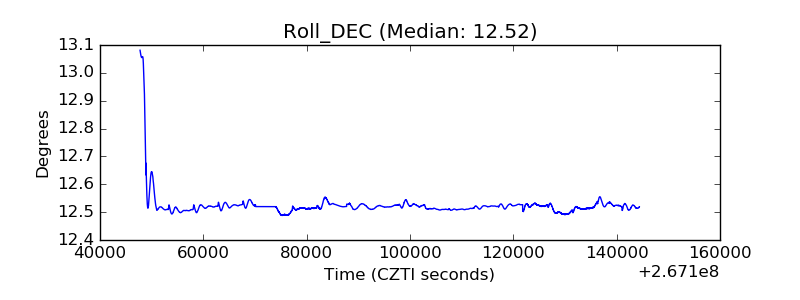 |
| _Roll_RA | 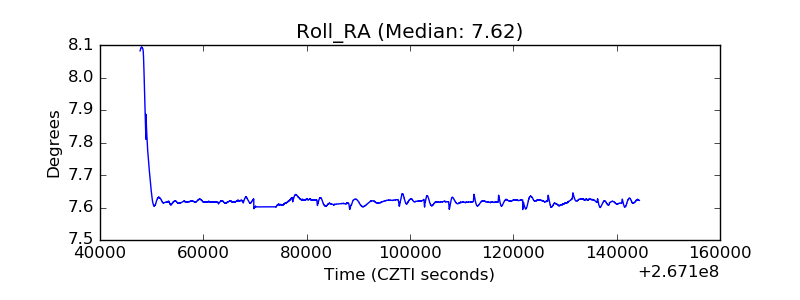 |
| Veto Counter |  |