| Param | Original file | Final file |
|---|---|---|
| Filename | modeM0/AS1A04_203T01_9000002180_14740cztM0_level2.evt | modeM0/AS1A04_203T01_9000002180_14740cztM0_level2_quad_clean.evt |
| Size (bytes) | 598,896,000 | 63,290,880 |
| Size | 571.2 MB | 60.4 MB |
| Events in quadrant A | 9,667,918 | 339,722 |
| Events in quadrant B | 2,754,032 | 408,501 |
| Events in quadrant C | 2,879,803 | 401,466 |
| Events in quadrant D | 2,476,370 | 394,638 |
| Mode M0 | |||
|---|---|---|---|
| Quadrant | BADHDUFLAG | Total packets | Discarded packets |
| A | 0 | 32392 | 3 |
| B | 0 | 11727 | 2 |
| C | 0 | 11917 | 2 |
| D | 0 | 11167 | 2 |
| Mode SS | |||
|---|---|---|---|
| Quadrant | BADHDUFLAG | Total packets | Discarded packets |
| A | 0 | 108 | 0 |
| B | 0 | 108 | 0 |
| C | 0 | 108 | 0 |
| D | 0 | 108 | 0 |
| Mode M9 | |||
|---|---|---|---|
| Quadrant | BADHDUFLAG | Total packets | Discarded packets |
| A | 0 | 3 | 0 |
| B | 0 | 3 | 0 |
| C | 0 | 3 | 0 |
| D | 0 | 3 | 0 |
| Quadrant | Total seconds | Saturated seconds | Saturation percentage |
|---|---|---|---|
| A | 5303 | 2827 | 53.309447% |
| B | 5303 | 75 | 1.414294% |
| C | 5303 | 29 | 0.546860% |
| D | 5303 | 43 | 0.810862% |
Noise dominated data is calculated using 1-second bins in cleaned event files. If a bin has >2000 counts, and if more than 50% of those come from <1% of pixels, then it is considered to be noise-dominated and hence unusable.
| Quadrant | # 1 sec bins | Bins with >0 counts | Bins with >2000 counts | High rate bins dominated by noise | Noise dominated (total time) | Noise dominated (detector-on time) | Marked lightcurve |
|---|---|---|---|---|---|---|---|
| A | 5634 | 5304 | 2472 | 2472 | 43.88% | 46.61% | 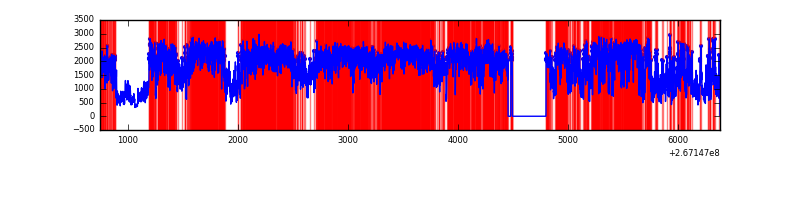 |
| B | 5634 | 5305 | 5 | 5 | 0.09% | 0.09% | 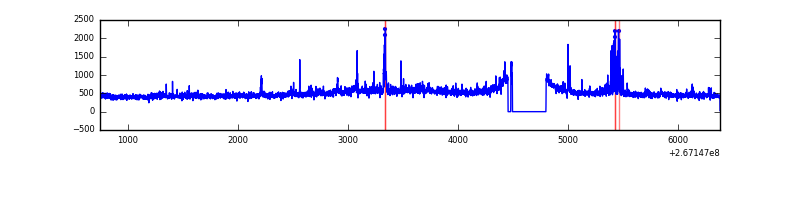 |
| C | 5634 | 5304 | 1 | 1 | 0.02% | 0.02% | 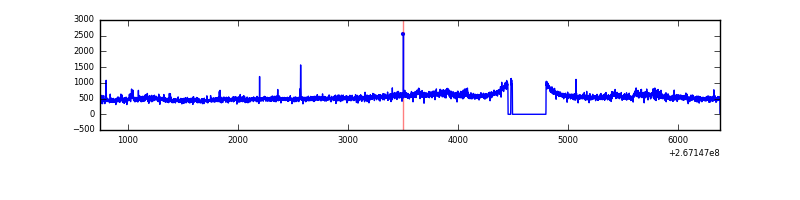 |
| D | 5634 | 5306 | 13 | 13 | 0.23% | 0.25% | 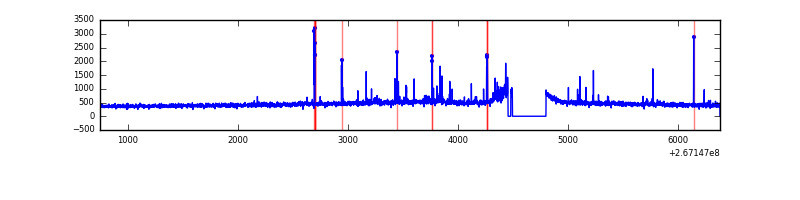 |
Top three noisy pixels from each quadrant. If the there are fewer than three noisy pixels in the level2.evt file, extra rows are filled as -1
| Pixel properties | Quadrant properties | ||||||
|---|---|---|---|---|---|---|---|
| Quadrant | DetID | PixID | Counts | Sigma | Mean | Median | Sigma |
| A | 8 | 15 | 7521315 | 67237.41 | 541 | 529 | 111.9 |
| A | 12 | 189 | 46668 | 412.49 | 541 | 529 | 111.9 |
| A | 9 | 143 | 9928 | 84.03 | 541 | 529 | 111.9 |
| B | 0 | 205 | 74343 | 595.42 | 642 | 625 | 123.8 |
| B | 0 | 189 | 40389 | 321.18 | 642 | 625 | 123.8 |
| B | 0 | 228 | 30832 | 243.98 | 642 | 625 | 123.8 |
| C | 3 | 233 | 430200 | 2939.45 | 621 | 624 | 146.1 |
| C | 14 | 220 | 11394 | 73.7 | 621 | 624 | 146.1 |
| C | 4 | 254 | 8676 | 55.1 | 621 | 624 | 146.1 |
| D | 2 | 33 | 30879 | 198.29 | 618 | 602 | 152.7 |
| D | 2 | 234 | 27123 | 173.69 | 618 | 602 | 152.7 |
| D | 2 | 120 | 21347 | 135.86 | 618 | 602 | 152.7 |
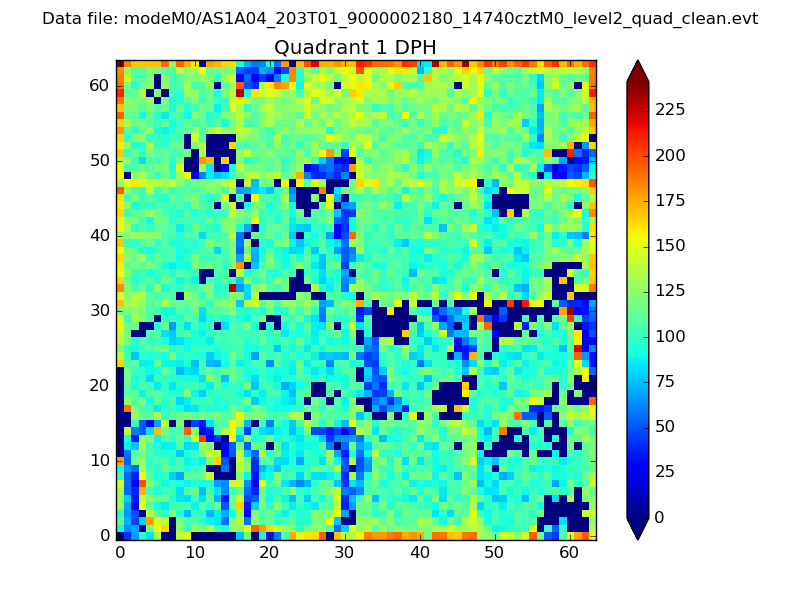
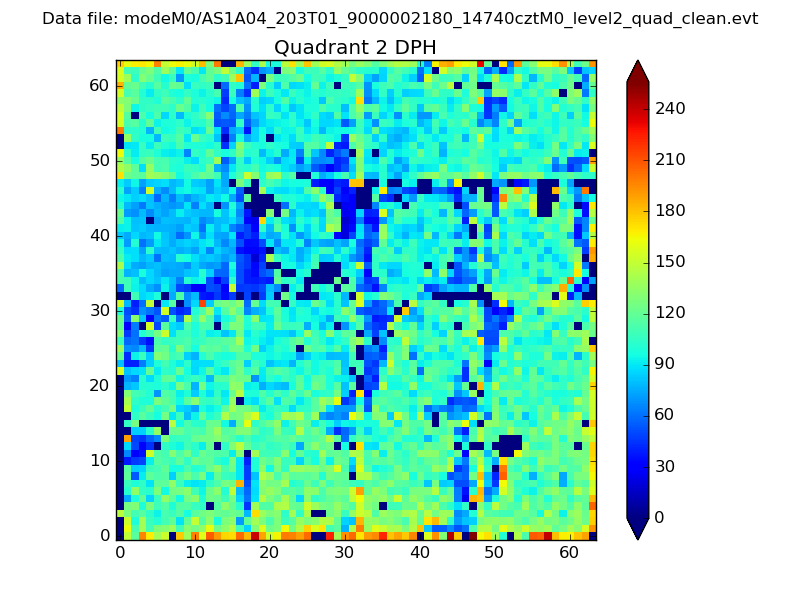
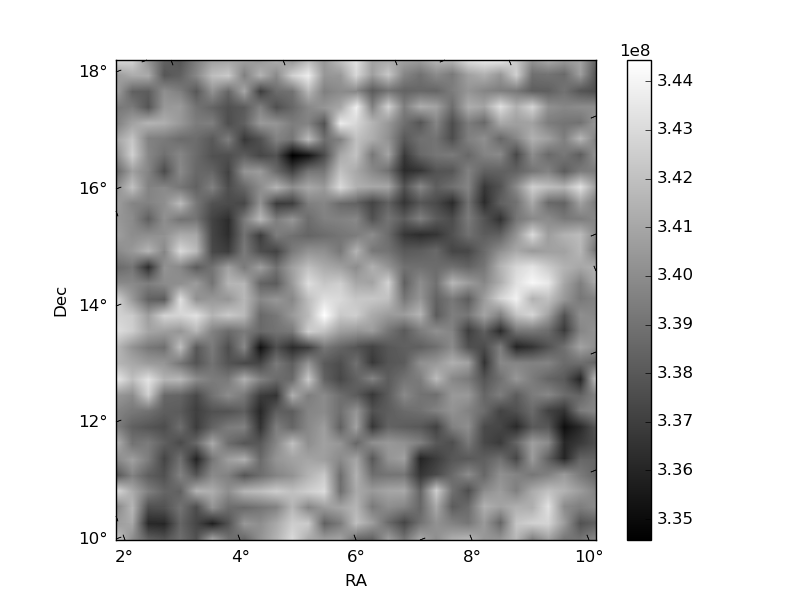
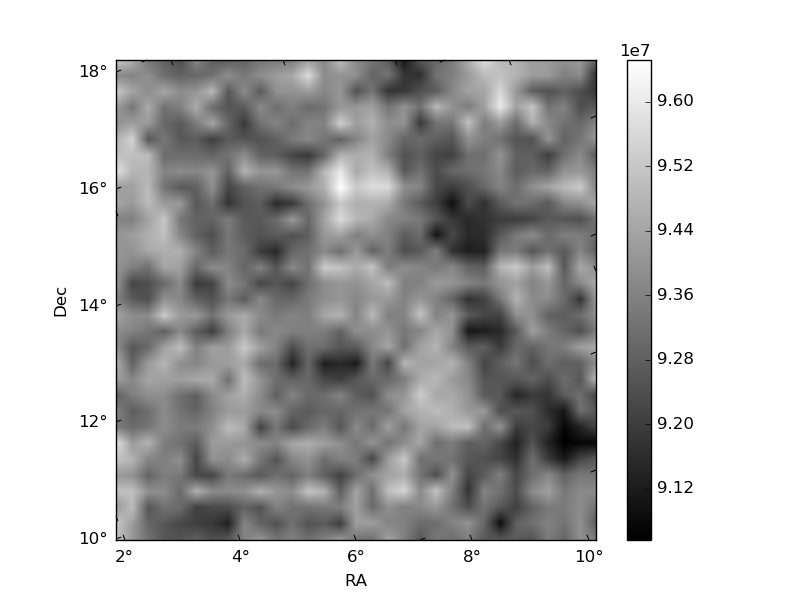
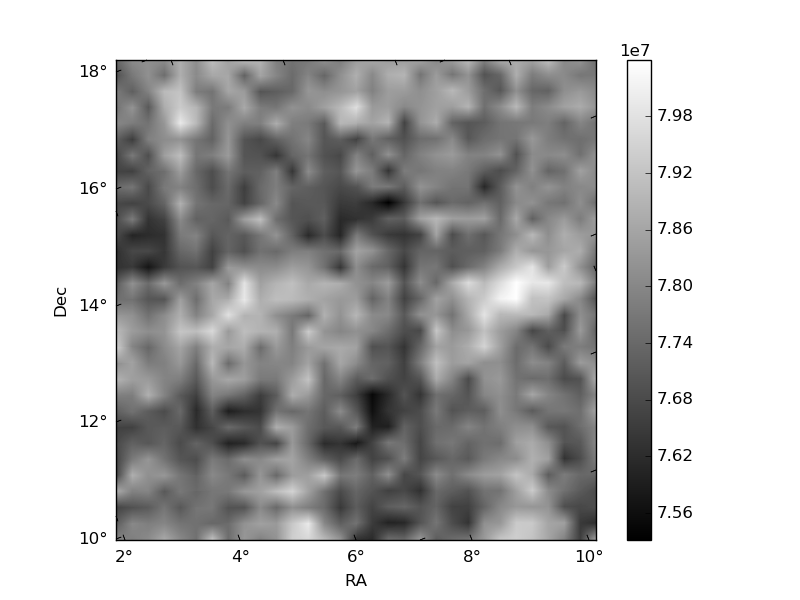
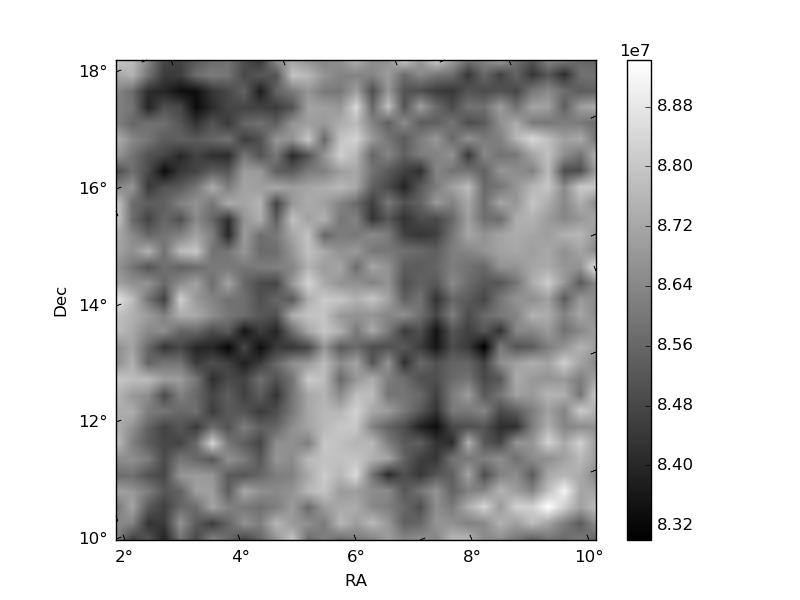
Histogram calculated using DETX and DETY for each event in the final _common_clean file
| Quadrant A |  |
 |
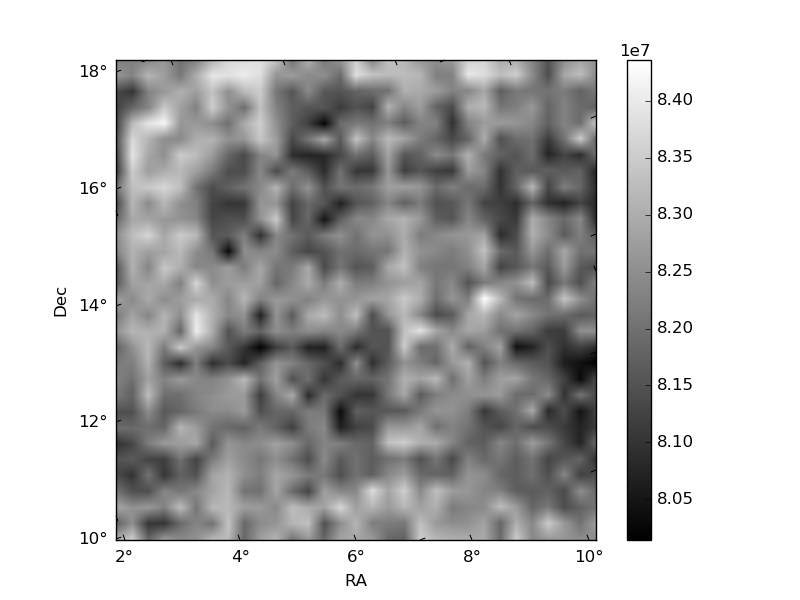
Quadrant B |
|---|---|---|---|
| Quadrant D | 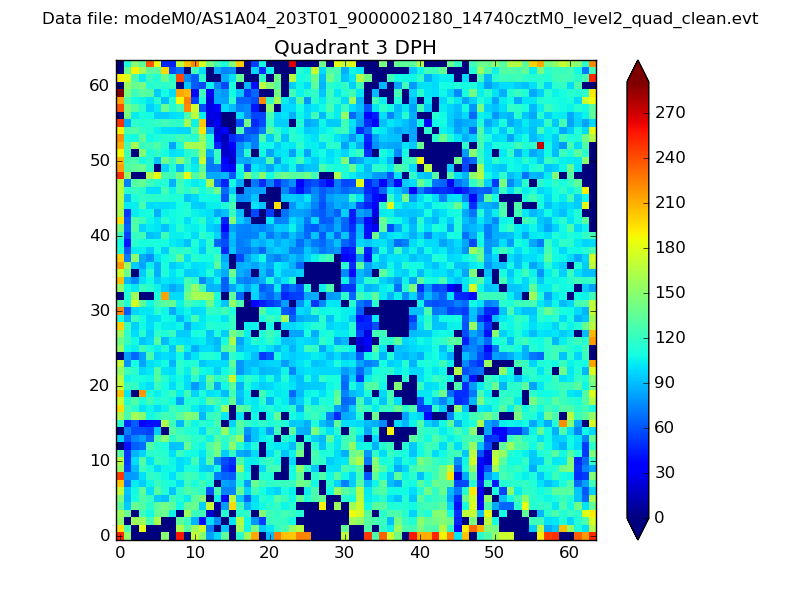 |
 |
Quadrant C |
| Plot type | Count rate plots | Images |
|---|---|---|
| Comparison with Poisson distribution Blue bars denote a histogram of data divided into 1 sec bins. Red curve is a Poisson curve with rate = median count rate of data. |
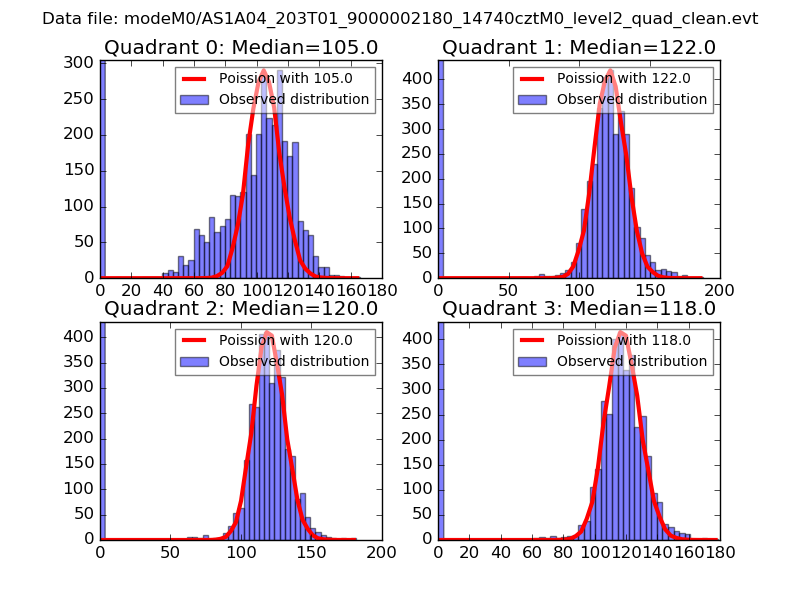 |
 |
| Quadrant-wise count rates Data is divided into 100 sec bins |
 |
|
| Module-wise count rates for Quadrant A Data is divided into 100 sec bins |
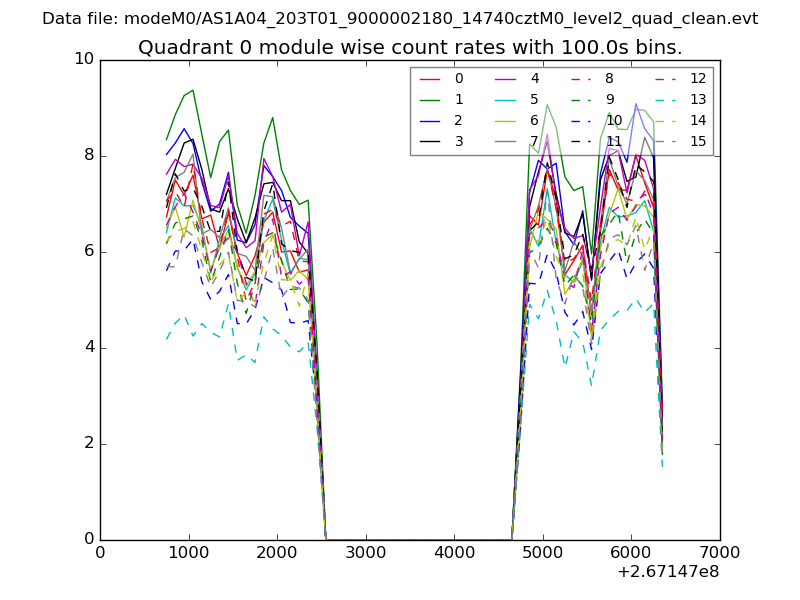 |
 |
| Module-wise count rates for Quadrant B Data is divided into 100 sec bins |
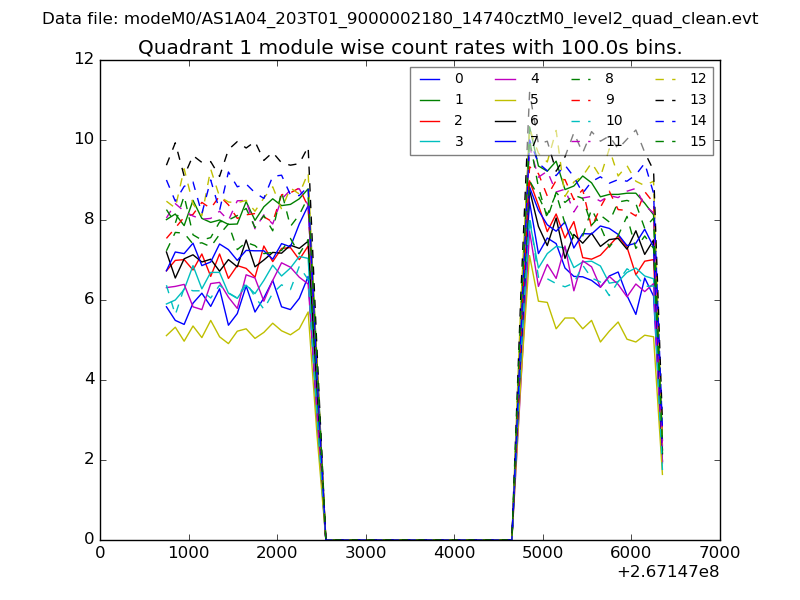 |
 |
| Module-wise count rates for Quadrant C Data is divided into 100 sec bins |
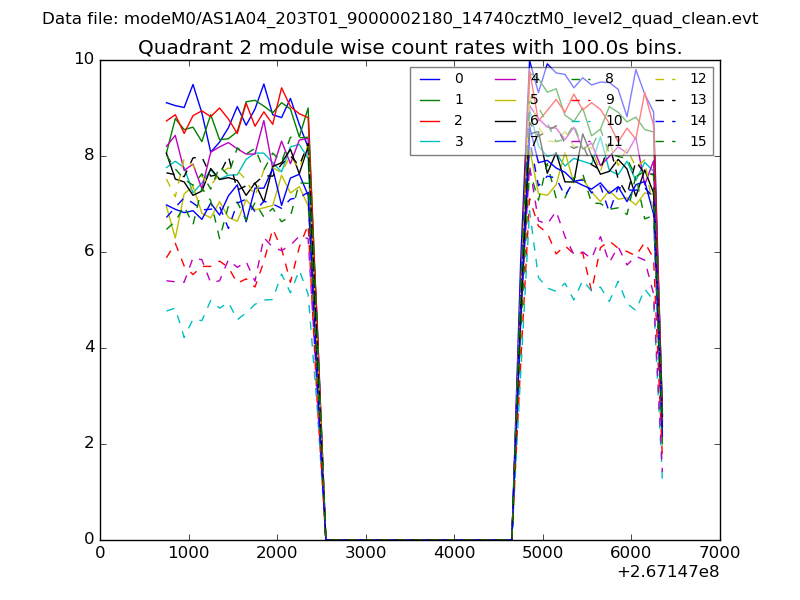 |
 |
| Module-wise count rates for Quadrant D Data is divided into 100 sec bins |
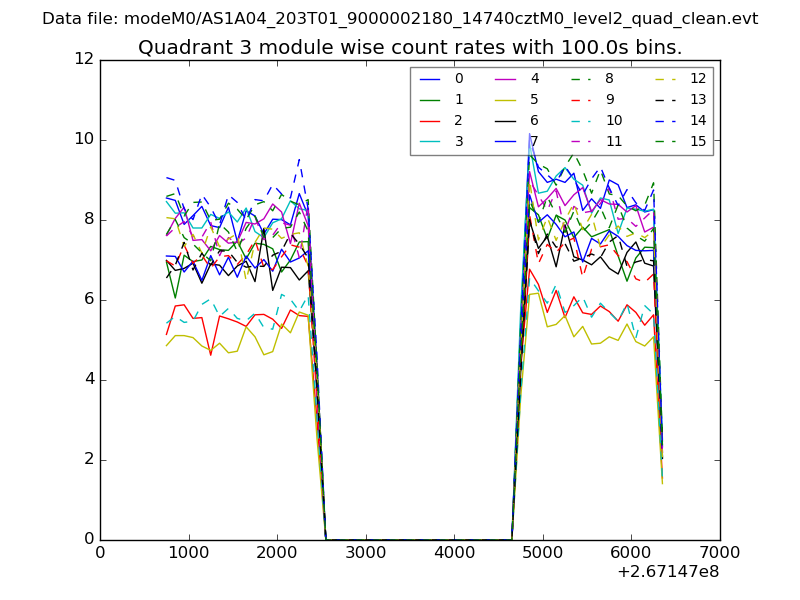 |
 |
| Parameter | Plot |
|---|---|
| CZT HV Monitor | 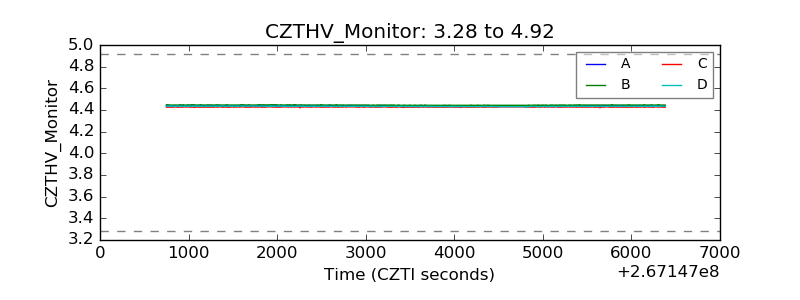 |
| D_VDD | 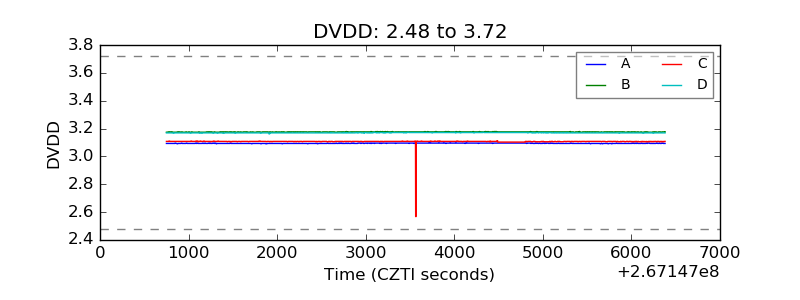 |
| Temperature 1 | 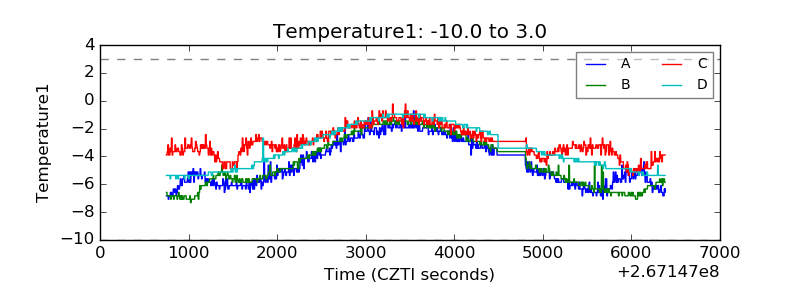 |
| Veto HV Monitor | 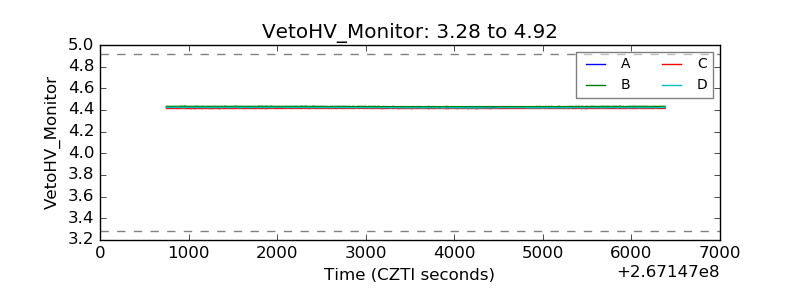 |
| Veto LLD | 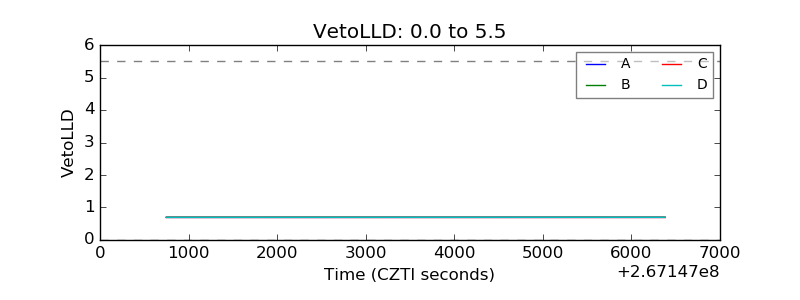 |
| Alpha Counter | 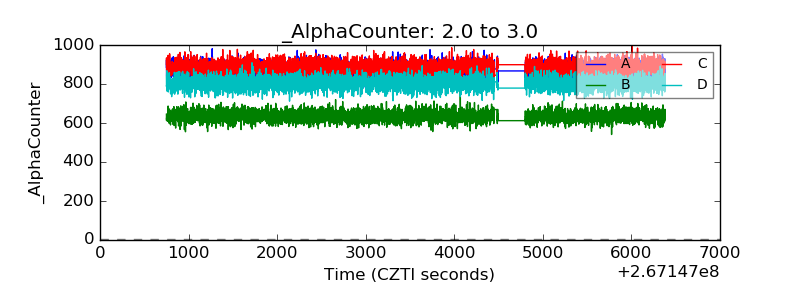 |
| _CPM_Rate |  |
| CZT Counter | 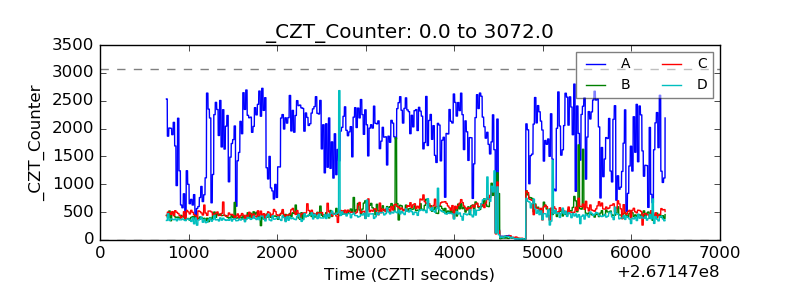 |
| +2.5 Volts monitor |  |
| +5 Volts monitor |  |
| _ROLL_ROT | 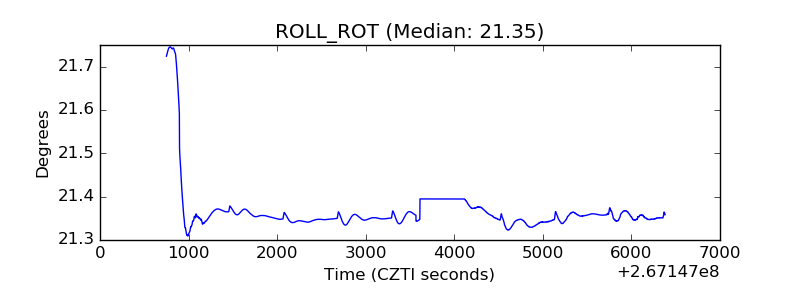 |
| _Roll_DEC | 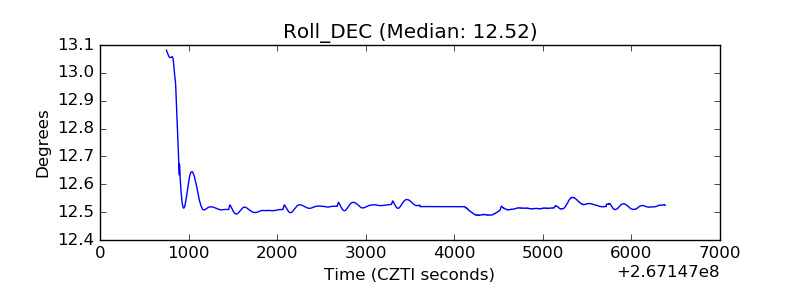 |
| _Roll_RA |  |
| Veto Counter | 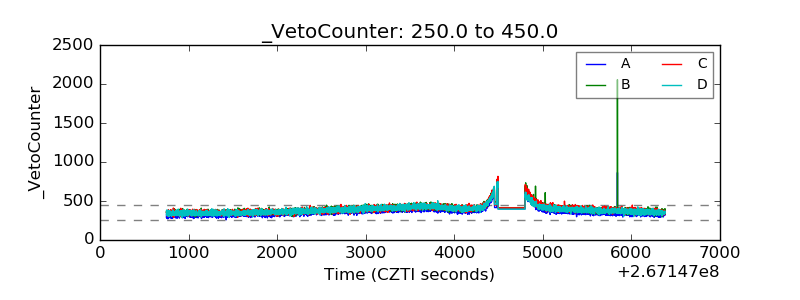 |