| Param | Original file | Final file |
|---|---|---|
| Filename | modeM0/AS1A04_203T01_9000002180_14745cztM0_level2.evt | modeM0/AS1A04_203T01_9000002180_14745cztM0_level2_quad_clean.evt |
| Size (bytes) | 2,987,501,760 | 330,223,680 |
| Size | 2.8 GB | 314.9 MB |
| Events in quadrant A | 42,181,376 | 1,874,947 |
| Events in quadrant B | 16,281,531 | 2,100,666 |
| Events in quadrant C | 17,113,803 | 2,054,428 |
| Events in quadrant D | 13,002,633 | 2,027,932 |
| Mode M0 | |||
|---|---|---|---|
| Quadrant | BADHDUFLAG | Total packets | Discarded packets |
| A | 0 | 144902 | 6 |
| B | 0 | 66670 | 5 |
| C | 0 | 68852 | 5 |
| D | 0 | 58741 | 5 |
| Mode SS | |||
|---|---|---|---|
| Quadrant | BADHDUFLAG | Total packets | Discarded packets |
| A | 0 | 572 | 0 |
| B | 0 | 572 | 0 |
| C | 0 | 572 | 0 |
| D | 0 | 572 | 0 |
| Mode M9 | |||
|---|---|---|---|
| Quadrant | BADHDUFLAG | Total packets | Discarded packets |
| A | 0 | 42 | 0 |
| B | 0 | 42 | 0 |
| C | 0 | 42 | 0 |
| D | 0 | 42 | 0 |
| Quadrant | Total seconds | Saturated seconds | Saturation percentage |
|---|---|---|---|
| A | 28252 | 8800 | 31.148237% |
| B | 28252 | 1141 | 4.038652% |
| C | 28252 | 473 | 1.674218% |
| D | 28252 | 146 | 0.516778% |
Noise dominated data is calculated using 1-second bins in cleaned event files. If a bin has >2000 counts, and if more than 50% of those come from <1% of pixels, then it is considered to be noise-dominated and hence unusable.
| Quadrant | # 1 sec bins | Bins with >0 counts | Bins with >2000 counts | High rate bins dominated by noise | Noise dominated (total time) | Noise dominated (detector-on time) | Marked lightcurve |
|---|---|---|---|---|---|---|---|
| A | 32293 | 28253 | 7481 | 7481 | 23.17% | 26.48% | 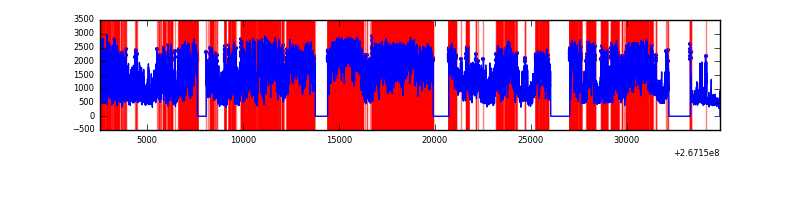 |
| B | 32293 | 28253 | 605 | 605 | 1.87% | 2.14% | 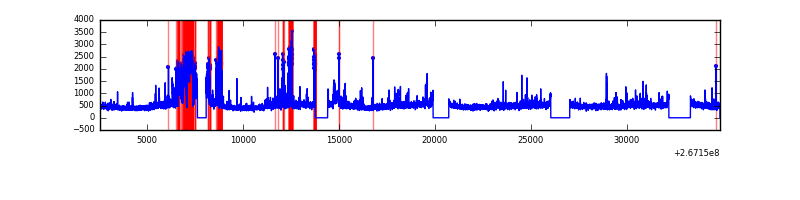 |
| C | 32293 | 28253 | 285 | 285 | 0.88% | 1.01% | 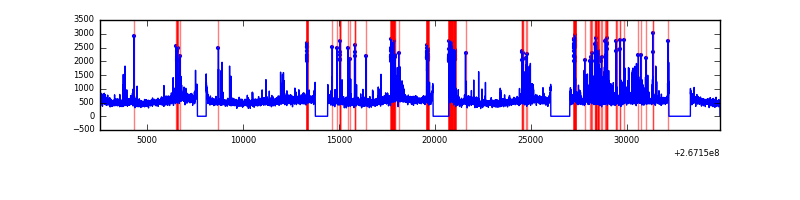 |
| D | 32293 | 28255 | 48 | 48 | 0.15% | 0.17% | 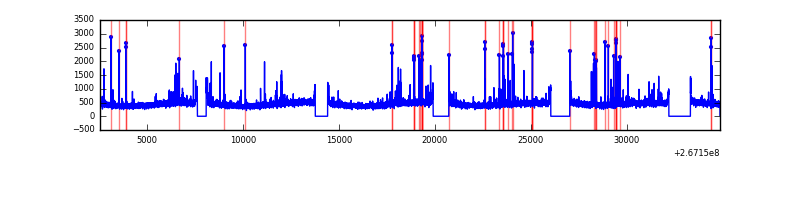 |
Top three noisy pixels from each quadrant. If the there are fewer than three noisy pixels in the level2.evt file, extra rows are filled as -1
| Pixel properties | Quadrant properties | ||||||
|---|---|---|---|---|---|---|---|
| Quadrant | DetID | PixID | Counts | Sigma | Mean | Median | Sigma |
| A | 8 | 15 | 29783429 | 47271.44 | 3117 | 3049 | 630.0 |
| A | 12 | 189 | 265947 | 417.31 | 3117 | 3049 | 630.0 |
| A | 1 | 162 | 46895 | 69.6 | 3117 | 3049 | 630.0 |
| B | 10 | 16 | 2648185 | 4181.08 | 3337 | 3258 | 632.6 |
| B | 0 | 229 | 143168 | 221.17 | 3337 | 3258 | 632.6 |
| B | 0 | 205 | 101803 | 155.78 | 3337 | 3258 | 632.6 |
| C | 3 | 233 | 2722101 | 3638.97 | 3245 | 3269 | 747.1 |
| C | 4 | 254 | 1107690 | 1478.19 | 3245 | 3269 | 747.1 |
| C | 9 | 236 | 500366 | 665.33 | 3245 | 3269 | 747.1 |
| D | 10 | 70 | 143518 | 169.43 | 3276 | 3191 | 828.2 |
| D | 2 | 234 | 119327 | 140.22 | 3276 | 3191 | 828.2 |
| D | 13 | 172 | 101961 | 119.25 | 3276 | 3191 | 828.2 |
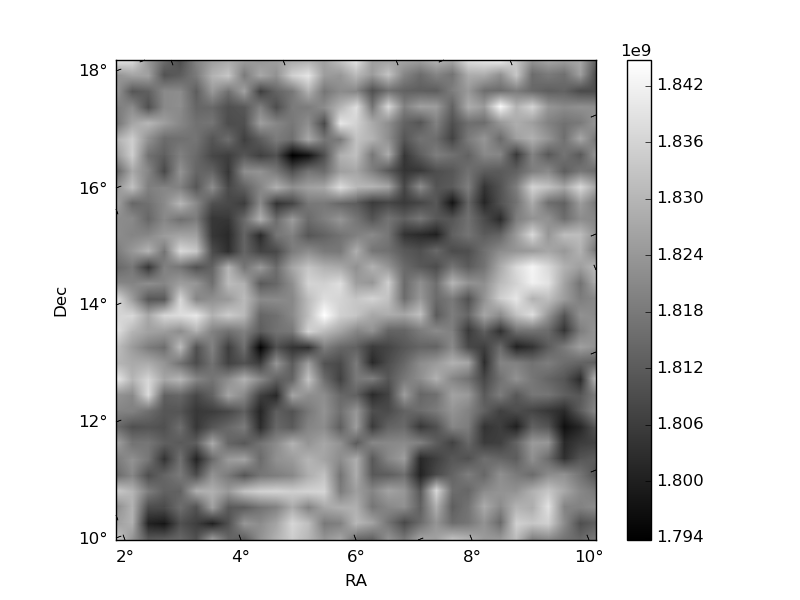
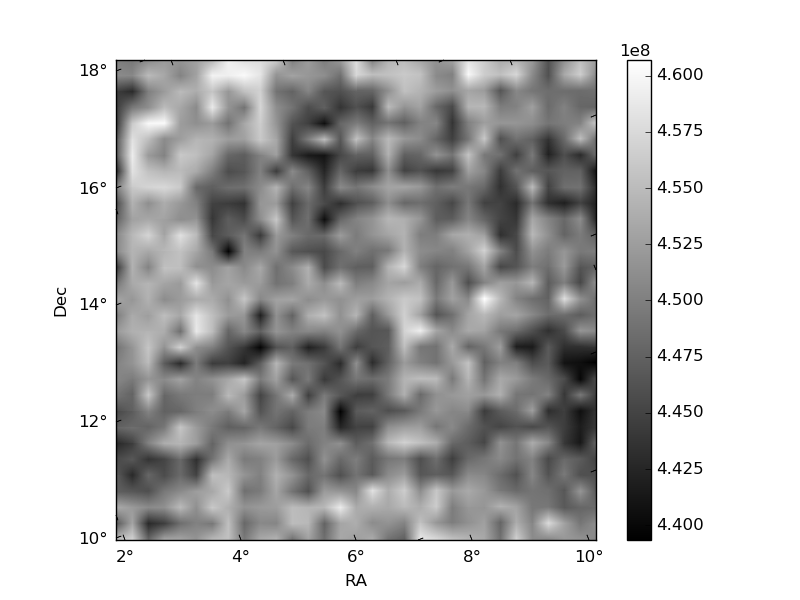
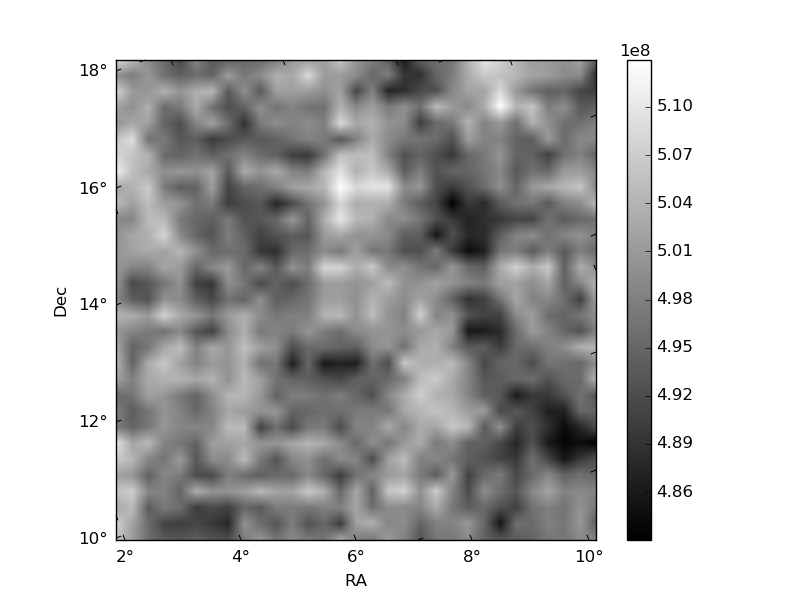
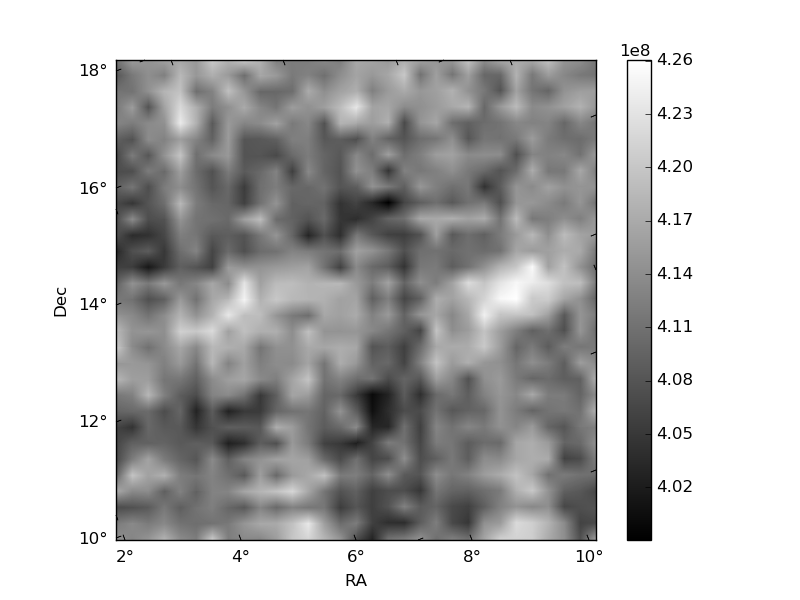
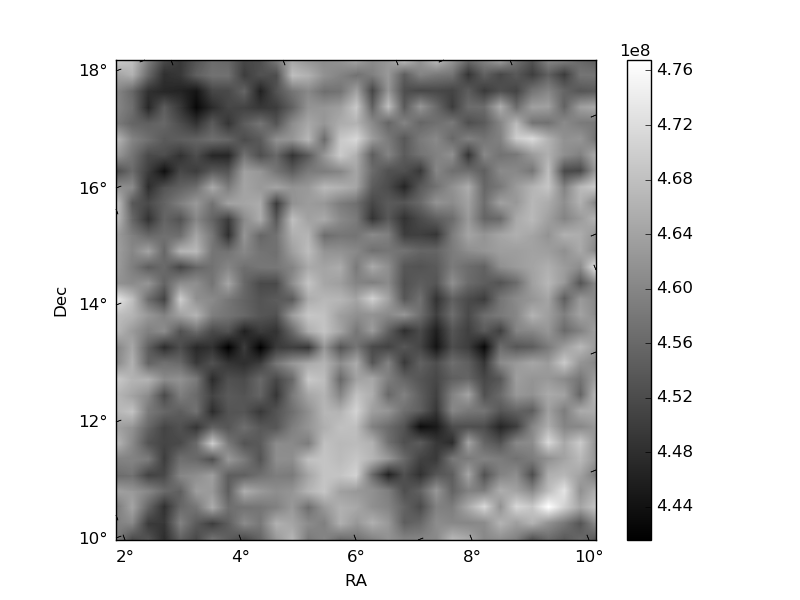
Histogram calculated using DETX and DETY for each event in the final _common_clean file
| Quadrant A | 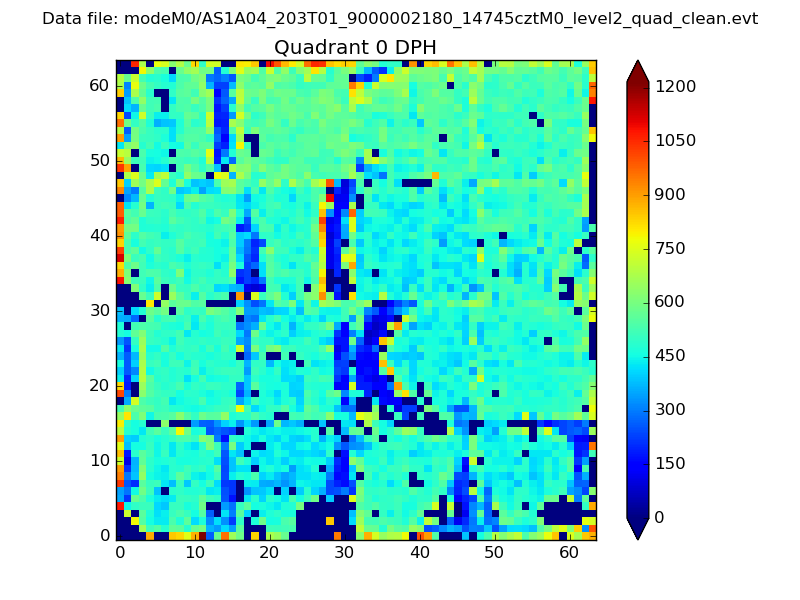 |
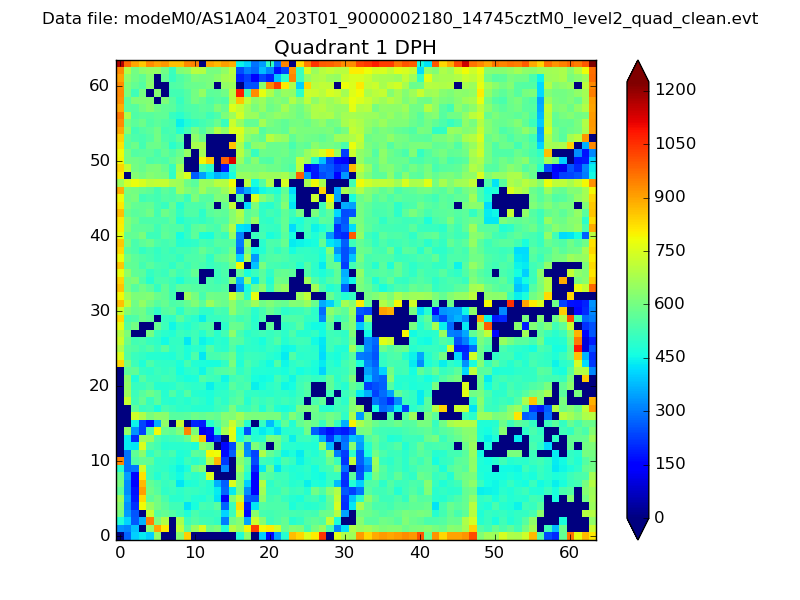 |
Quadrant B |
|---|---|---|---|
| Quadrant D | 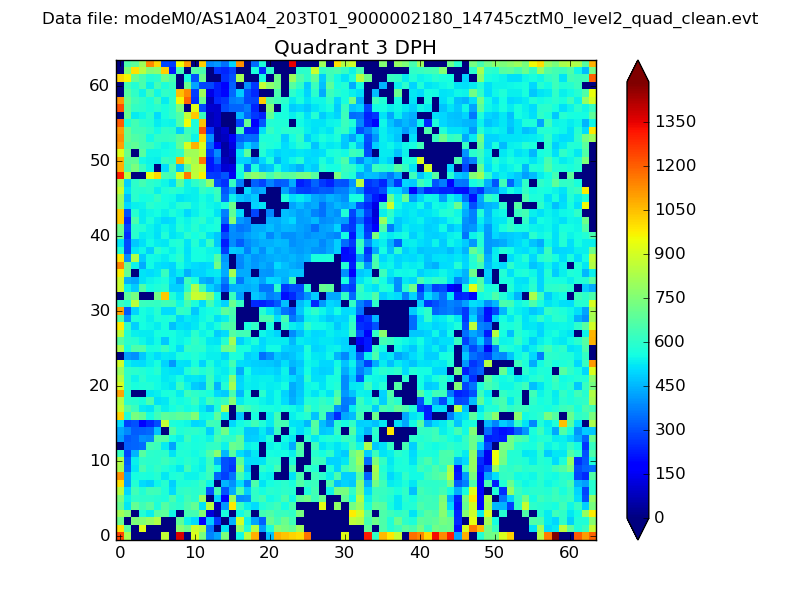 |
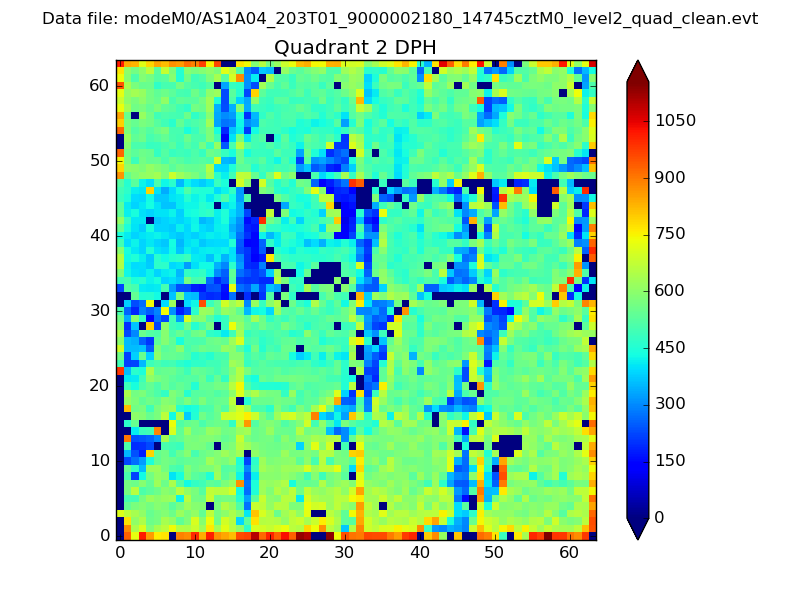 |
Quadrant C |
| Plot type | Count rate plots | Images |
|---|---|---|
| Comparison with Poisson distribution Blue bars denote a histogram of data divided into 1 sec bins. Red curve is a Poisson curve with rate = median count rate of data. |
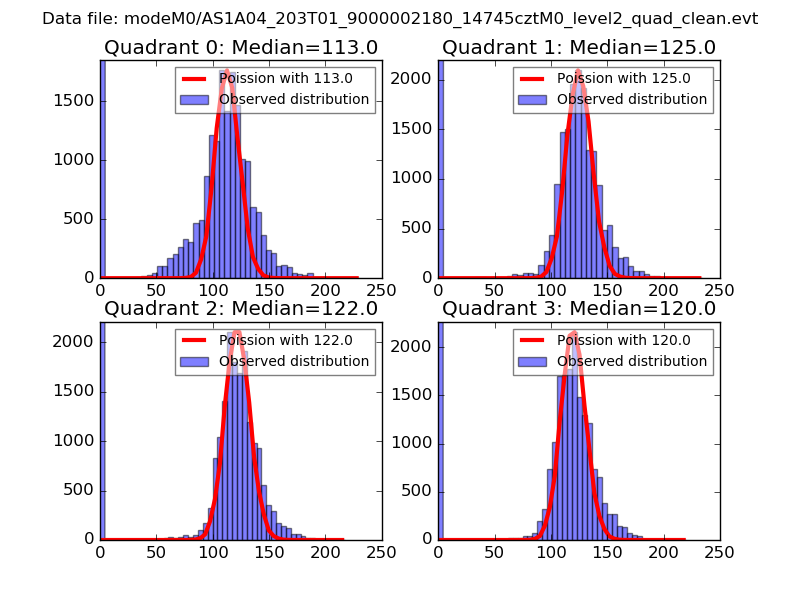 |
 |
| Quadrant-wise count rates Data is divided into 100 sec bins |
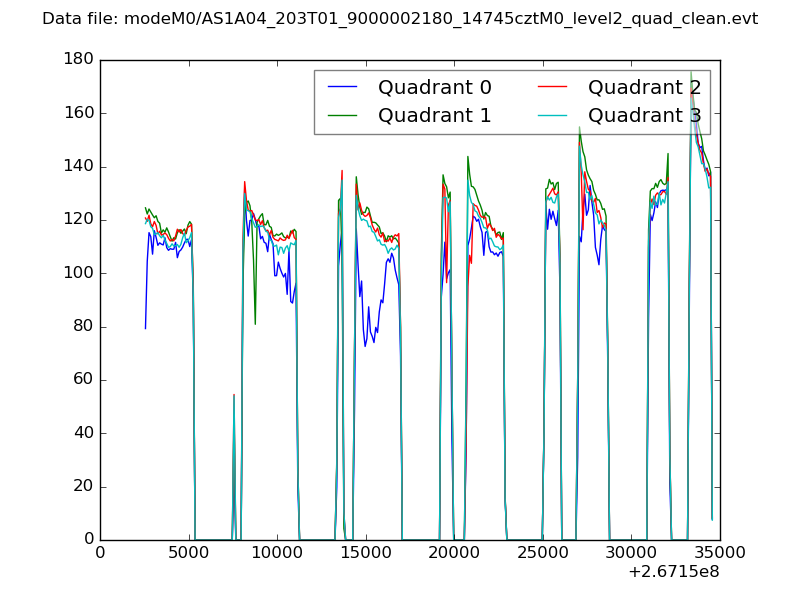 |
|
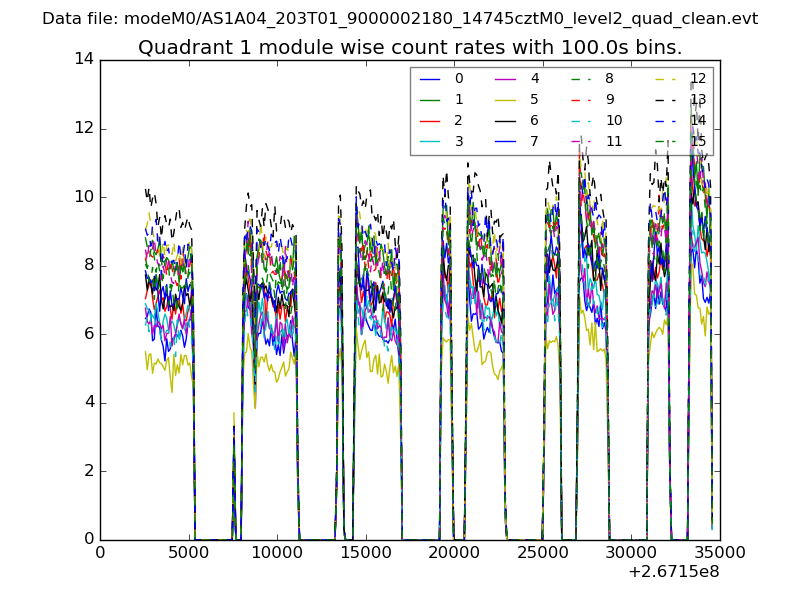
| Module-wise count rates for Quadrant A Data is divided into 100 sec bins |
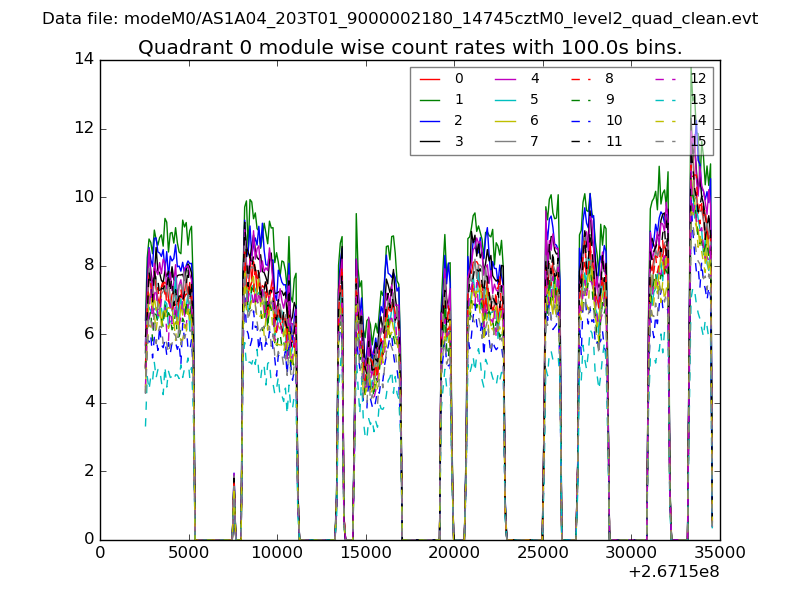 |
 |
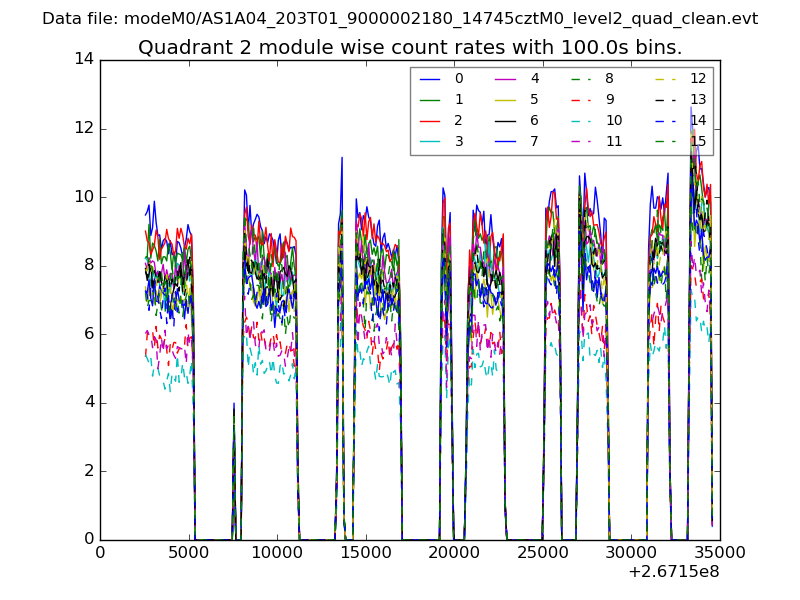
| Module-wise count rates for Quadrant B Data is divided into 100 sec bins |
 |
 |
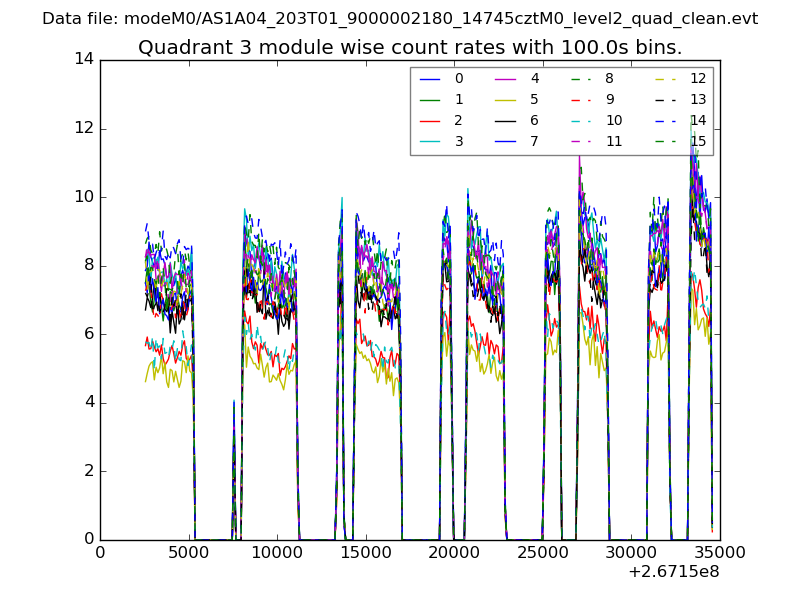
| Module-wise count rates for Quadrant C Data is divided into 100 sec bins |
 |
 |
| Module-wise count rates for Quadrant D Data is divided into 100 sec bins |
 |
 |
| Parameter | Plot |
|---|---|
| CZT HV Monitor | 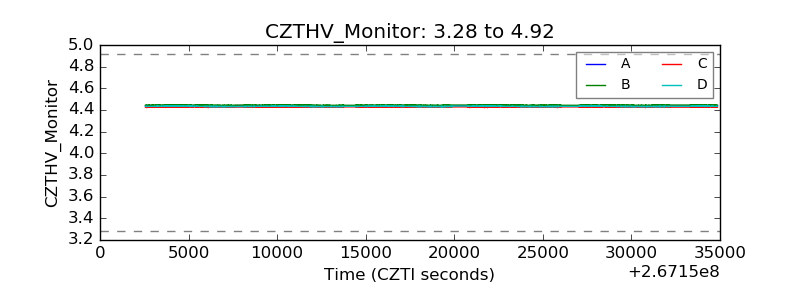 |
| D_VDD | 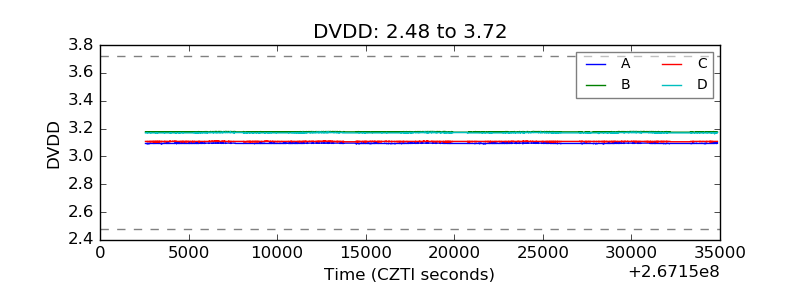 |
| Temperature 1 | 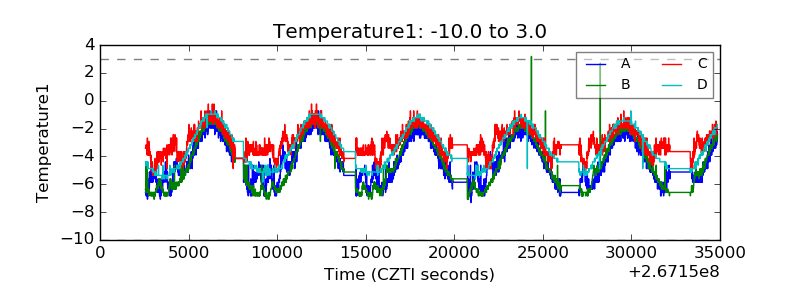 |
| Veto HV Monitor | 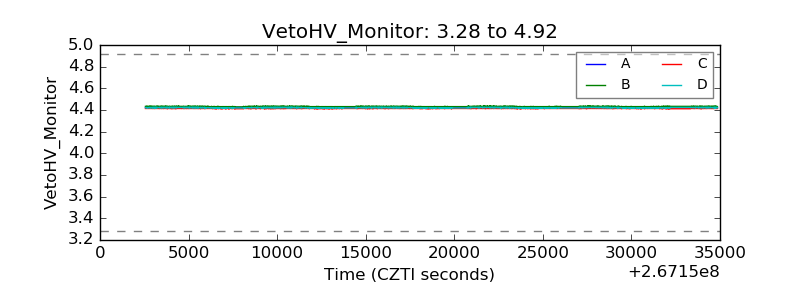 |
| Veto LLD |  |
| Alpha Counter | 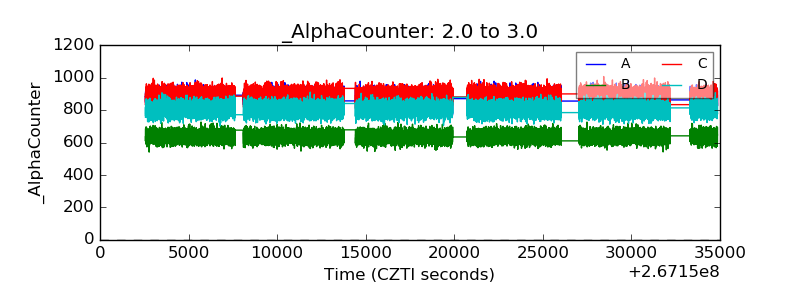 |
| _CPM_Rate | 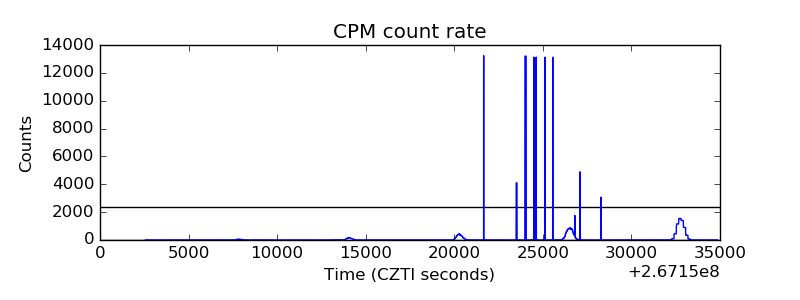 |
| CZT Counter | 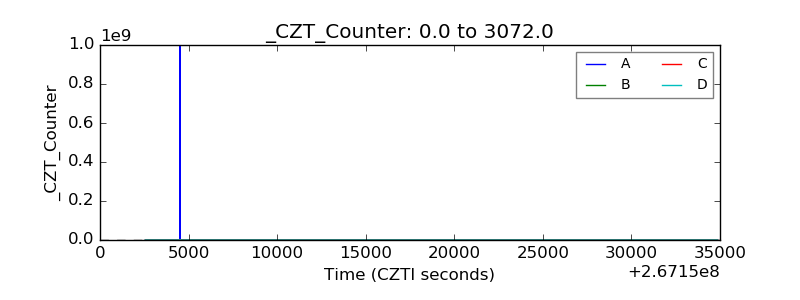 |
| +2.5 Volts monitor |  |
| +5 Volts monitor |  |
| _ROLL_ROT | 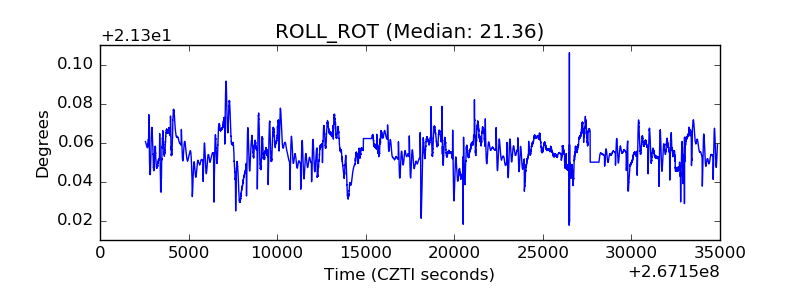 |
| _Roll_DEC | 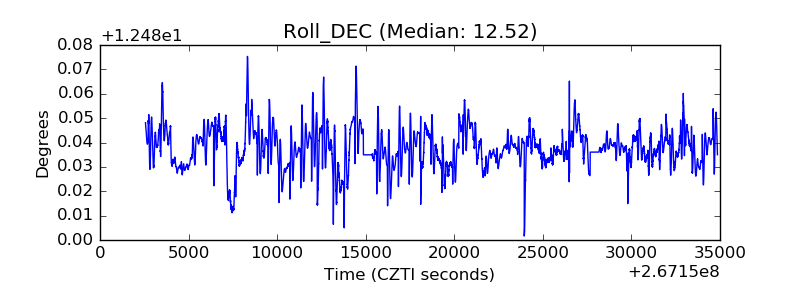 |
| _Roll_RA | 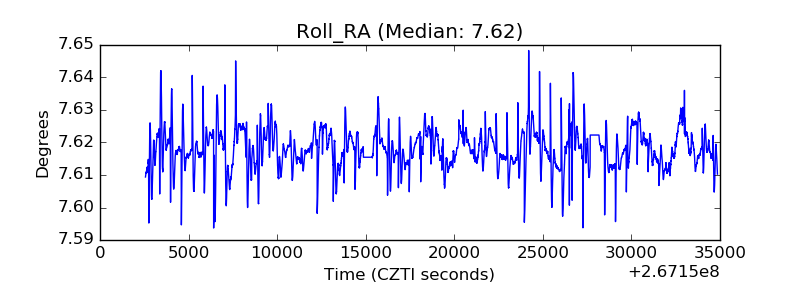 |
| Veto Counter | 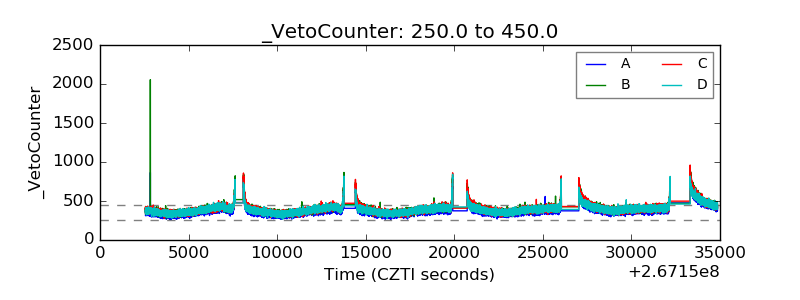 |