| Param | Original file | Final file |
|---|---|---|
| Filename | modeM0/AS1A04_203T01_9000002180_14747cztM0_level2.evt | modeM0/AS1A04_203T01_9000002180_14747cztM0_level2_quad_clean.evt |
| Size (bytes) | 492,932,160 | 74,240,640 |
| Size | 470.1 MB | 70.8 MB |
| Events in quadrant A | 4,593,216 | 456,628 |
| Events in quadrant B | 3,325,006 | 466,252 |
| Events in quadrant C | 3,603,863 | 452,069 |
| Events in quadrant D | 2,993,439 | 447,795 |
| Mode M0 | |||
|---|---|---|---|
| Quadrant | BADHDUFLAG | Total packets | Discarded packets |
| A | 0 | 17703 | 2 |
| B | 0 | 13468 | 1 |
| C | 0 | 14266 | 1 |
| D | 0 | 12690 | 1 |
| Mode SS | |||
|---|---|---|---|
| Quadrant | BADHDUFLAG | Total packets | Discarded packets |
| A | 0 | 124 | 0 |
| B | 0 | 124 | 0 |
| C | 0 | 124 | 0 |
| D | 0 | 124 | 0 |
| Mode M9 | |||
|---|---|---|---|
| Quadrant | BADHDUFLAG | Total packets | Discarded packets |
| A | 0 | 12 | 0 |
| B | 0 | 12 | 0 |
| C | 0 | 12 | 0 |
| D | 0 | 12 | 0 |
| Quadrant | Total seconds | Saturated seconds | Saturation percentage |
|---|---|---|---|
| A | 6090 | 178 | 2.922824% |
| B | 6090 | 100 | 1.642036% |
| C | 6090 | 83 | 1.362890% |
| D | 6090 | 56 | 0.919540% |
Noise dominated data is calculated using 1-second bins in cleaned event files. If a bin has >2000 counts, and if more than 50% of those come from <1% of pixels, then it is considered to be noise-dominated and hence unusable.
| Quadrant | # 1 sec bins | Bins with >0 counts | Bins with >2000 counts | High rate bins dominated by noise | Noise dominated (total time) | Noise dominated (detector-on time) | Marked lightcurve |
|---|---|---|---|---|---|---|---|
| A | 7296 | 6091 | 57 | 57 | 0.78% | 0.94% | 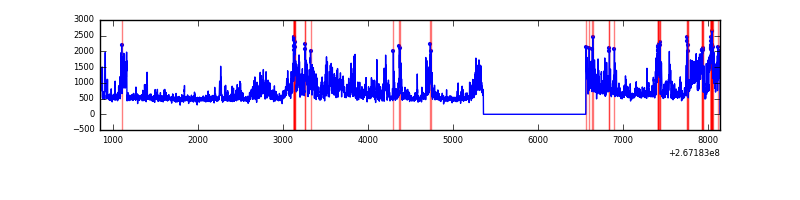 |
| B | 7296 | 6091 | 25 | 25 | 0.34% | 0.41% | 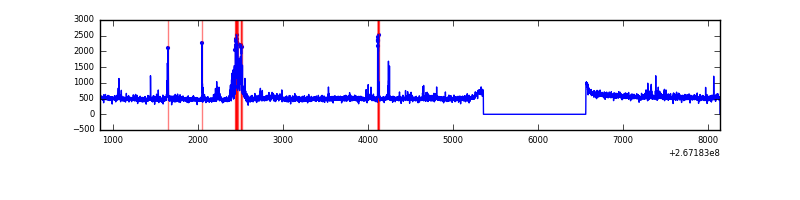 |
| C | 7296 | 6091 | 29 | 29 | 0.40% | 0.48% | 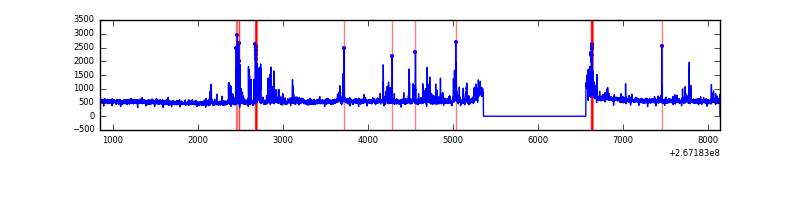 |
| D | 7296 | 6091 | 5 | 5 | 0.07% | 0.08% | 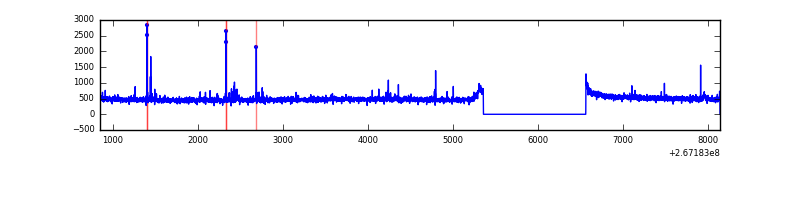 |
Top three noisy pixels from each quadrant. If the there are fewer than three noisy pixels in the level2.evt file, extra rows are filled as -1
| Pixel properties | Quadrant properties | ||||||
|---|---|---|---|---|---|---|---|
| Quadrant | DetID | PixID | Counts | Sigma | Mean | Median | Sigma |
| A | 8 | 15 | 1438229 | 8998.78 | 793 | 778 | 159.7 |
| A | 12 | 189 | 80512 | 499.15 | 793 | 778 | 159.7 |
| A | 1 | 162 | 9953 | 57.44 | 793 | 778 | 159.7 |
| B | 4 | 142 | 129134 | 861.81 | 784 | 767 | 149.0 |
| B | 0 | 205 | 43520 | 287.03 | 784 | 767 | 149.0 |
| B | 10 | 16 | 28609 | 186.92 | 784 | 767 | 149.0 |
| C | 4 | 254 | 345551 | 1993.04 | 755 | 761 | 173.0 |
| C | 3 | 233 | 304104 | 1753.46 | 755 | 761 | 173.0 |
| C | 13 | 61 | 5553 | 27.7 | 755 | 761 | 173.0 |
| D | 2 | 234 | 24497 | 127.6 | 771 | 753 | 186.1 |
| D | 13 | 172 | 22163 | 115.06 | 771 | 753 | 186.1 |
| D | 2 | 120 | 18093 | 93.19 | 771 | 753 | 186.1 |
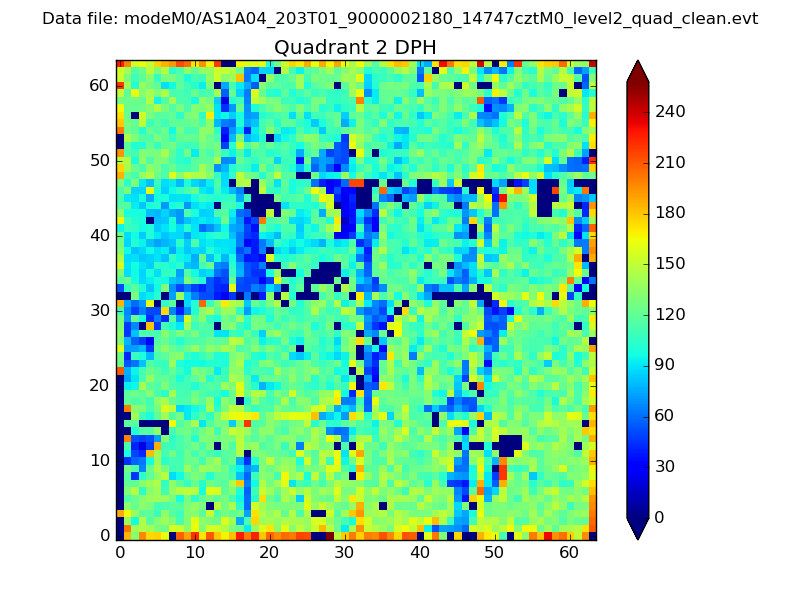
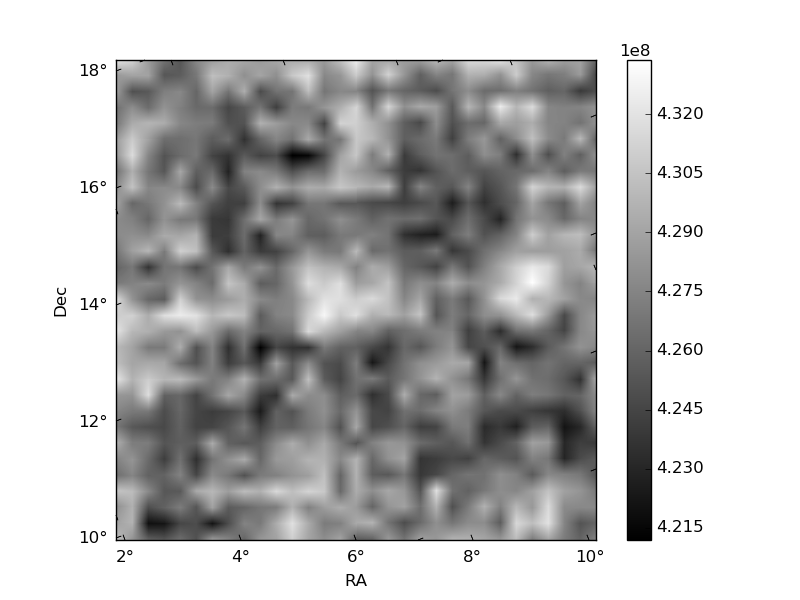
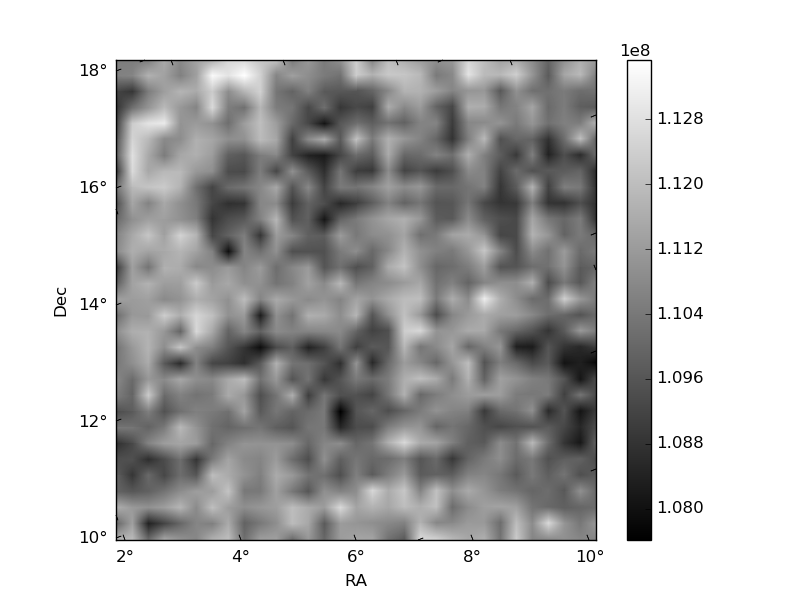
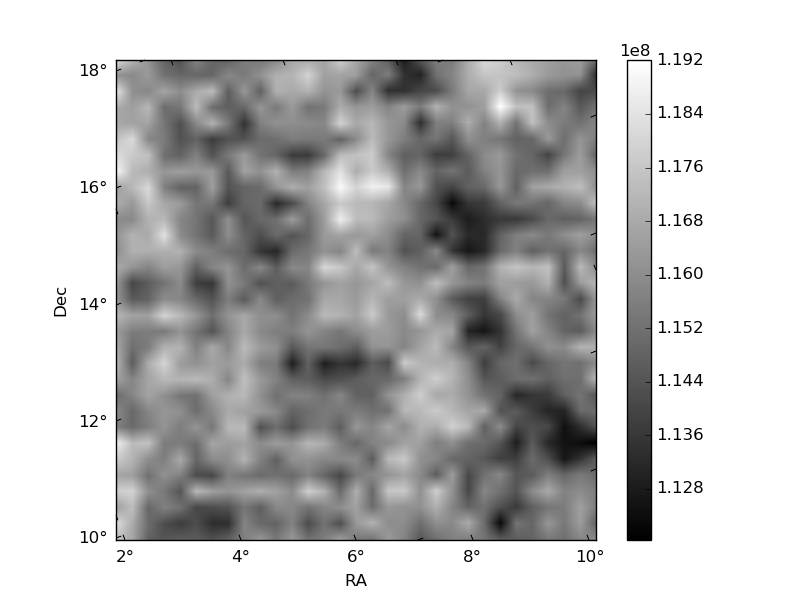
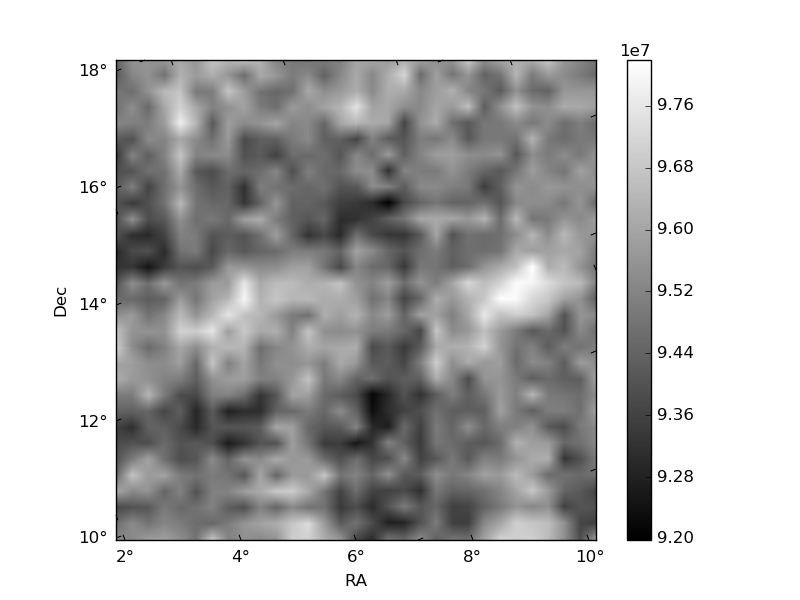
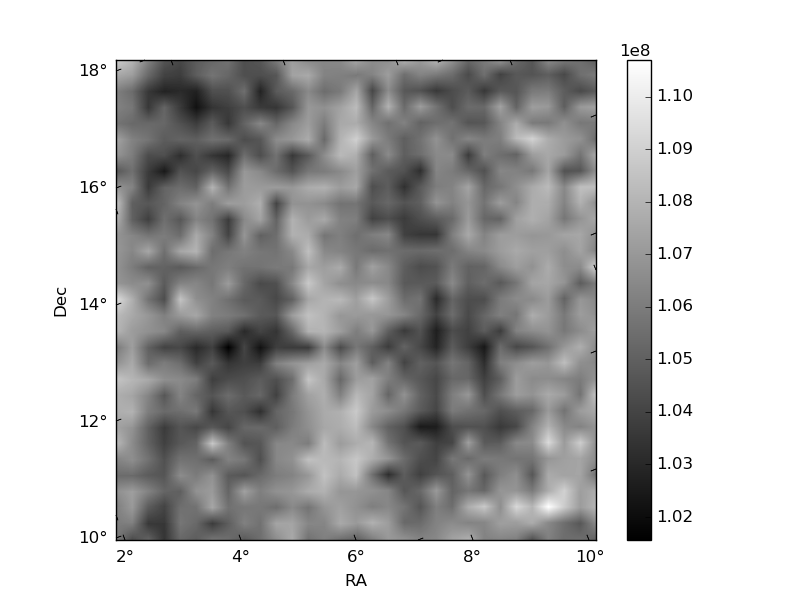
Histogram calculated using DETX and DETY for each event in the final _common_clean file
| Quadrant A | 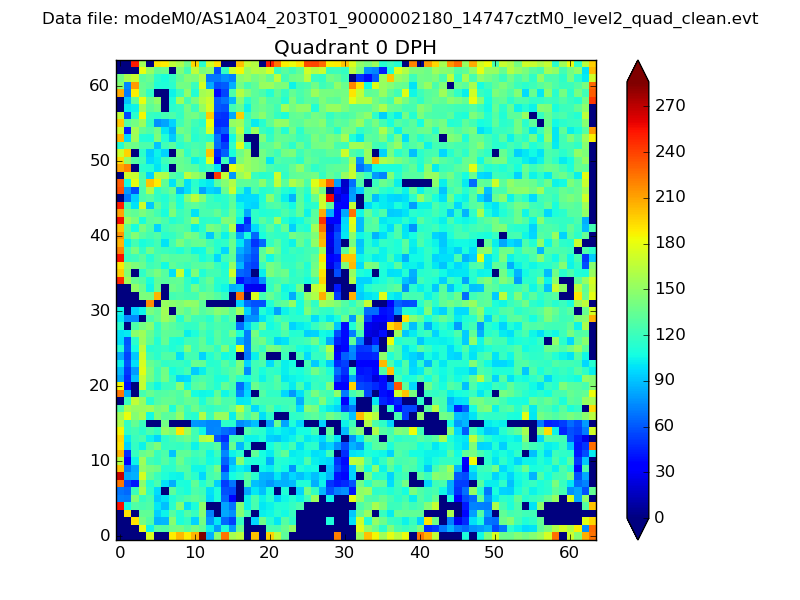 |
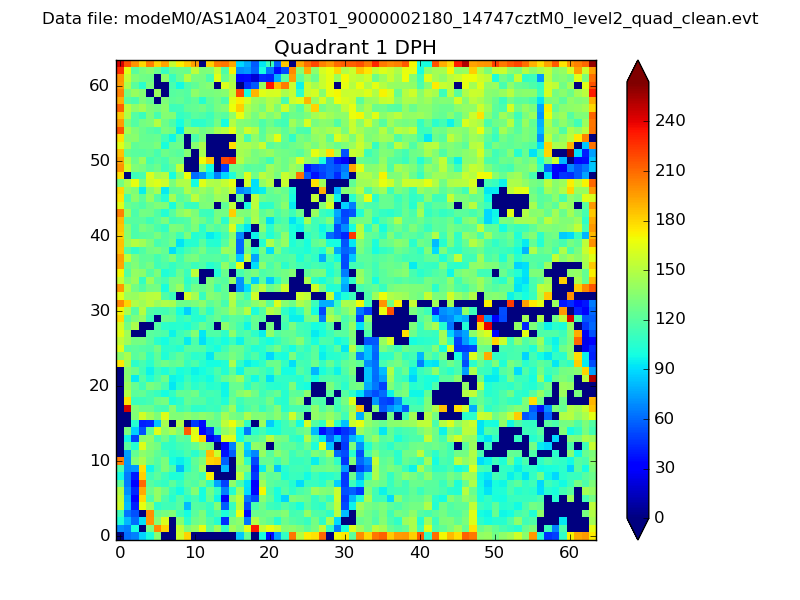 |
Quadrant B |
|---|---|---|---|
| Quadrant D | 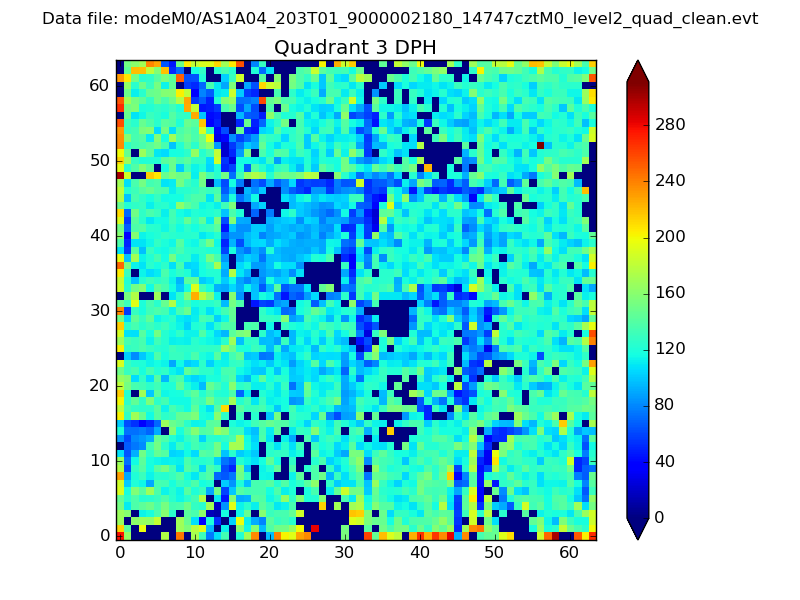 |
 |
Quadrant C |
| Plot type | Count rate plots | Images |
|---|---|---|
| Comparison with Poisson distribution Blue bars denote a histogram of data divided into 1 sec bins. Red curve is a Poisson curve with rate = median count rate of data. |
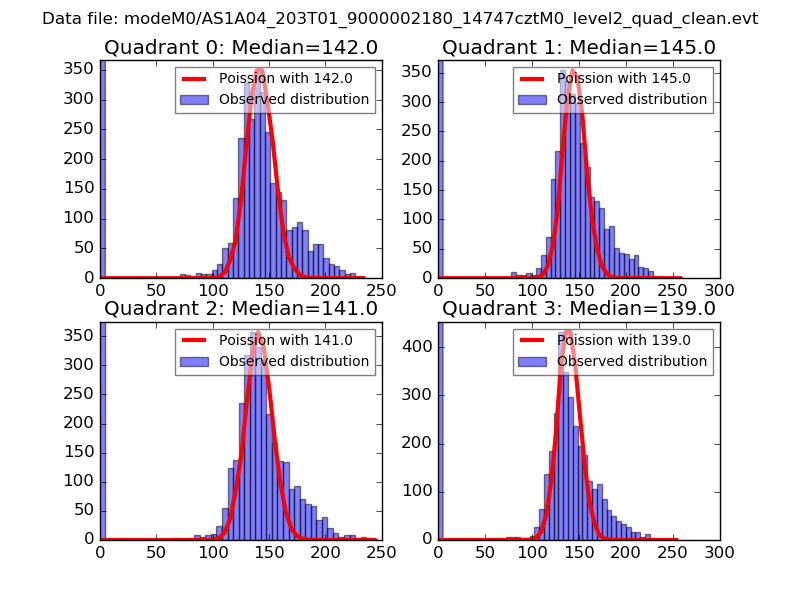 |
 |
| Quadrant-wise count rates Data is divided into 100 sec bins |
 |
|
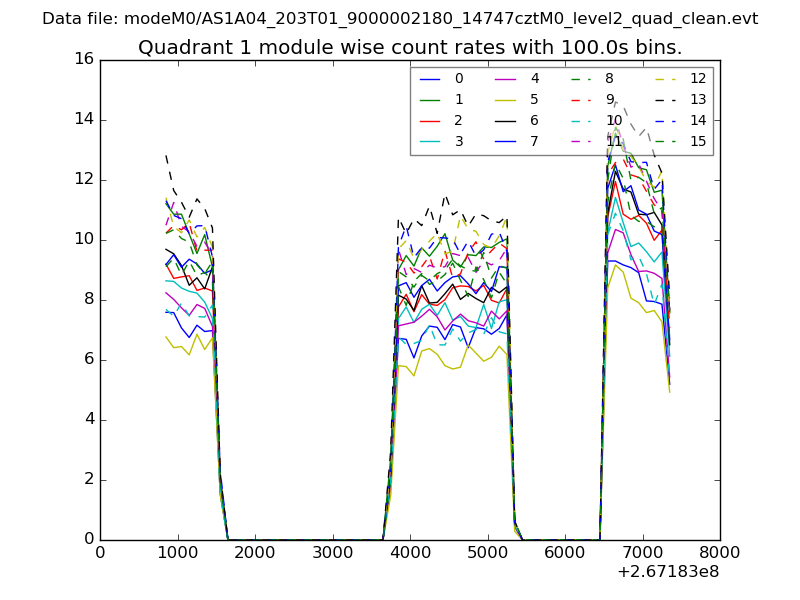
| Module-wise count rates for Quadrant A Data is divided into 100 sec bins |
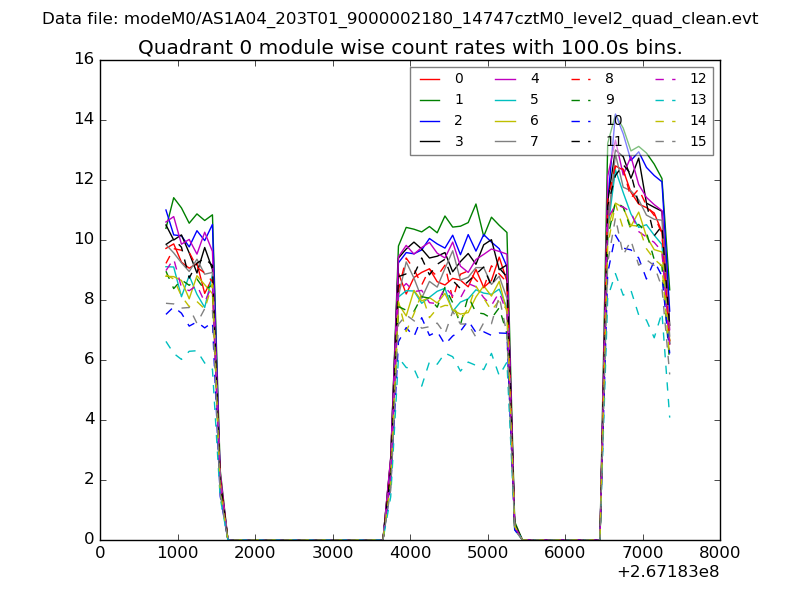 |
 |
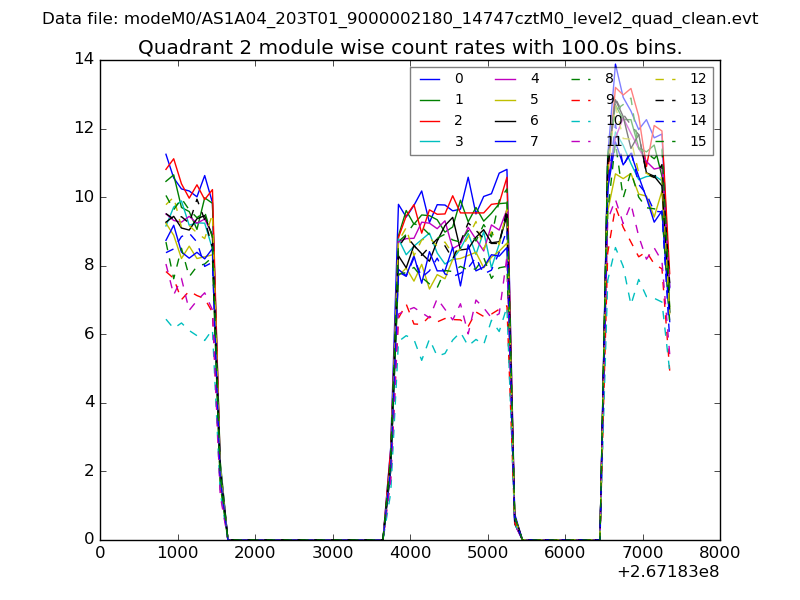
| Module-wise count rates for Quadrant B Data is divided into 100 sec bins |
 |
 |
| Module-wise count rates for Quadrant C Data is divided into 100 sec bins |
 |
 |
| Module-wise count rates for Quadrant D Data is divided into 100 sec bins |
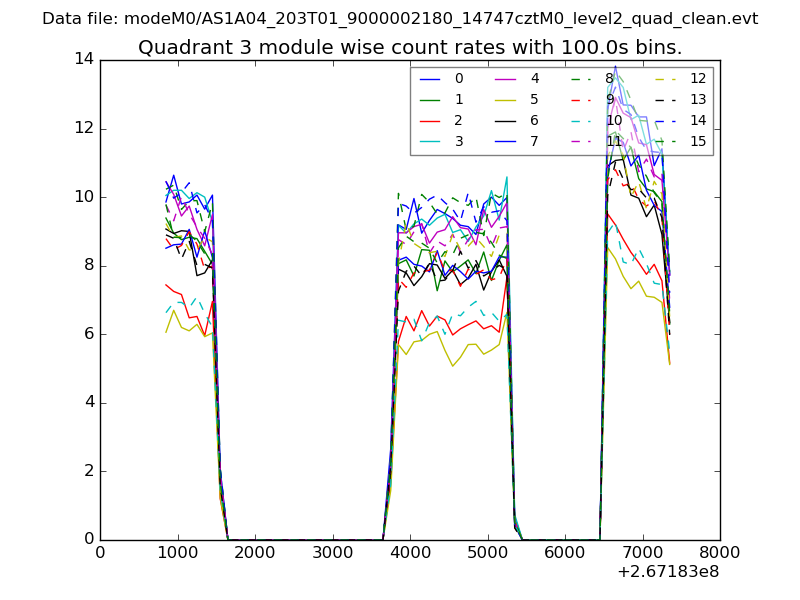 |
 |
| Parameter | Plot |
|---|---|
| CZT HV Monitor | 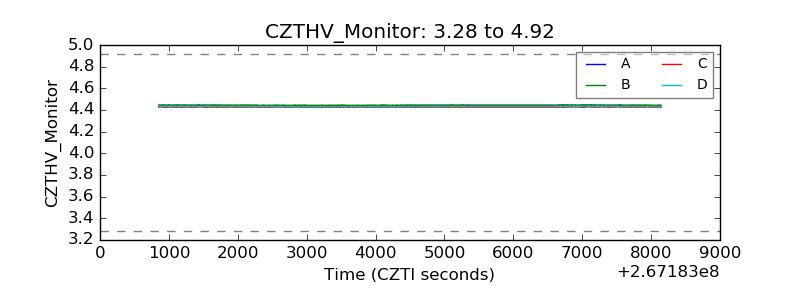 |
| D_VDD | 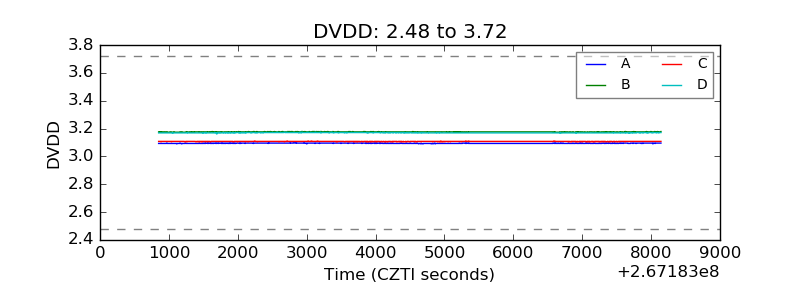 |
| Temperature 1 | 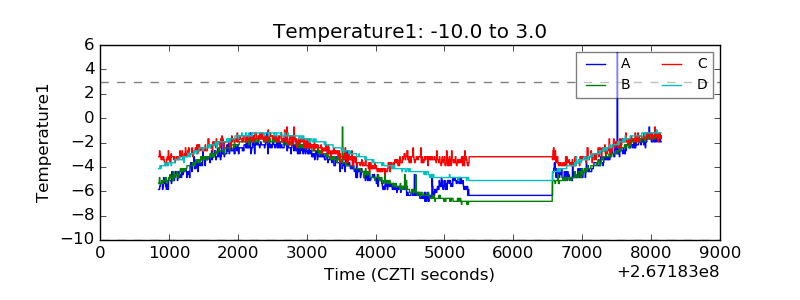 |
| Veto HV Monitor | 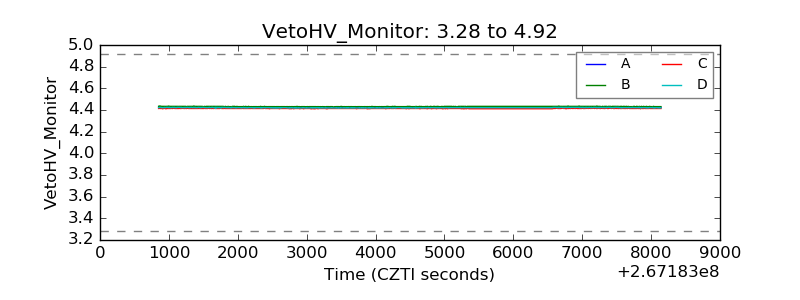 |
| Veto LLD | 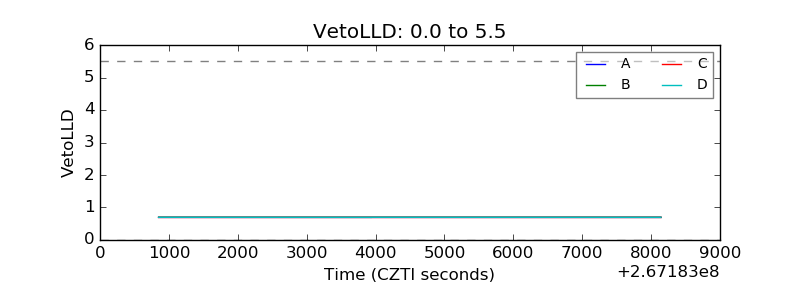 |
| Alpha Counter | 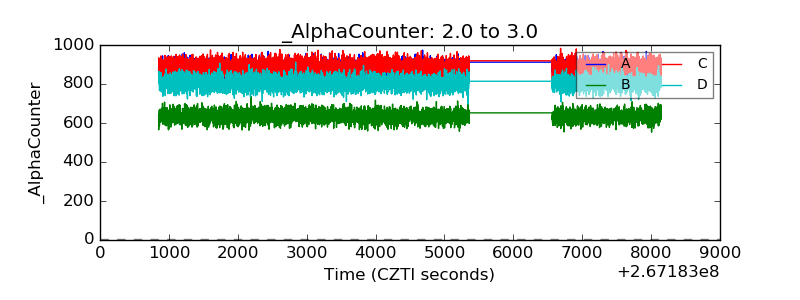 |
| _CPM_Rate |  |
| CZT Counter | 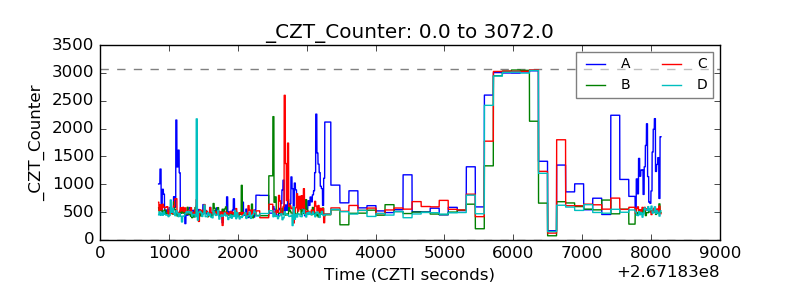 |
| +2.5 Volts monitor |  |
| +5 Volts monitor |  |
| _ROLL_ROT | 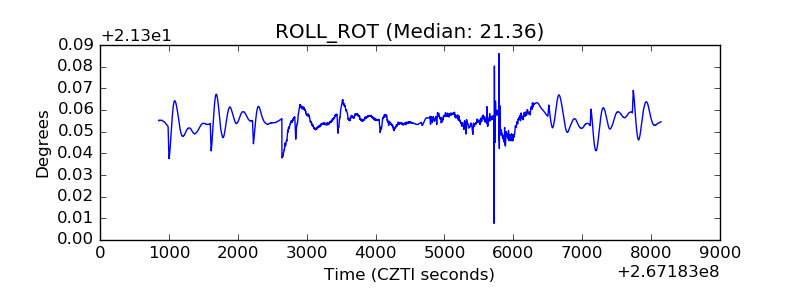 |
| _Roll_DEC | 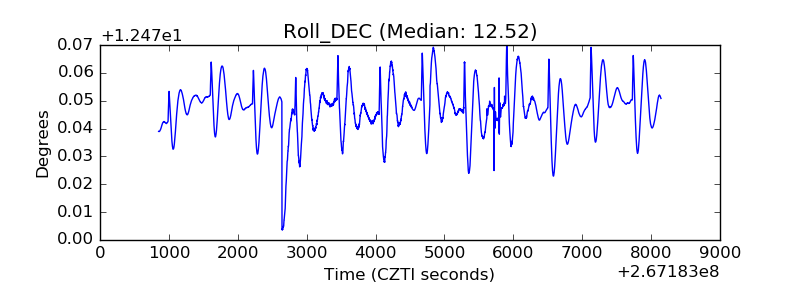 |
| _Roll_RA | 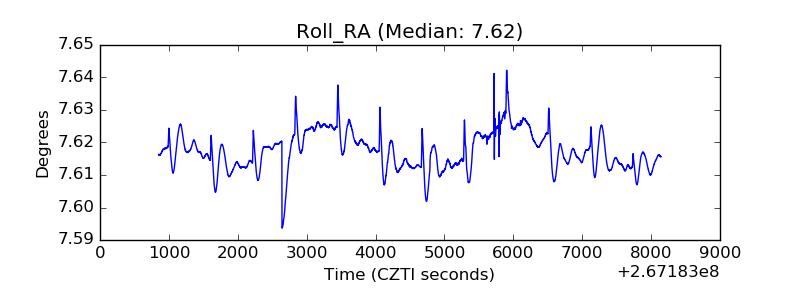 |
| Veto Counter | 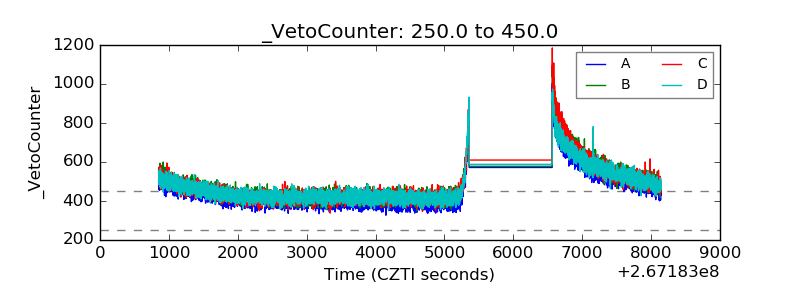 |