| Param | Original file | Final file |
|---|---|---|
| Filename | modeM0/AS1A04_203T01_9000002180_14748cztM0_level2.evt | modeM0/AS1A04_203T01_9000002180_14748cztM0_level2_quad_clean.evt |
| Size (bytes) | 578,295,360 | 75,021,120 |
| Size | 551.5 MB | 71.5 MB |
| Events in quadrant A | 6,065,639 | 456,187 |
| Events in quadrant B | 3,562,484 | 472,137 |
| Events in quadrant C | 4,178,107 | 448,980 |
| Events in quadrant D | 3,280,188 | 453,474 |
| Mode M0 | |||
|---|---|---|---|
| Quadrant | BADHDUFLAG | Total packets | Discarded packets |
| A | 0 | 22418 | 2 |
| B | 0 | 14399 | 1 |
| C | 0 | 16597 | 1 |
| D | 0 | 13465 | 1 |
| Mode SS | |||
|---|---|---|---|
| Quadrant | BADHDUFLAG | Total packets | Discarded packets |
| A | 0 | 130 | 0 |
| B | 0 | 130 | 0 |
| C | 0 | 130 | 0 |
| D | 0 | 130 | 0 |
| Mode M9 | |||
|---|---|---|---|
| Quadrant | BADHDUFLAG | Total packets | Discarded packets |
| A | 0 | 12 | 0 |
| B | 0 | 12 | 0 |
| C | 0 | 12 | 0 |
| D | 0 | 12 | 0 |
| Quadrant | Total seconds | Saturated seconds | Saturation percentage |
|---|---|---|---|
| A | 6308 | 515 | 8.164236% |
| B | 6308 | 103 | 1.632847% |
| C | 6308 | 192 | 3.043754% |
| D | 6308 | 76 | 1.204819% |
Noise dominated data is calculated using 1-second bins in cleaned event files. If a bin has >2000 counts, and if more than 50% of those come from <1% of pixels, then it is considered to be noise-dominated and hence unusable.
| Quadrant | # 1 sec bins | Bins with >0 counts | Bins with >2000 counts | High rate bins dominated by noise | Noise dominated (total time) | Noise dominated (detector-on time) | Marked lightcurve |
|---|---|---|---|---|---|---|---|
| A | 7579 | 6309 | 364 | 364 | 4.80% | 5.77% | 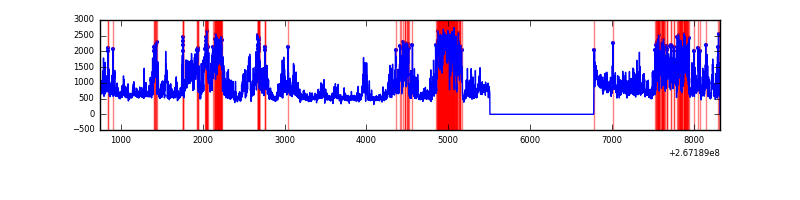 |
| B | 7579 | 6309 | 6 | 6 | 0.08% | 0.10% | 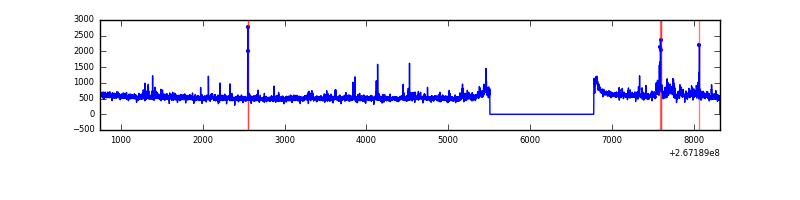 |
| C | 7579 | 6309 | 91 | 91 | 1.20% | 1.44% | 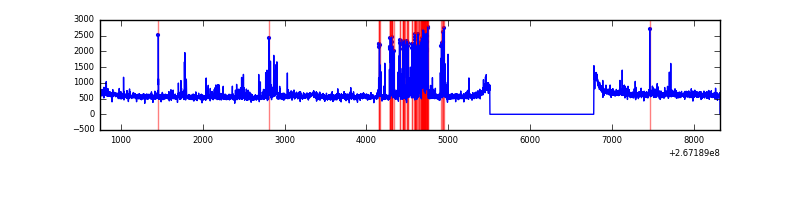 |
| D | 7579 | 6309 | 4 | 4 | 0.05% | 0.06% | 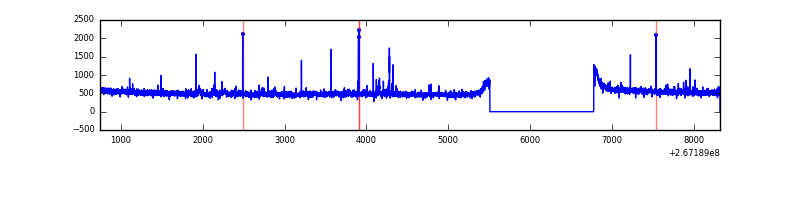 |
Top three noisy pixels from each quadrant. If the there are fewer than three noisy pixels in the level2.evt file, extra rows are filled as -1
| Pixel properties | Quadrant properties | ||||||
|---|---|---|---|---|---|---|---|
| Quadrant | DetID | PixID | Counts | Sigma | Mean | Median | Sigma |
| A | 8 | 15 | 2654211 | 15385.89 | 862 | 846 | 172.5 |
| A | 12 | 189 | 62110 | 355.25 | 862 | 846 | 172.5 |
| A | 3 | 1 | 18130 | 100.22 | 862 | 846 | 172.5 |
| B | 10 | 16 | 72263 | 446.78 | 859 | 842 | 159.9 |
| B | 0 | 205 | 48069 | 295.43 | 859 | 842 | 159.9 |
| B | 0 | 229 | 21699 | 130.47 | 859 | 842 | 159.9 |
| C | 4 | 254 | 531020 | 2840.09 | 821 | 827 | 186.7 |
| C | 3 | 233 | 433053 | 2315.31 | 821 | 827 | 186.7 |
| C | 13 | 61 | 5963 | 27.51 | 821 | 827 | 186.7 |
| D | 2 | 120 | 33809 | 149.47 | 845 | 825 | 220.7 |
| D | 2 | 234 | 26161 | 114.82 | 845 | 825 | 220.7 |
| D | 1 | 255 | 13906 | 59.28 | 845 | 825 | 220.7 |
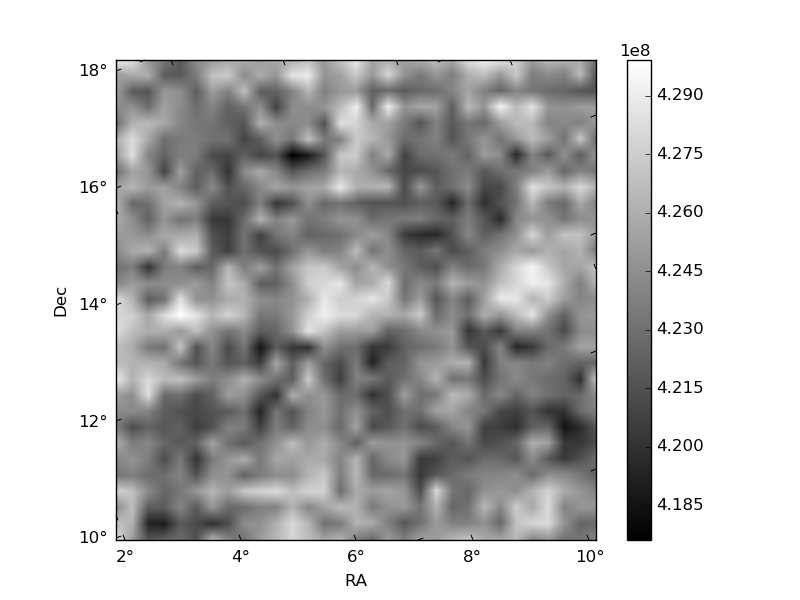
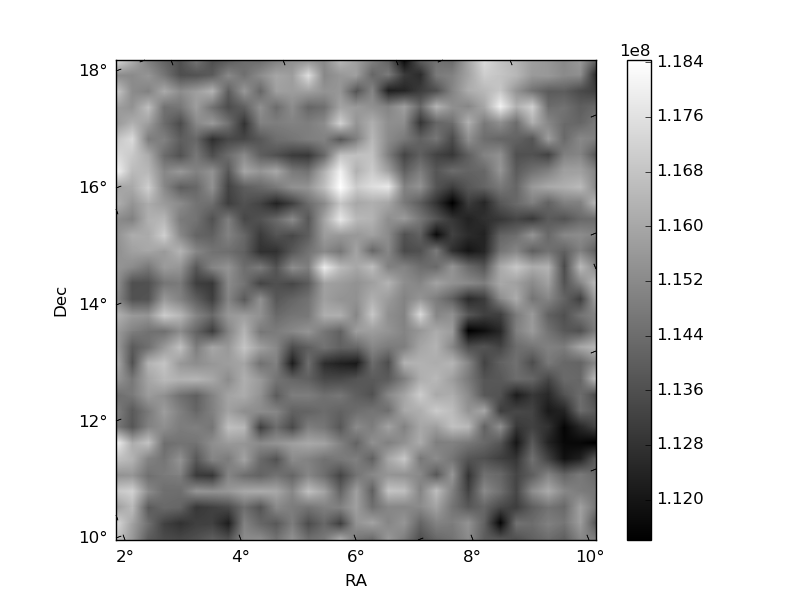
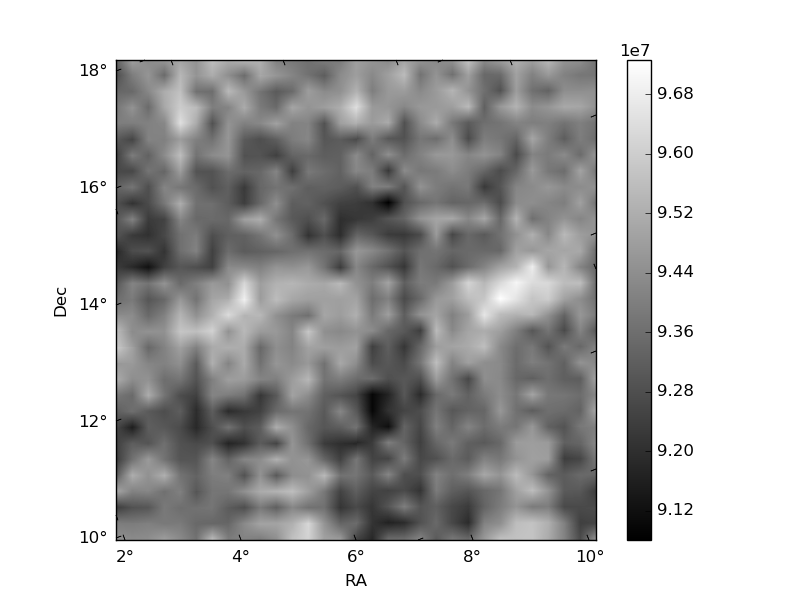
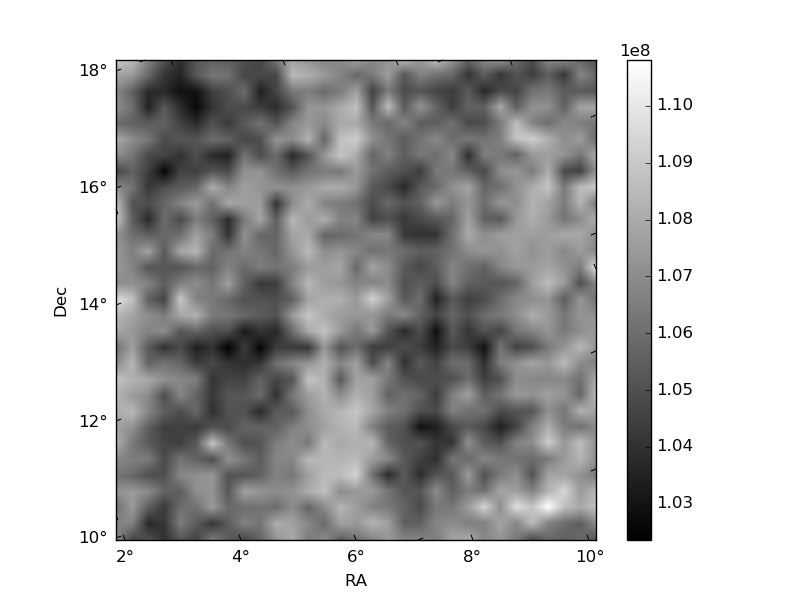
Histogram calculated using DETX and DETY for each event in the final _common_clean file
| Quadrant A | 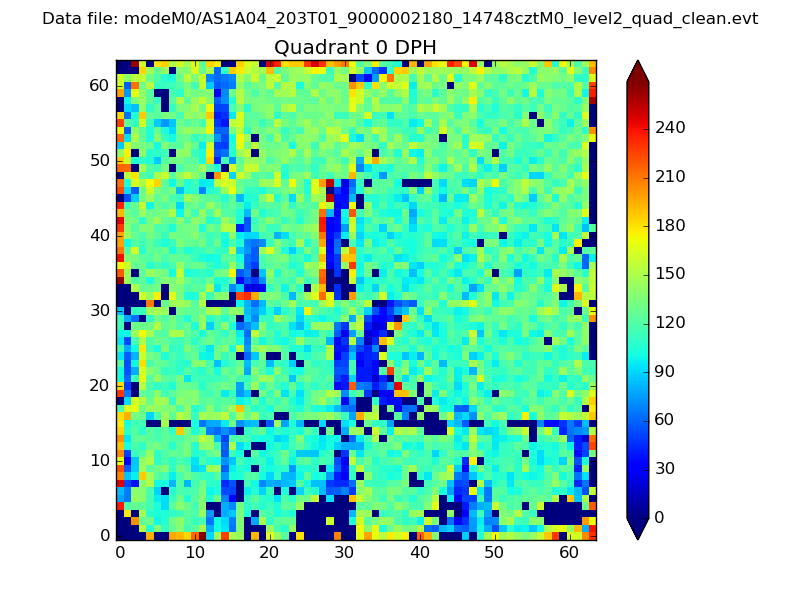 |
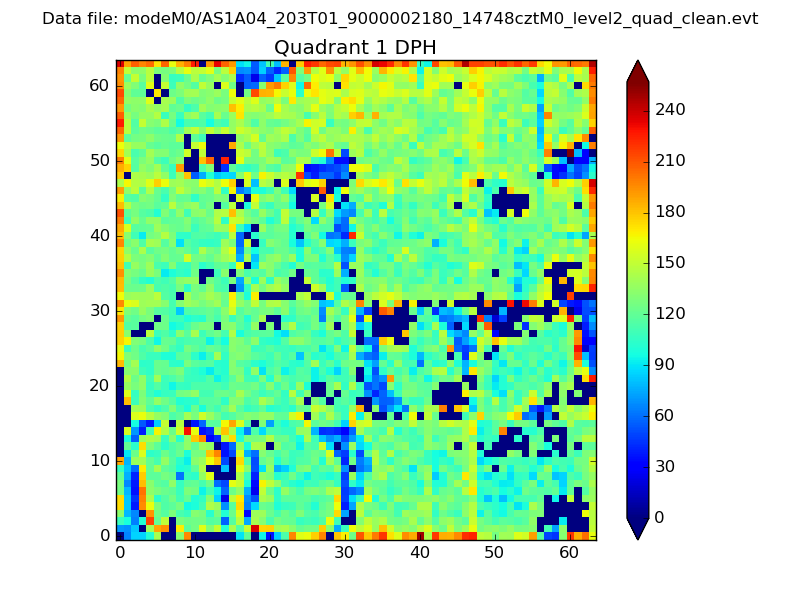 |
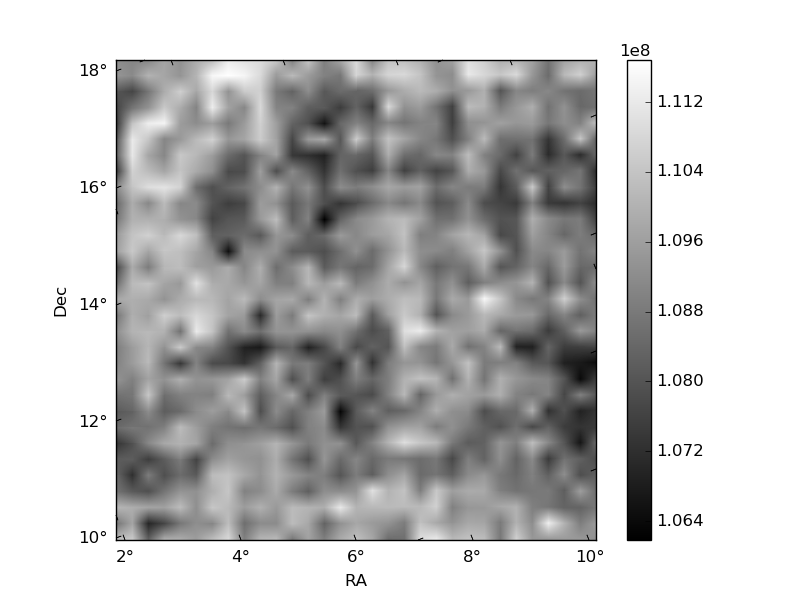
Quadrant B |
|---|---|---|---|
| Quadrant D | 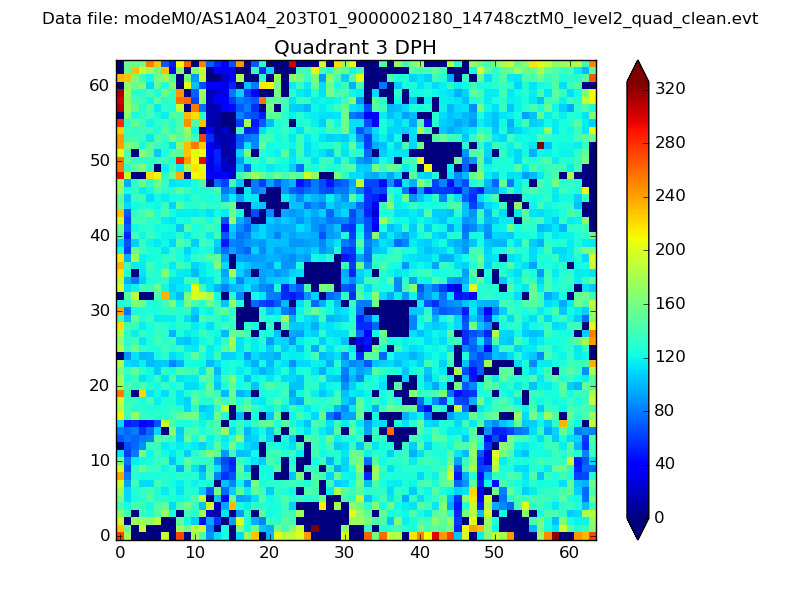 |
 |
Quadrant C |
| Plot type | Count rate plots | Images |
|---|---|---|
| Comparison with Poisson distribution Blue bars denote a histogram of data divided into 1 sec bins. Red curve is a Poisson curve with rate = median count rate of data. |
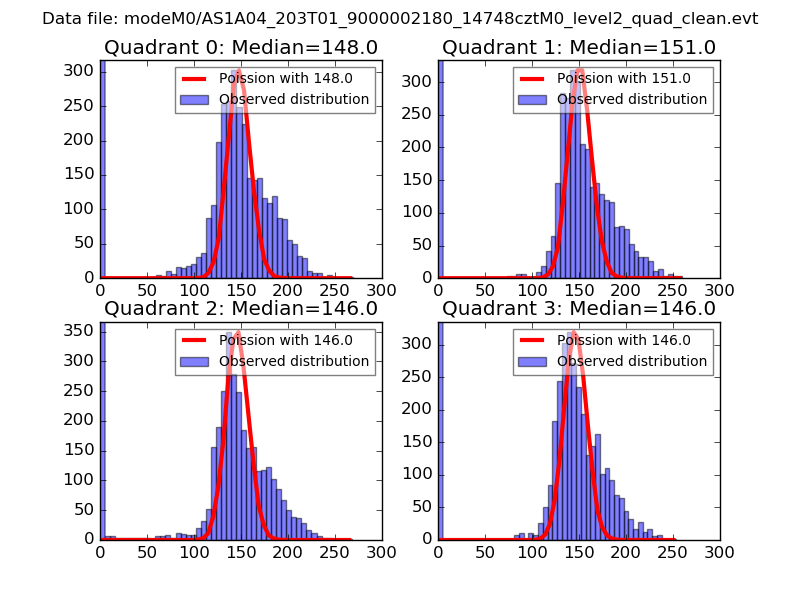 |
 |
| Quadrant-wise count rates Data is divided into 100 sec bins |
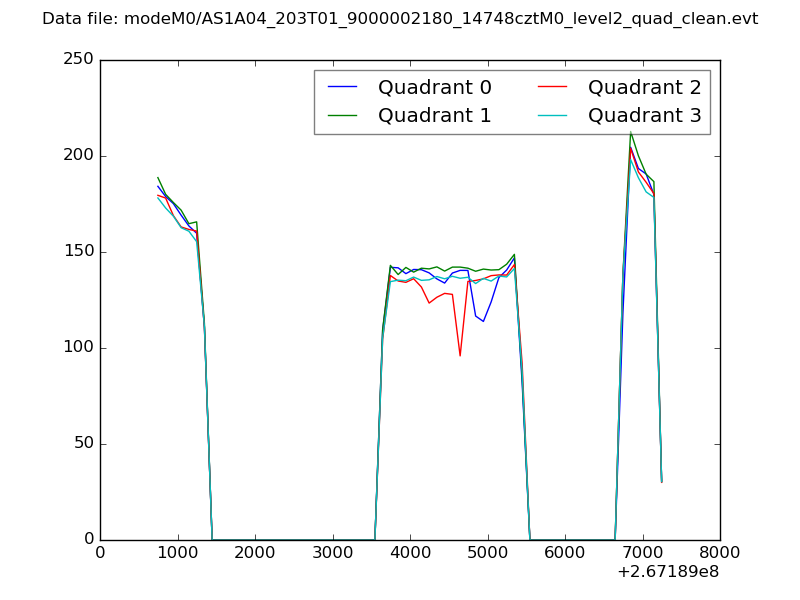 |
|
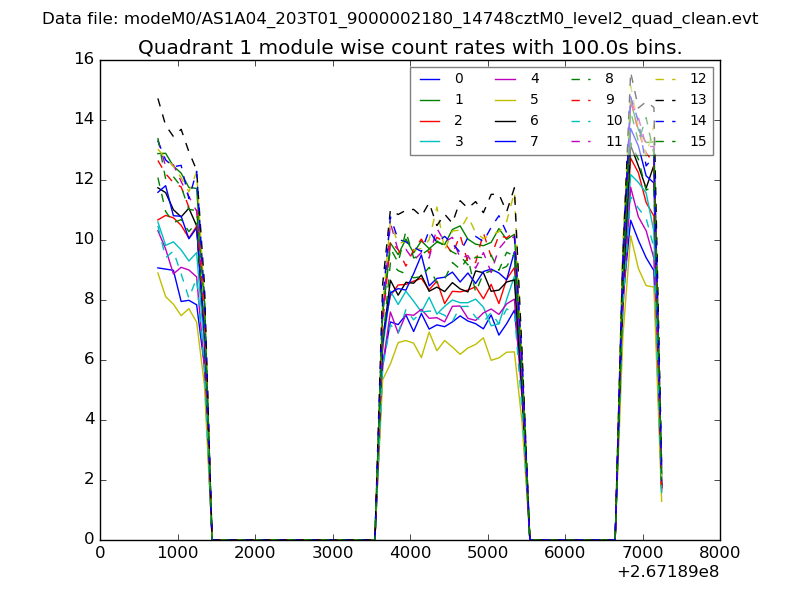
| Module-wise count rates for Quadrant A Data is divided into 100 sec bins |
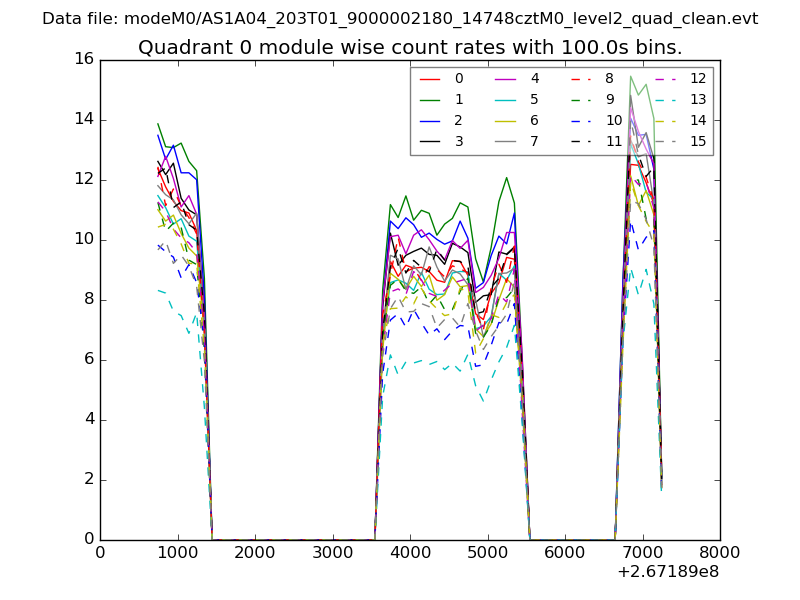 |
 |
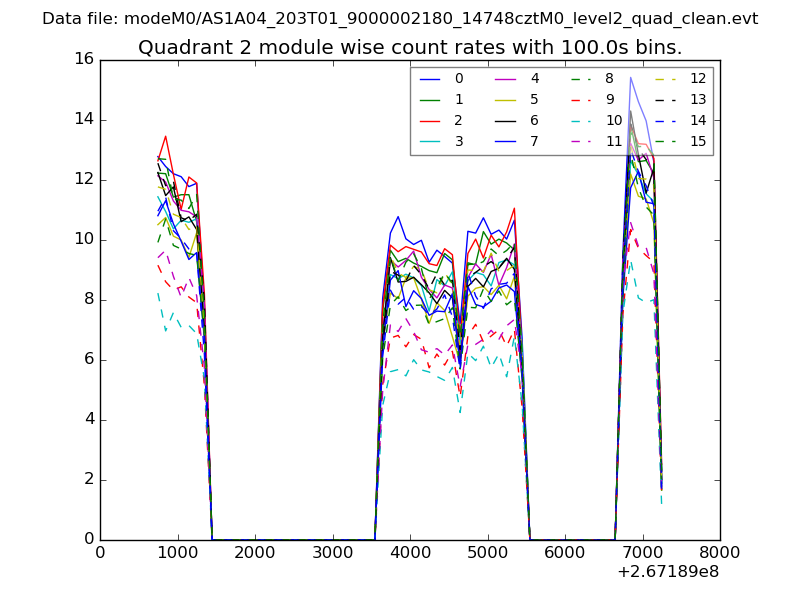
| Module-wise count rates for Quadrant B Data is divided into 100 sec bins |
 |
 |
| Module-wise count rates for Quadrant C Data is divided into 100 sec bins |
 |
 |
| Module-wise count rates for Quadrant D Data is divided into 100 sec bins |
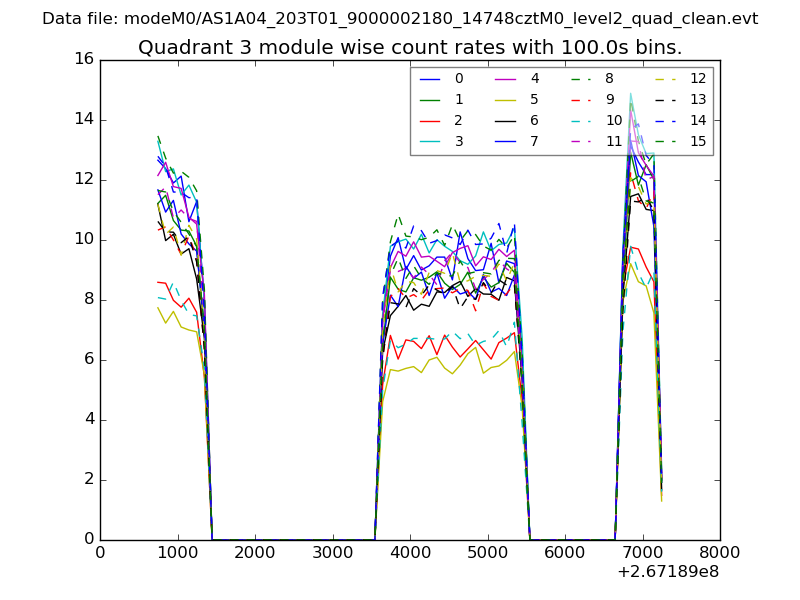 |
 |
| Parameter | Plot |
|---|---|
| CZT HV Monitor | 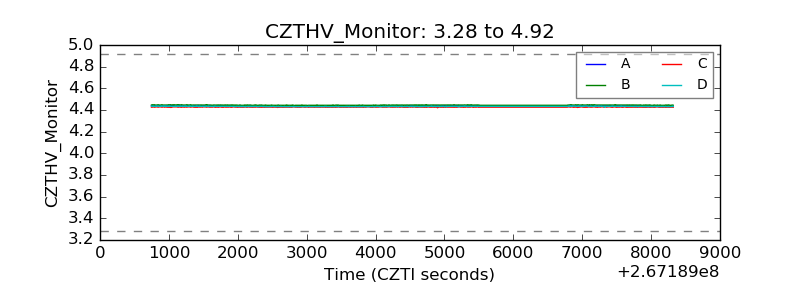 |
| D_VDD | 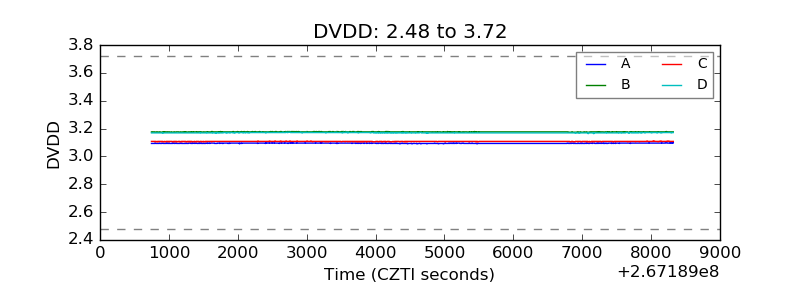 |
| Temperature 1 | 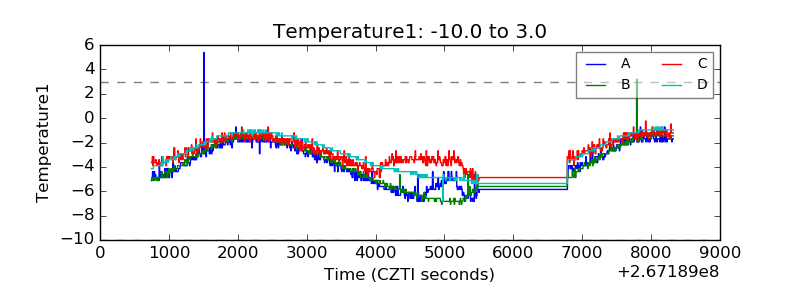 |
| Veto HV Monitor |  |
| Veto LLD | 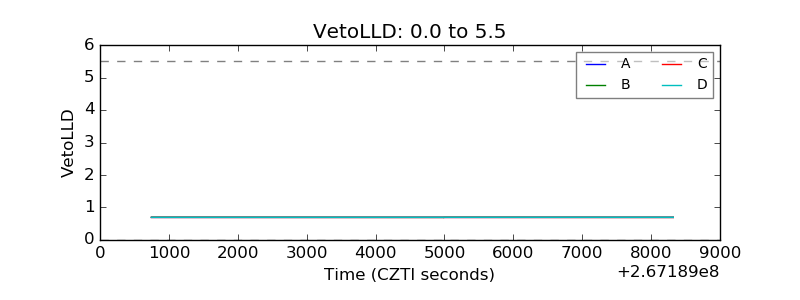 |
| Alpha Counter |  |
| _CPM_Rate | 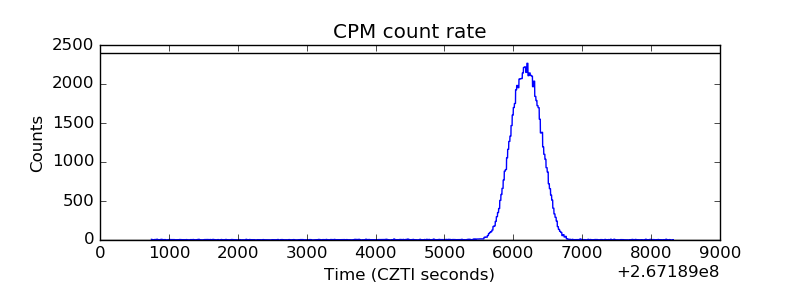 |
| CZT Counter | 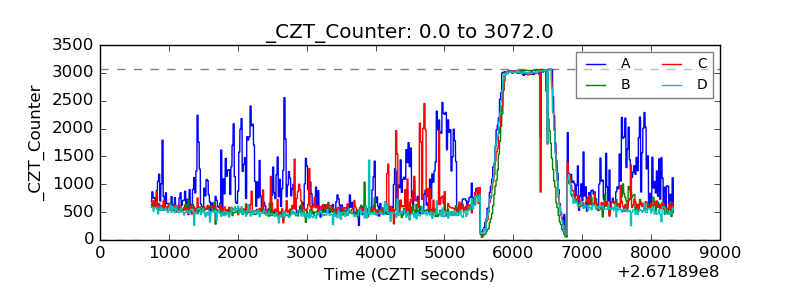 |
| +2.5 Volts monitor | 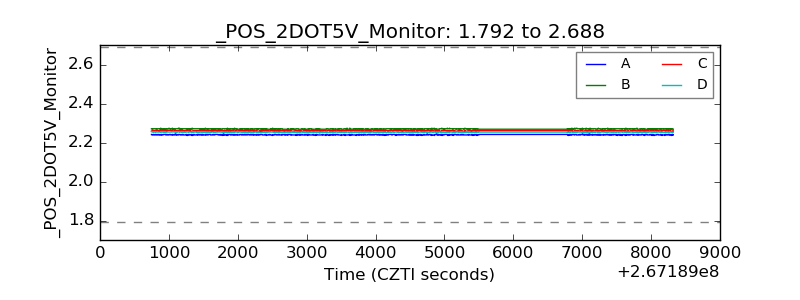 |
| +5 Volts monitor |  |
| _ROLL_ROT | 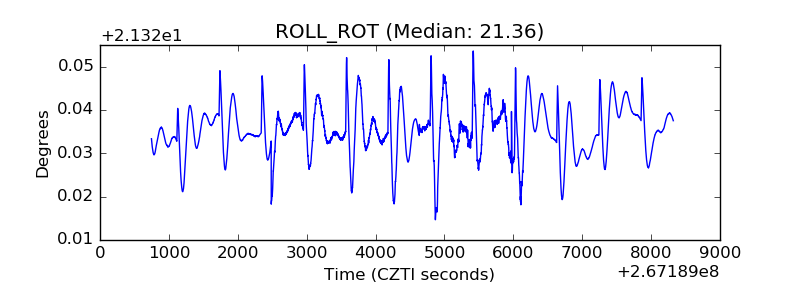 |
| _Roll_DEC | 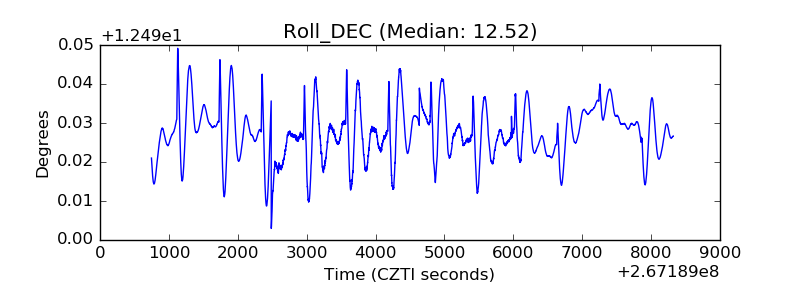 |
| _Roll_RA | 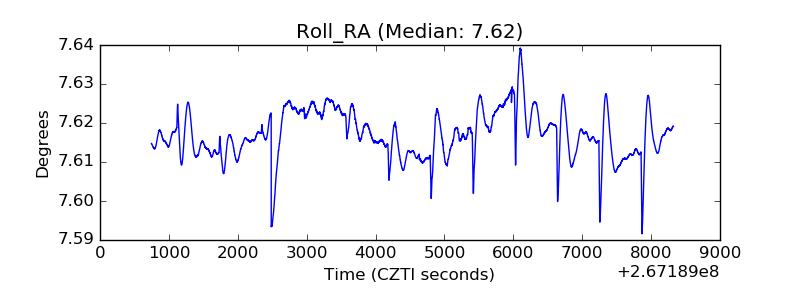 |
| Veto Counter | 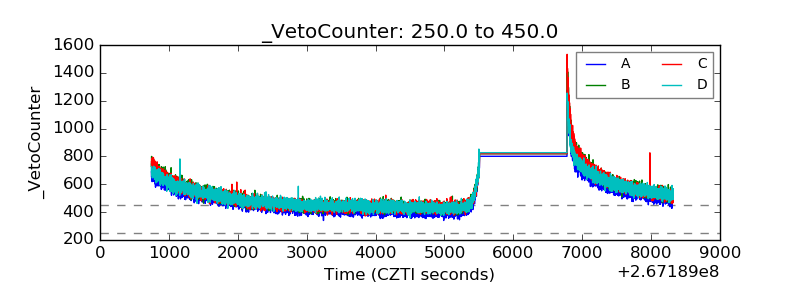 |