| Param | Original file | Final file |
|---|---|---|
| Filename | modeM0/AS1A04_203T01_9000002180_14750cztM0_level2.evt | modeM0/AS1A04_203T01_9000002180_14750cztM0_level2_quad_clean.evt |
| Size (bytes) | 576,360,000 | 63,262,080 |
| Size | 549.7 MB | 60.3 MB |
| Events in quadrant A | 6,941,880 | 372,709 |
| Events in quadrant B | 3,353,586 | 378,870 |
| Events in quadrant C | 3,608,604 | 372,844 |
| Events in quadrant D | 3,141,036 | 367,954 |
| Mode M0 | |||
|---|---|---|---|
| Quadrant | BADHDUFLAG | Total packets | Discarded packets |
| A | 0 | 24800 | 2 |
| B | 0 | 13553 | 1 |
| C | 0 | 14547 | 1 |
| D | 0 | 12916 | 1 |
| Mode SS | |||
|---|---|---|---|
| Quadrant | BADHDUFLAG | Total packets | Discarded packets |
| A | 0 | 124 | 0 |
| B | 0 | 124 | 0 |
| C | 0 | 124 | 0 |
| D | 0 | 124 | 0 |
| Mode M9 | |||
|---|---|---|---|
| Quadrant | BADHDUFLAG | Total packets | Discarded packets |
| A | 0 | 12 | 0 |
| B | 0 | 12 | 0 |
| C | 0 | 12 | 0 |
| D | 0 | 12 | 0 |
| Quadrant | Total seconds | Saturated seconds | Saturation percentage |
|---|---|---|---|
| A | 6050 | 1187 | 19.619835% |
| B | 6050 | 143 | 2.363636% |
| C | 6050 | 108 | 1.785124% |
| D | 6050 | 94 | 1.553719% |
Noise dominated data is calculated using 1-second bins in cleaned event files. If a bin has >2000 counts, and if more than 50% of those come from <1% of pixels, then it is considered to be noise-dominated and hence unusable.
| Quadrant | # 1 sec bins | Bins with >0 counts | Bins with >2000 counts | High rate bins dominated by noise | Noise dominated (total time) | Noise dominated (detector-on time) | Marked lightcurve |
|---|---|---|---|---|---|---|---|
| A | 7325 | 6050 | 818 | 818 | 11.17% | 13.52% | 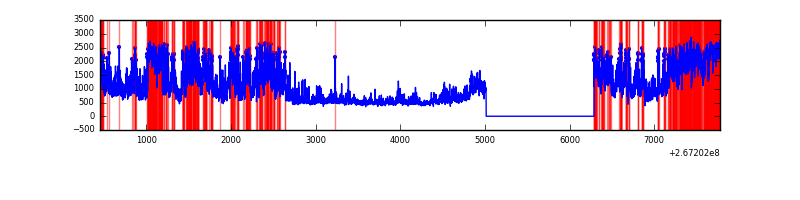 |
| B | 7326 | 6051 | 7 | 7 | 0.10% | 0.12% | 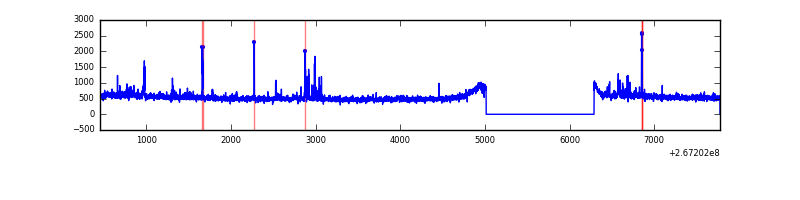 |
| C | 7326 | 6051 | 13 | 13 | 0.18% | 0.21% | 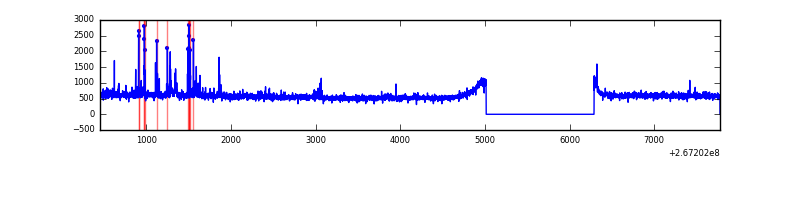 |
| D | 7326 | 6051 | 5 | 5 | 0.07% | 0.08% | 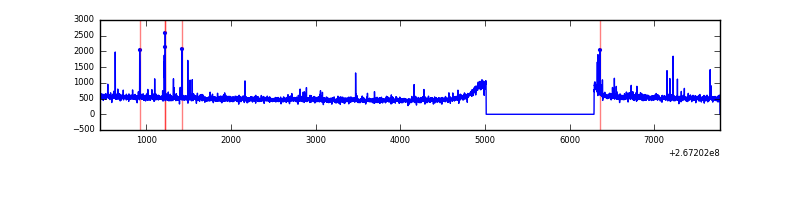 |
Top three noisy pixels from each quadrant. If the there are fewer than three noisy pixels in the level2.evt file, extra rows are filled as -1
| Pixel properties | Quadrant properties | ||||||
|---|---|---|---|---|---|---|---|
| Quadrant | DetID | PixID | Counts | Sigma | Mean | Median | Sigma |
| A | 8 | 15 | 3786798 | 23958.05 | 786 | 771 | 158.0 |
| A | 3 | 1 | 65783 | 411.4 | 786 | 771 | 158.0 |
| A | 12 | 189 | 44173 | 274.65 | 786 | 771 | 158.0 |
| B | 4 | 142 | 84516 | 541.97 | 818 | 799 | 154.5 |
| B | 0 | 205 | 24842 | 155.65 | 818 | 799 | 154.5 |
| B | 0 | 228 | 21326 | 132.89 | 818 | 799 | 154.5 |
| C | 3 | 233 | 354239 | 1938.8 | 794 | 799 | 182.3 |
| C | 4 | 254 | 116074 | 632.34 | 794 | 799 | 182.3 |
| C | 0 | 207 | 36043 | 193.33 | 794 | 799 | 182.3 |
| D | 2 | 234 | 38613 | 196.11 | 804 | 783 | 192.9 |
| D | 2 | 120 | 26183 | 131.67 | 804 | 783 | 192.9 |
| D | 13 | 172 | 17640 | 87.39 | 804 | 783 | 192.9 |
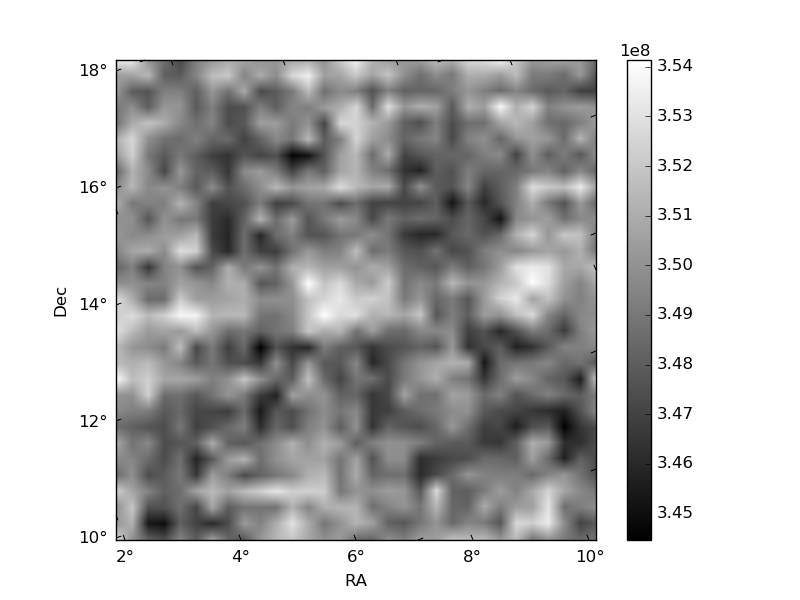
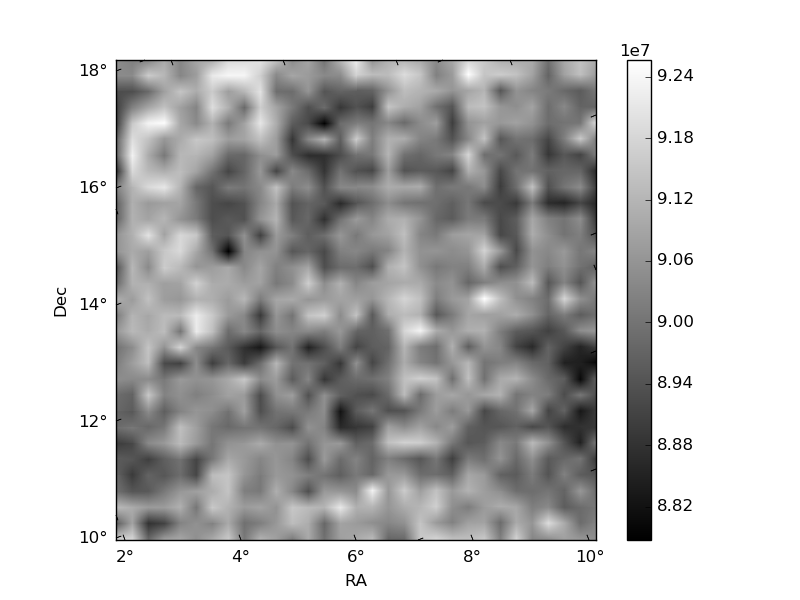
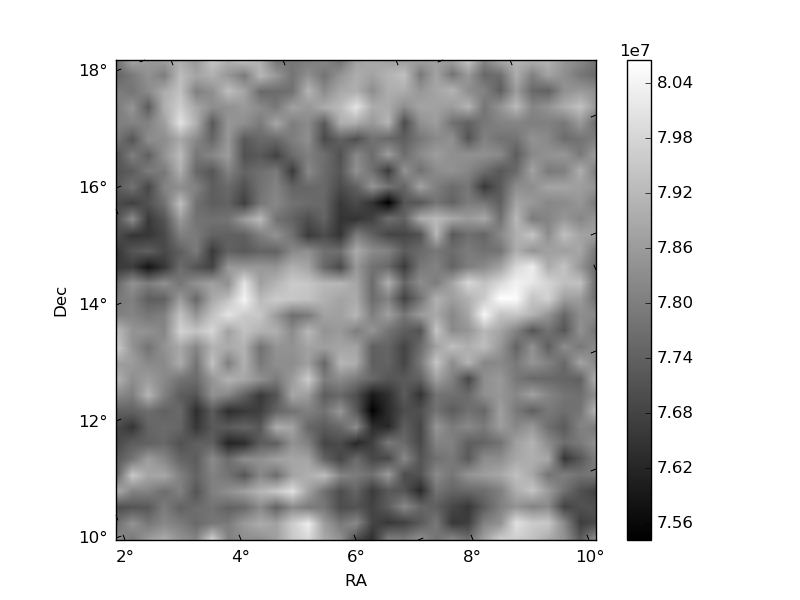
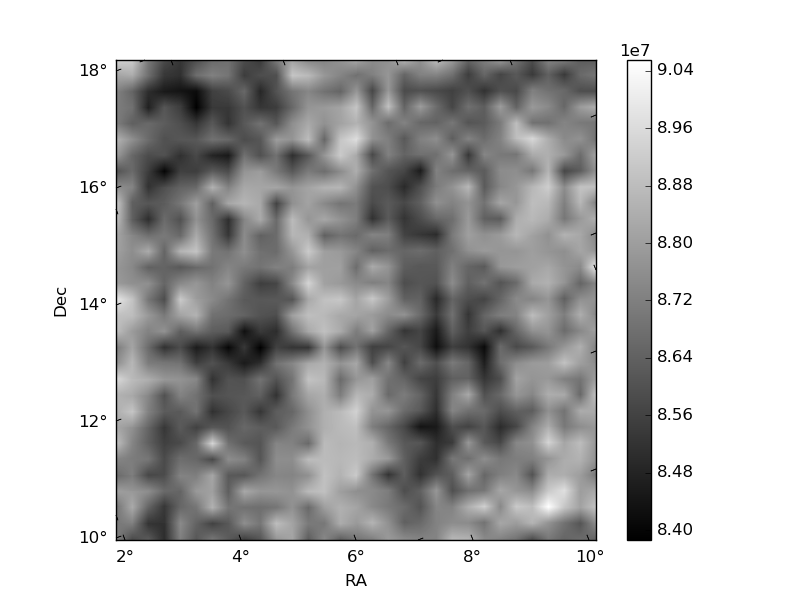
Histogram calculated using DETX and DETY for each event in the final _common_clean file
| Quadrant A | 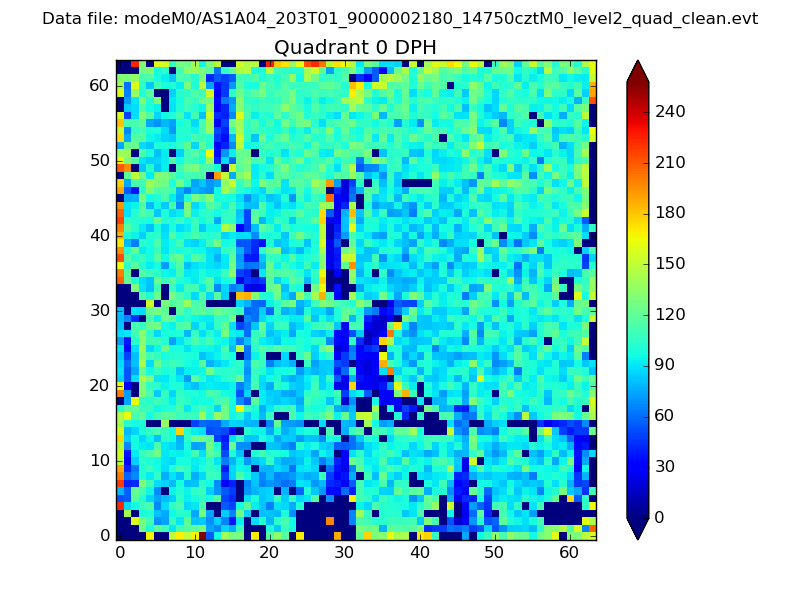 |
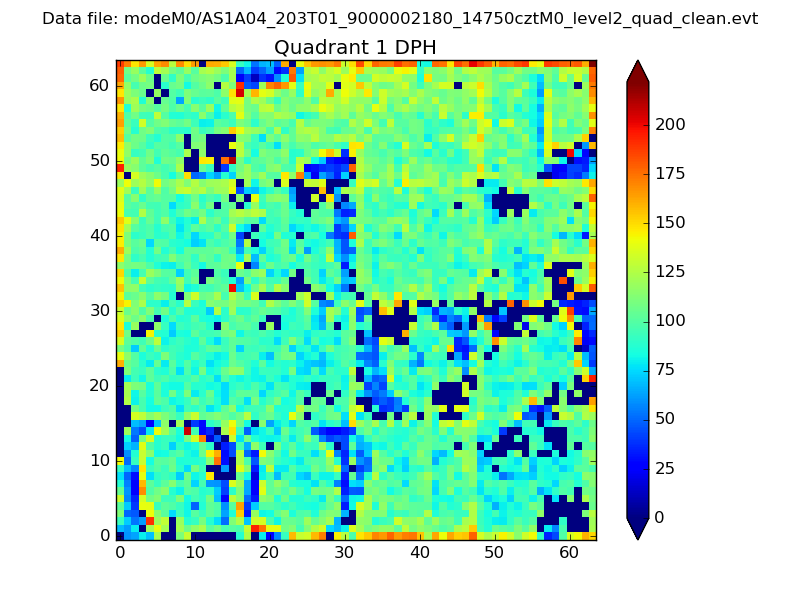 |
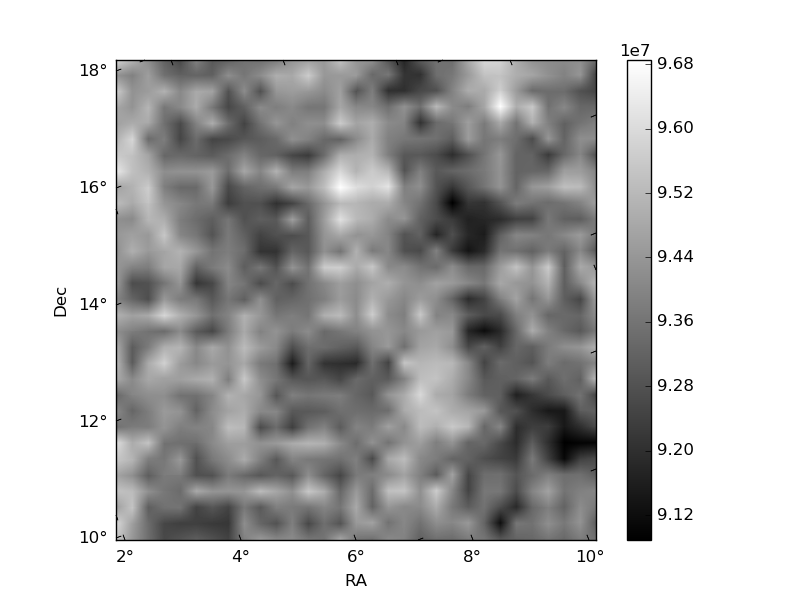
Quadrant B |
|---|---|---|---|
| Quadrant D | 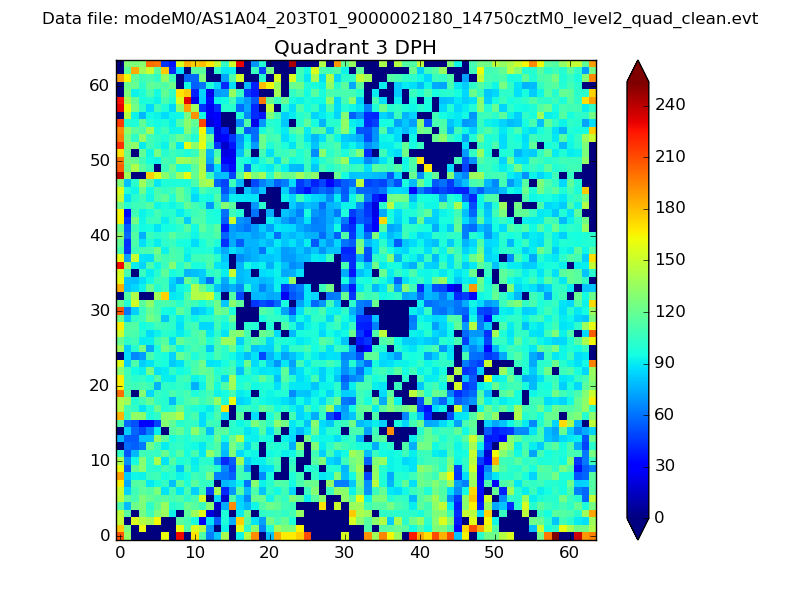 |
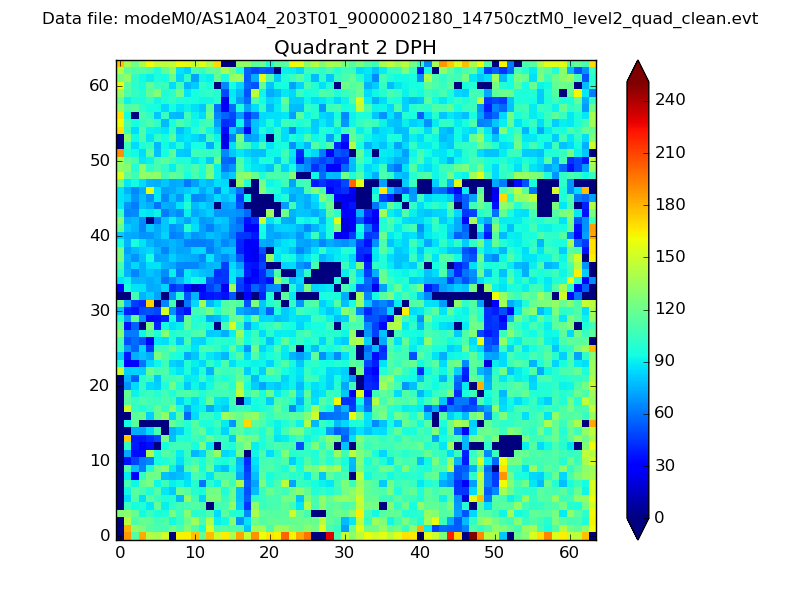 |
Quadrant C |
| Plot type | Count rate plots | Images |
|---|---|---|
| Comparison with Poisson distribution Blue bars denote a histogram of data divided into 1 sec bins. Red curve is a Poisson curve with rate = median count rate of data. |
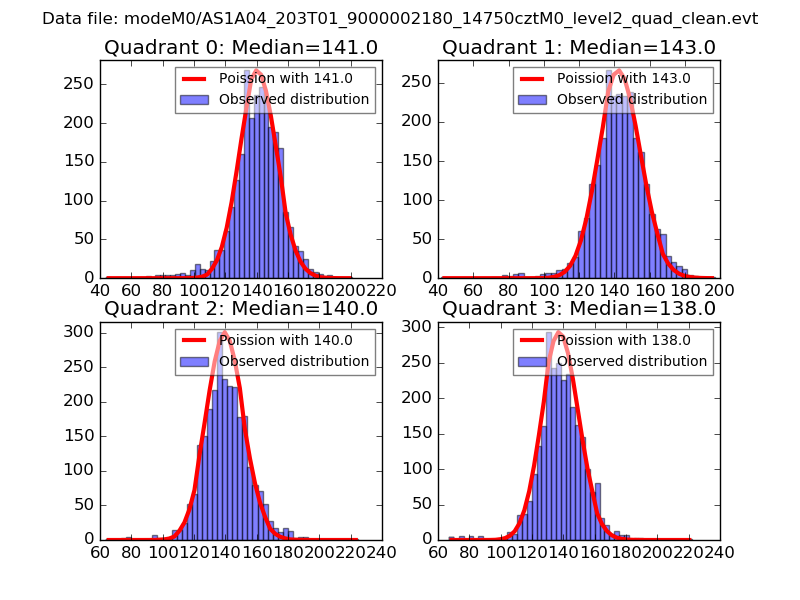 |
 |
| Quadrant-wise count rates Data is divided into 100 sec bins |
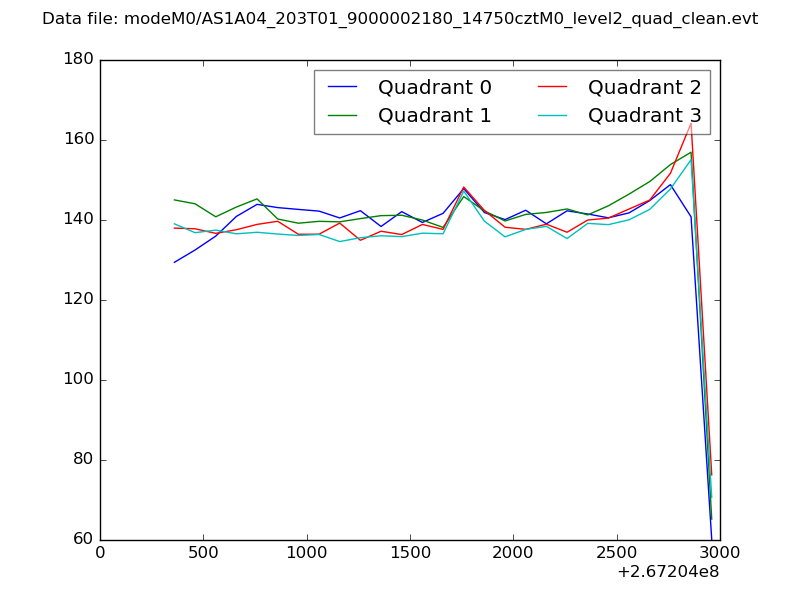 |
|
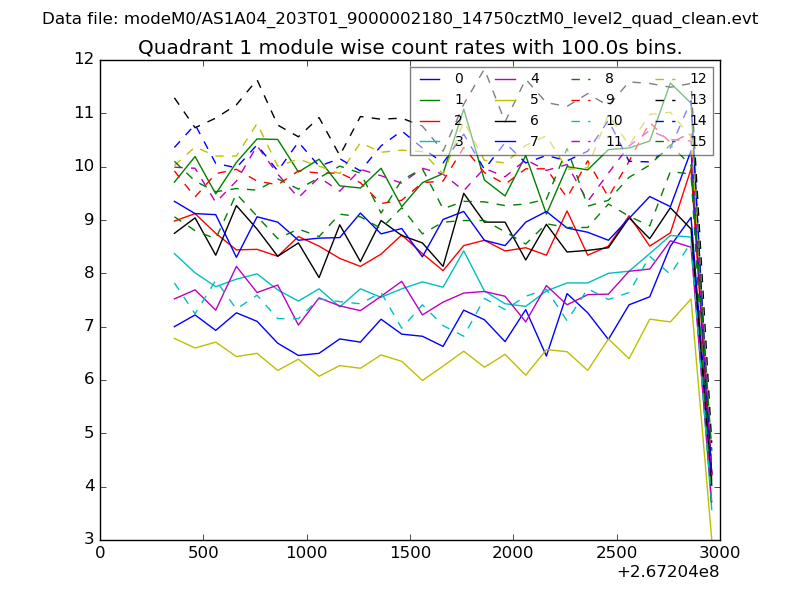
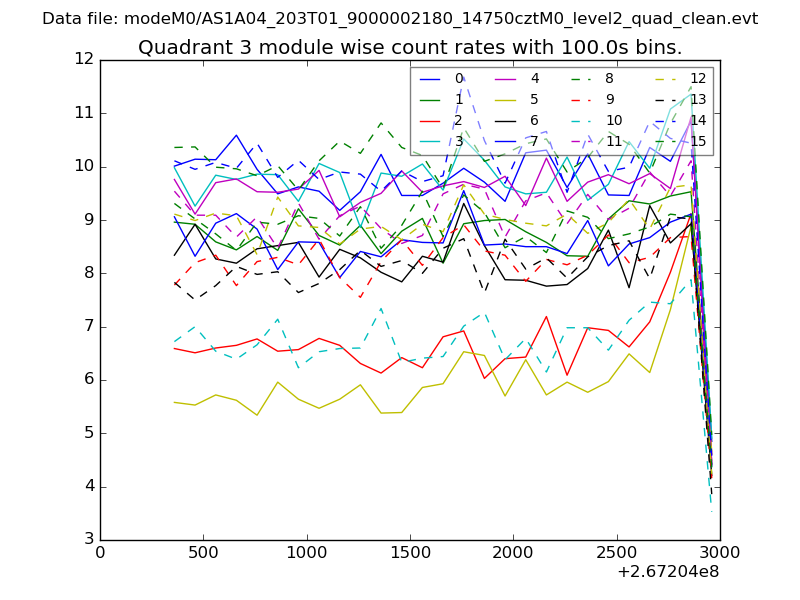
| Module-wise count rates for Quadrant A Data is divided into 100 sec bins |
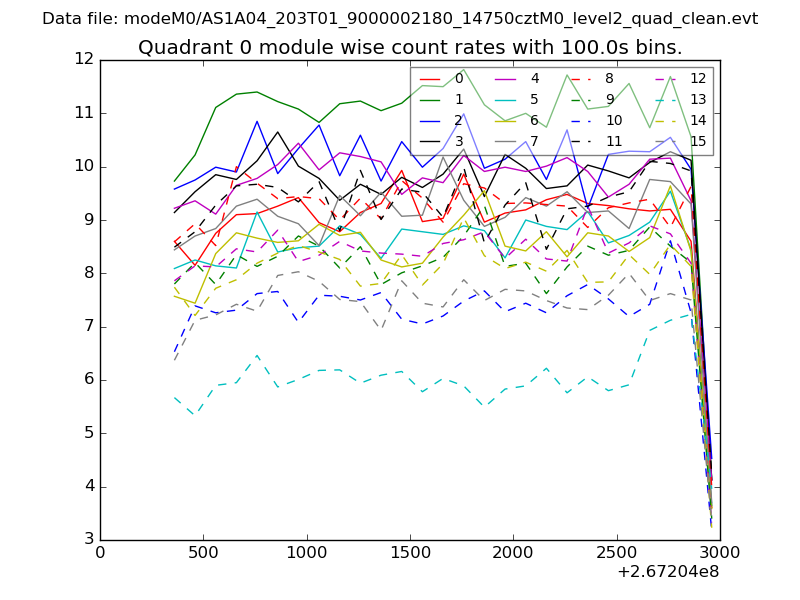 |
 |
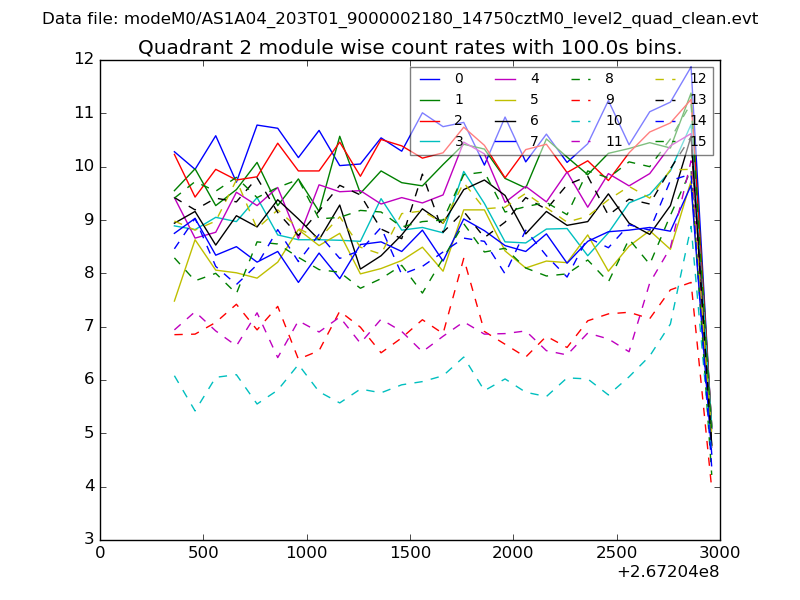
| Module-wise count rates for Quadrant B Data is divided into 100 sec bins |
 |
 |
| Module-wise count rates for Quadrant C Data is divided into 100 sec bins |
 |
 |
| Module-wise count rates for Quadrant D Data is divided into 100 sec bins |
 |
 |
| Parameter | Plot |
|---|---|
| CZT HV Monitor | 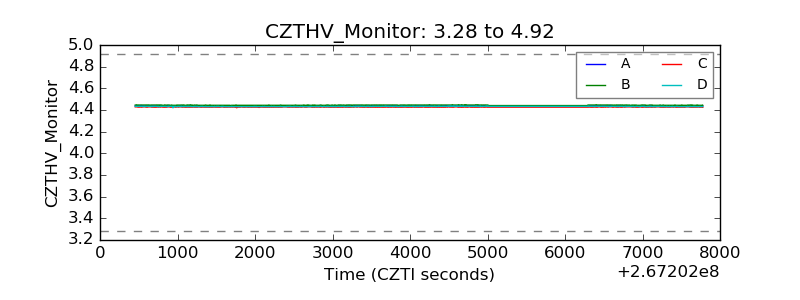 |
| D_VDD | 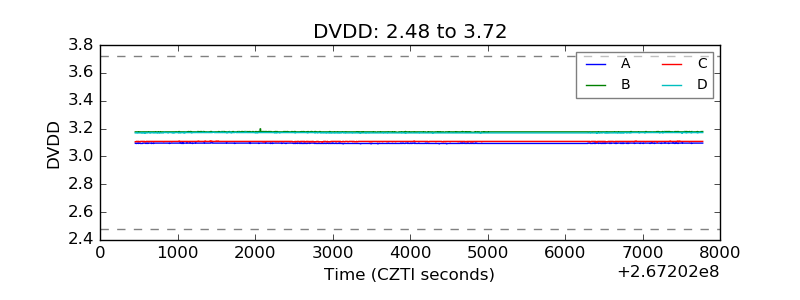 |
| Temperature 1 | 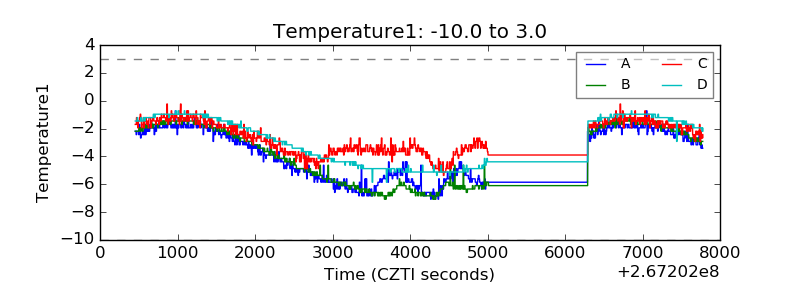 |
| Veto HV Monitor | 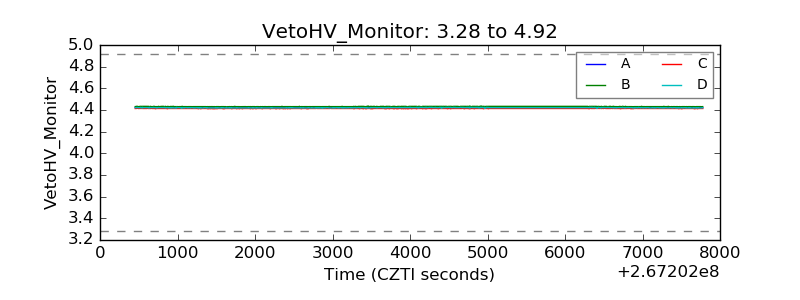 |
| Veto LLD | 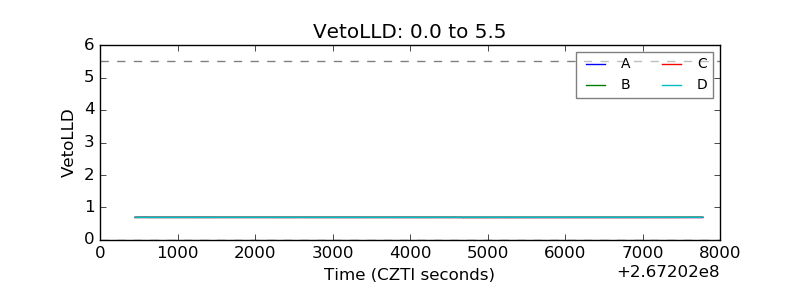 |
| Alpha Counter | 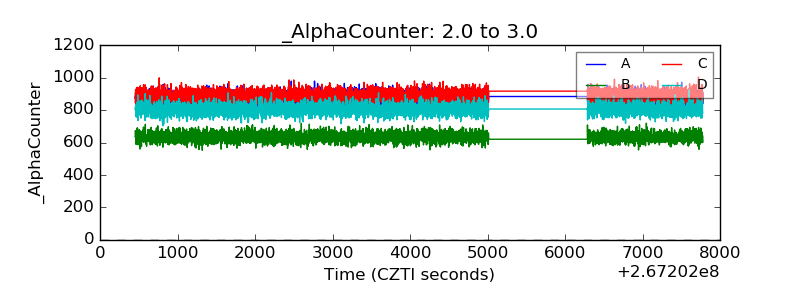 |
| _CPM_Rate | 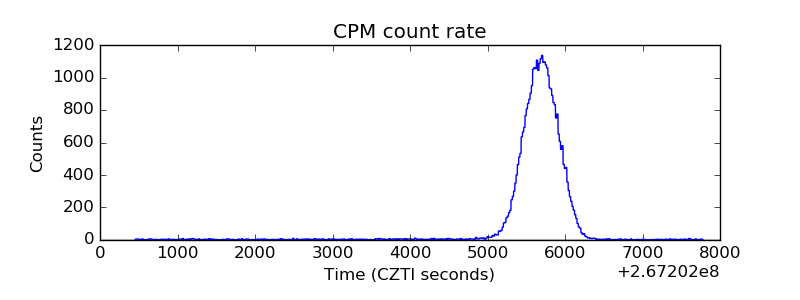 |
| CZT Counter | 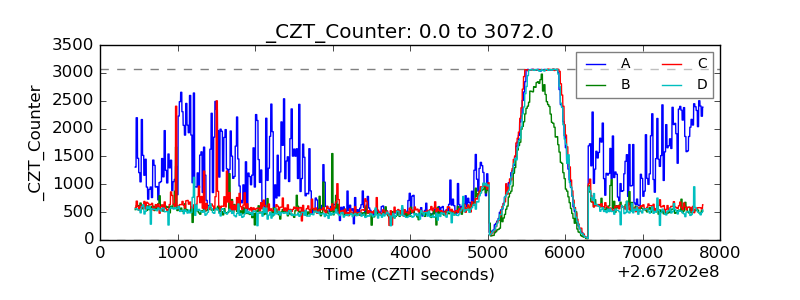 |
| +2.5 Volts monitor |  |
| +5 Volts monitor | 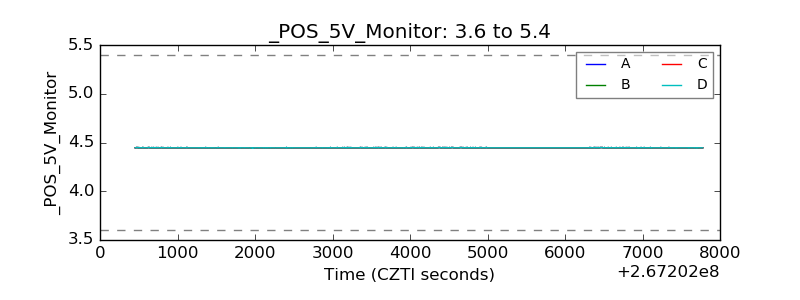 |
| _ROLL_ROT | 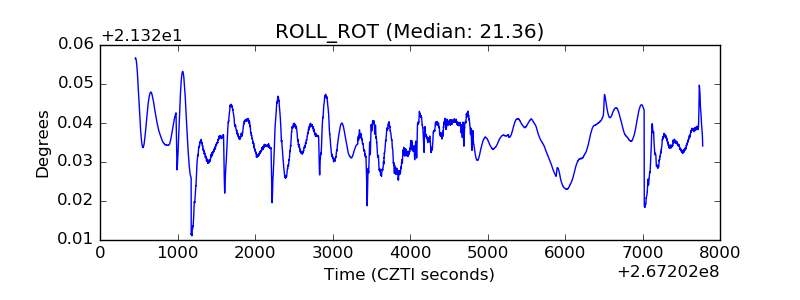 |
| _Roll_DEC | 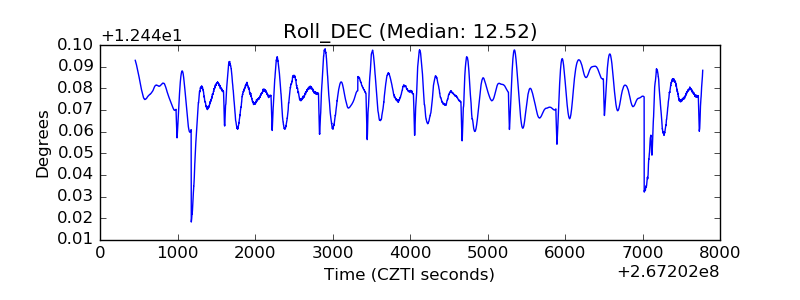 |
| _Roll_RA | 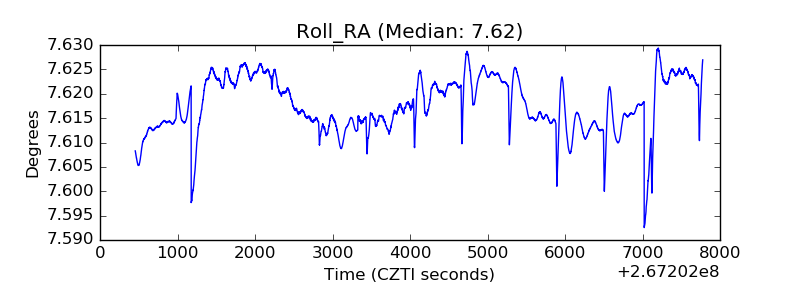 |
| Veto Counter | 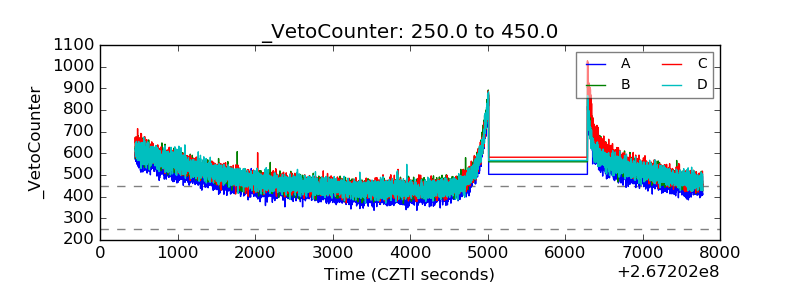 |