| Param | Original file | Final file |
|---|---|---|
| Filename | modeM0/AS1A04_203T01_9000002180_14752cztM0_level2.evt | modeM0/AS1A04_203T01_9000002180_14752cztM0_level2_quad_clean.evt |
| Size (bytes) | 794,623,680 | 76,982,400 |
| Size | 757.8 MB | 73.4 MB |
| Events in quadrant A | 12,377,489 | 420,864 |
| Events in quadrant B | 3,872,989 | 485,586 |
| Events in quadrant C | 4,040,865 | 476,080 |
| Events in quadrant D | 3,311,983 | 471,291 |
| Mode M0 | |||
|---|---|---|---|
| Quadrant | BADHDUFLAG | Total packets | Discarded packets |
| A | 0 | 41503 | 3 |
| B | 0 | 15710 | 2 |
| C | 0 | 16408 | 2 |
| D | 0 | 14322 | 2 |
| Mode SS | |||
|---|---|---|---|
| Quadrant | BADHDUFLAG | Total packets | Discarded packets |
| A | 0 | 138 | 0 |
| B | 0 | 138 | 0 |
| C | 0 | 138 | 0 |
| D | 0 | 138 | 0 |
| Mode M9 | |||
|---|---|---|---|
| Quadrant | BADHDUFLAG | Total packets | Discarded packets |
| A | 0 | 9 | 0 |
| B | 0 | 9 | 0 |
| C | 0 | 9 | 0 |
| D | 0 | 10 | 0 |
| Quadrant | Total seconds | Saturated seconds | Saturation percentage |
|---|---|---|---|
| A | 6840 | 3357 | 49.078947% |
| B | 6840 | 304 | 4.444444% |
| C | 6840 | 122 | 1.783626% |
| D | 6840 | 103 | 1.505848% |
Noise dominated data is calculated using 1-second bins in cleaned event files. If a bin has >2000 counts, and if more than 50% of those come from <1% of pixels, then it is considered to be noise-dominated and hence unusable.
| Quadrant | # 1 sec bins | Bins with >0 counts | Bins with >2000 counts | High rate bins dominated by noise | Noise dominated (total time) | Noise dominated (detector-on time) | Marked lightcurve |
|---|---|---|---|---|---|---|---|
| A | 7511 | 6841 | 2853 | 2853 | 37.98% | 41.70% | 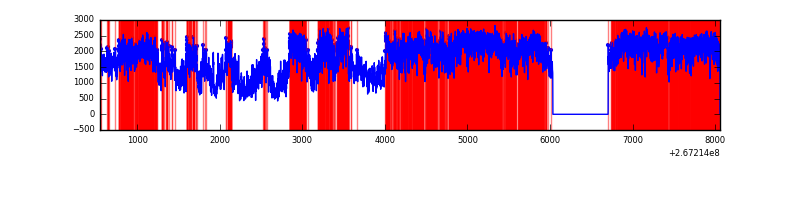 |
| B | 7510 | 6840 | 134 | 134 | 1.78% | 1.96% | 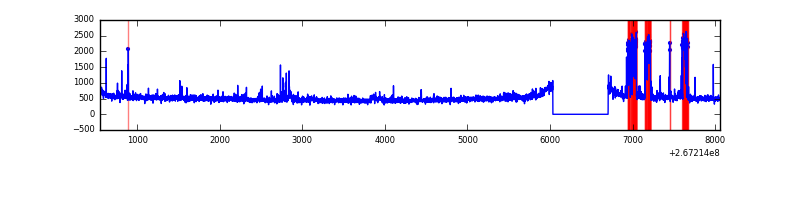 |
| C | 7511 | 6841 | 14 | 14 | 0.19% | 0.20% | 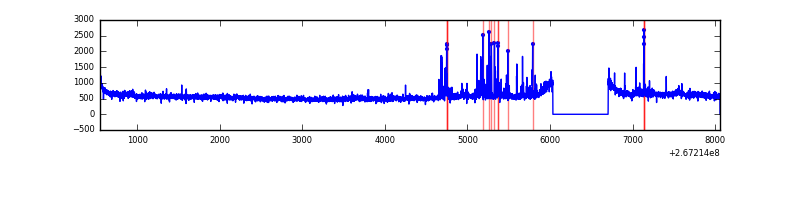 |
| D | 7511 | 6841 | 5 | 5 | 0.07% | 0.07% | 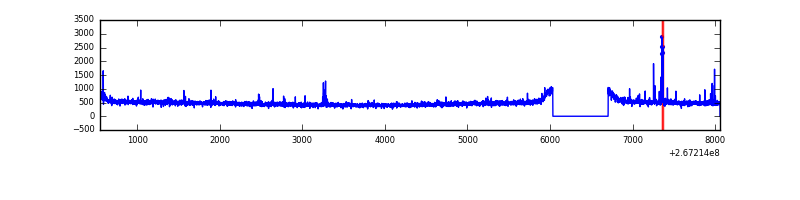 |
Top three noisy pixels from each quadrant. If the there are fewer than three noisy pixels in the level2.evt file, extra rows are filled as -1
| Pixel properties | Quadrant properties | ||||||
|---|---|---|---|---|---|---|---|
| Quadrant | DetID | PixID | Counts | Sigma | Mean | Median | Sigma |
| A | 8 | 15 | 9404071 | 61515.92 | 753 | 738 | 152.9 |
| A | 12 | 189 | 68213 | 441.42 | 753 | 738 | 152.9 |
| A | 3 | 1 | 8301 | 49.48 | 753 | 738 | 152.9 |
| B | 4 | 142 | 434606 | 2659.11 | 850 | 829 | 163.1 |
| B | 0 | 229 | 32745 | 195.65 | 850 | 829 | 163.1 |
| B | 0 | 214 | 30615 | 182.59 | 850 | 829 | 163.1 |
| C | 3 | 233 | 591543 | 3029.27 | 835 | 840 | 195.0 |
| C | 4 | 254 | 168750 | 861.08 | 835 | 840 | 195.0 |
| C | 0 | 207 | 21566 | 106.29 | 835 | 840 | 195.0 |
| D | 2 | 120 | 44883 | 197.98 | 841 | 821 | 222.6 |
| D | 2 | 234 | 43320 | 190.96 | 841 | 821 | 222.6 |
| D | 2 | 14 | 14993 | 63.68 | 841 | 821 | 222.6 |
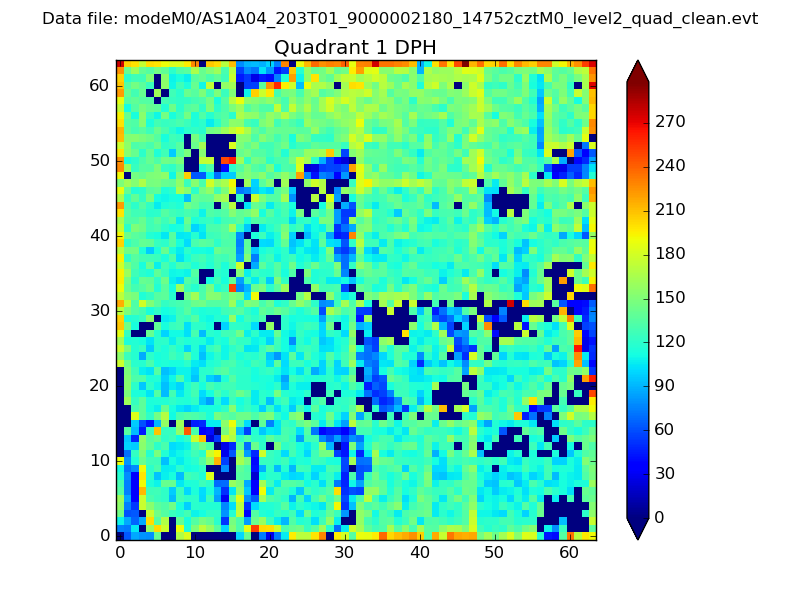
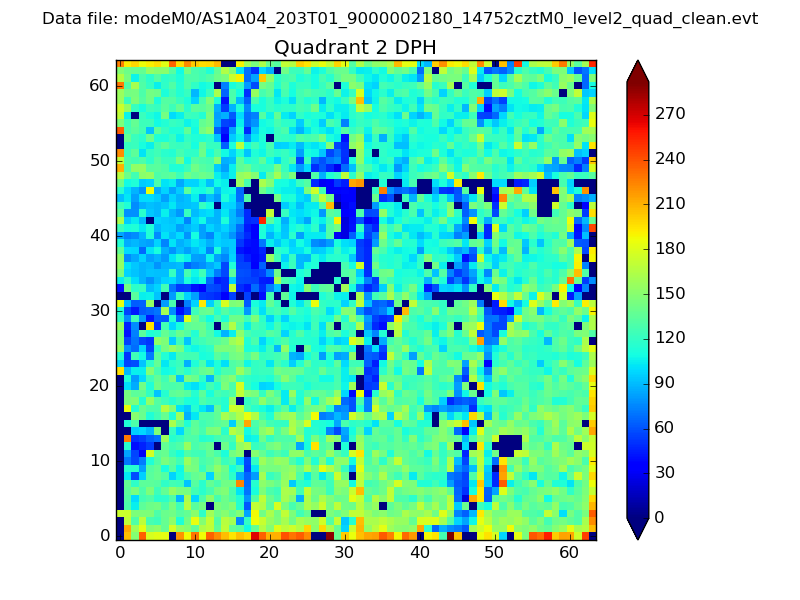
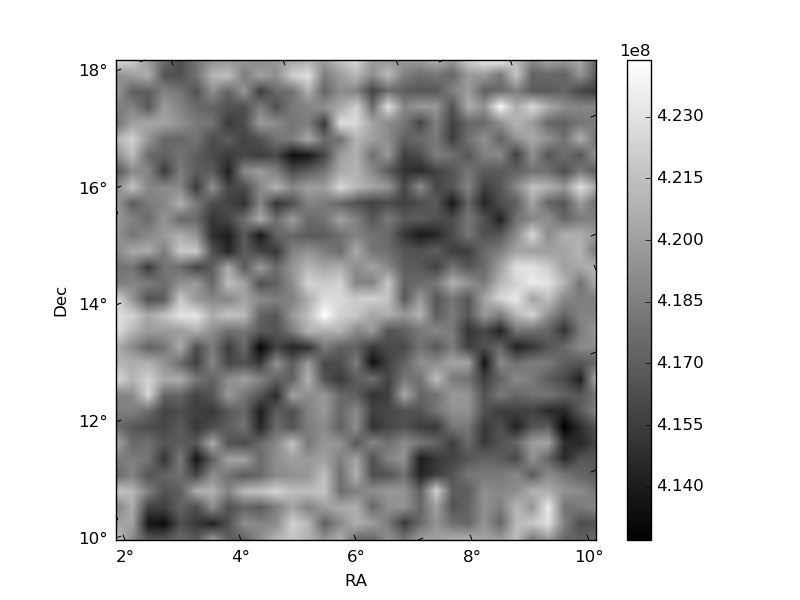
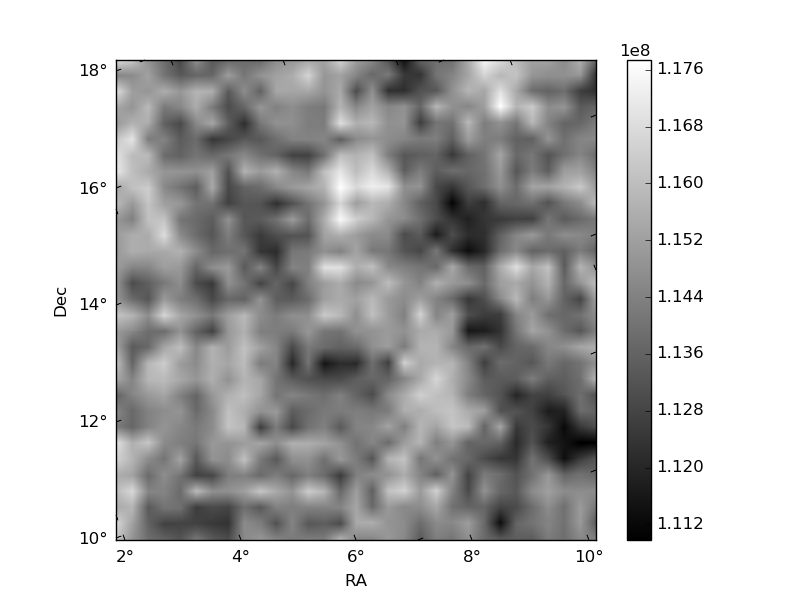
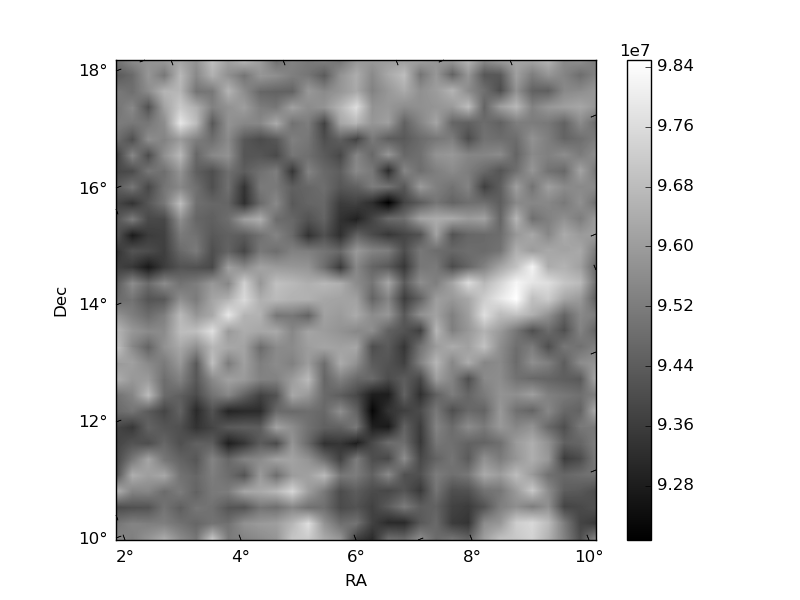
Histogram calculated using DETX and DETY for each event in the final _common_clean file
| Quadrant A |  |
 |
Quadrant B |
|---|---|---|---|
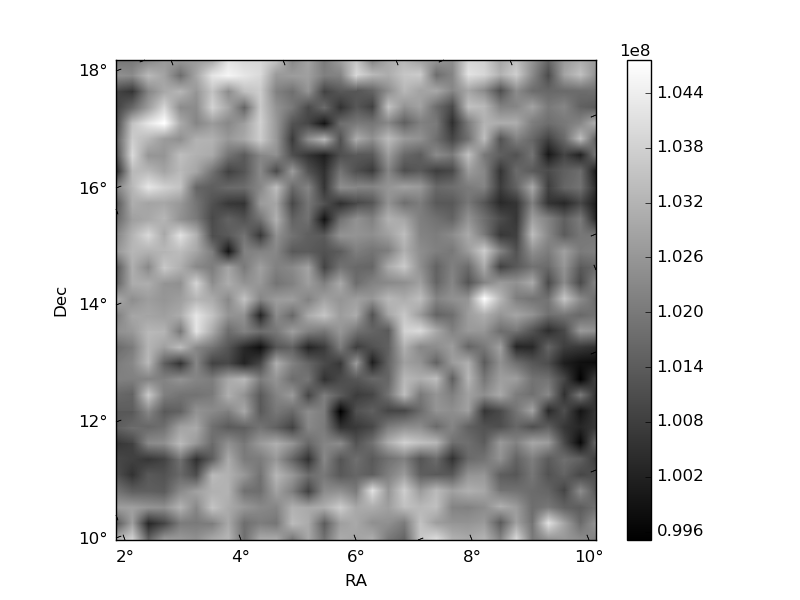
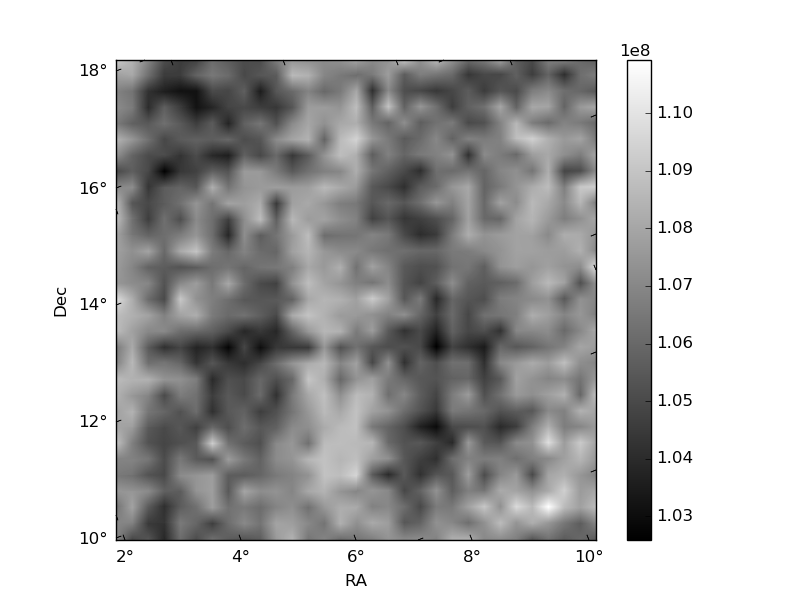
| Quadrant D | 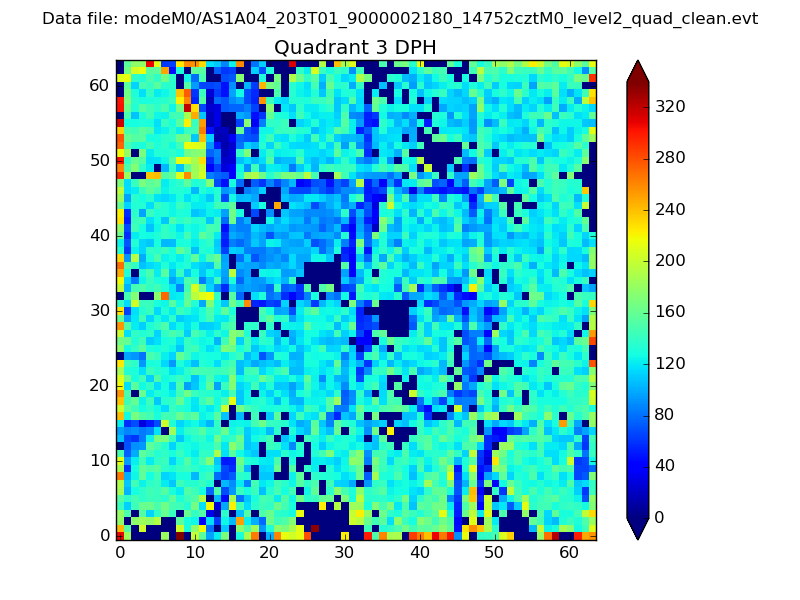 |
 |
Quadrant C |
| Plot type | Count rate plots | Images |
|---|---|---|
| Comparison with Poisson distribution Blue bars denote a histogram of data divided into 1 sec bins. Red curve is a Poisson curve with rate = median count rate of data. |
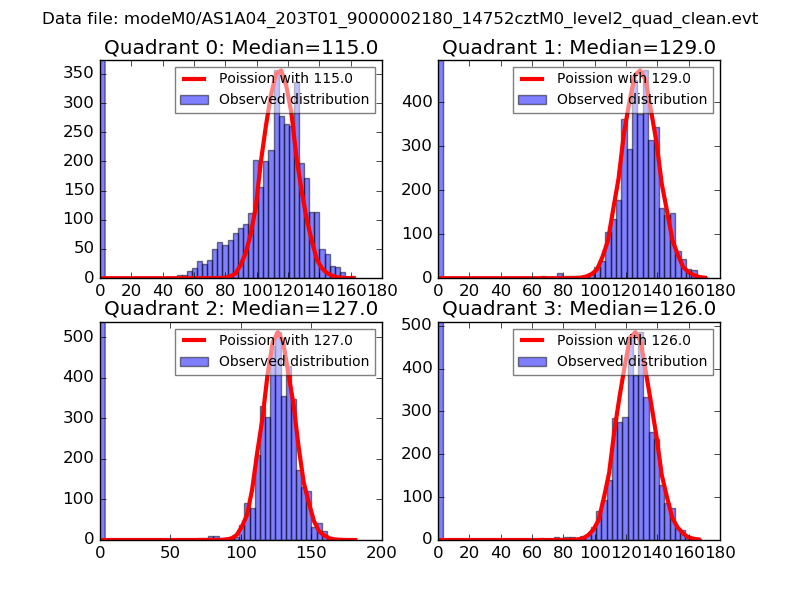 |
 |
| Quadrant-wise count rates Data is divided into 100 sec bins |
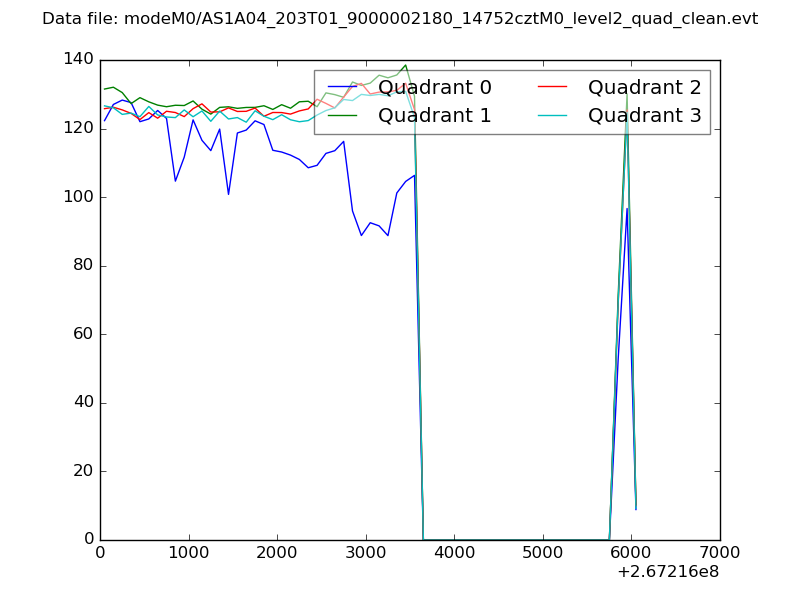 |
|
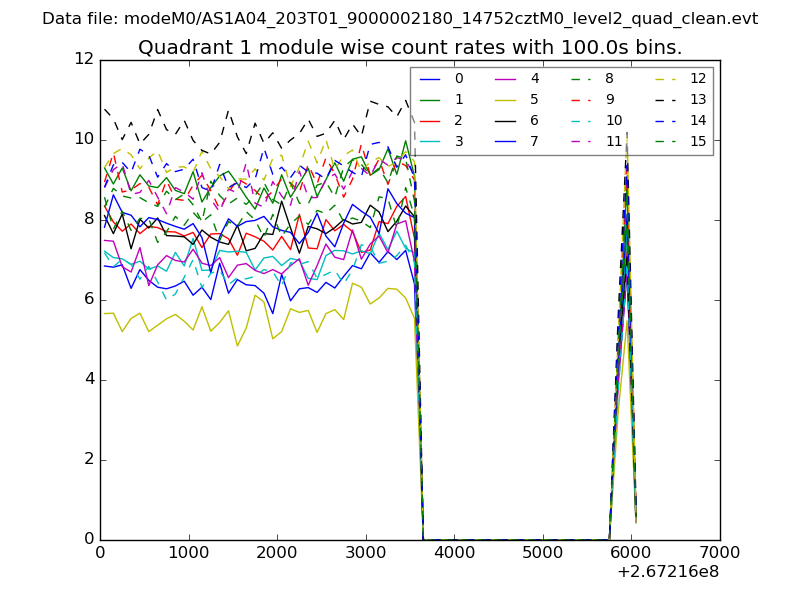
| Module-wise count rates for Quadrant A Data is divided into 100 sec bins |
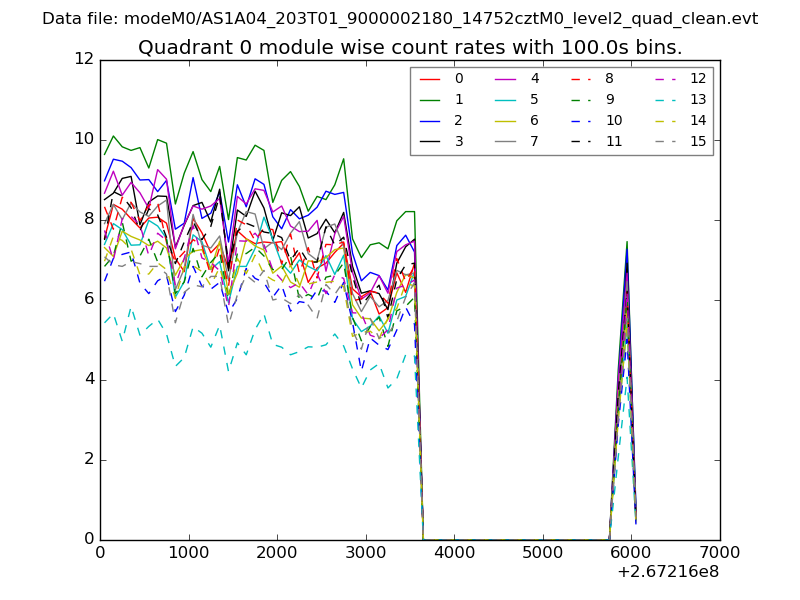 |
 |
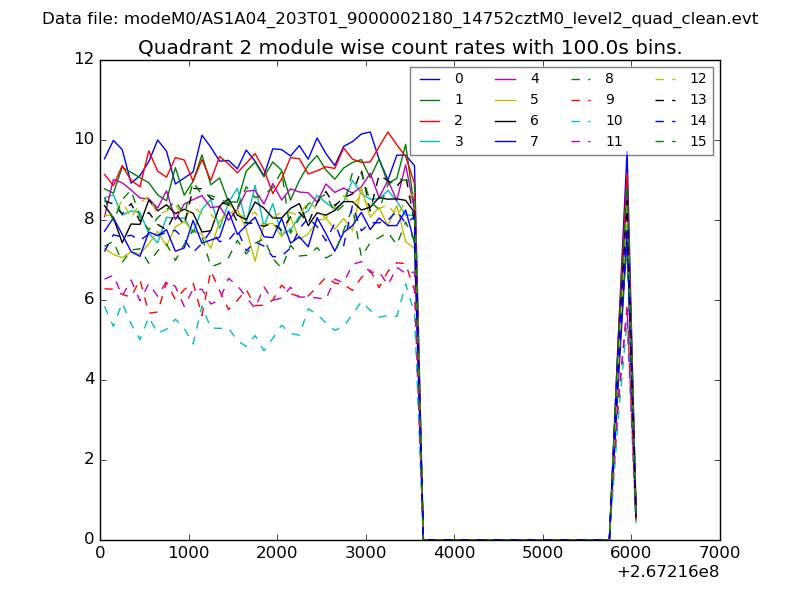
| Module-wise count rates for Quadrant B Data is divided into 100 sec bins |
 |
 |
| Module-wise count rates for Quadrant C Data is divided into 100 sec bins |
 |
 |
| Module-wise count rates for Quadrant D Data is divided into 100 sec bins |
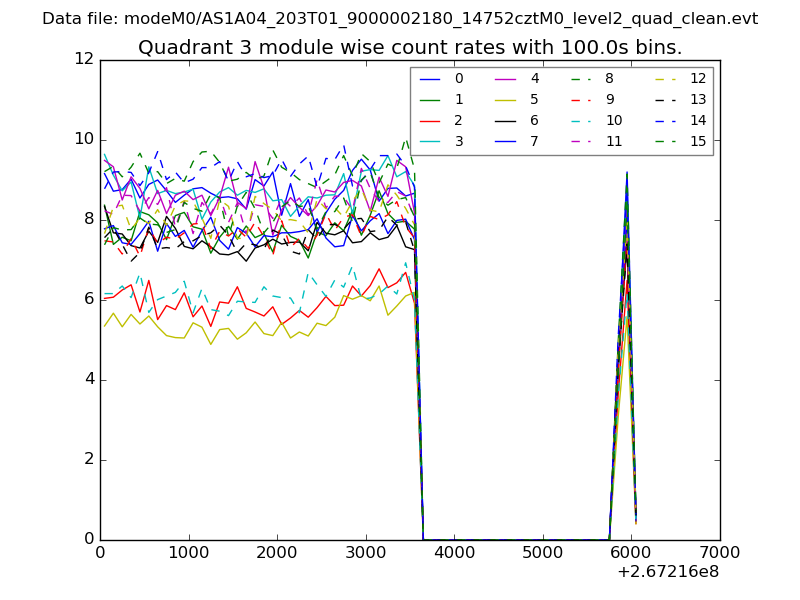 |
 |
| Parameter | Plot |
|---|---|
| CZT HV Monitor | 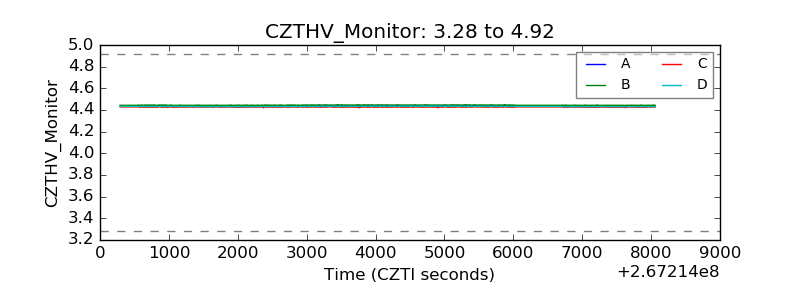 |
| D_VDD | 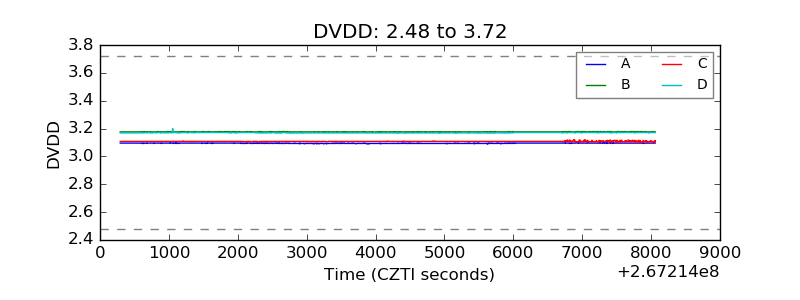 |
| Temperature 1 | 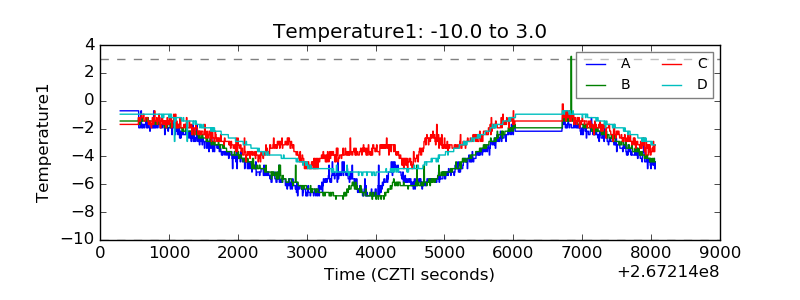 |
| Veto HV Monitor |  |
| Veto LLD | 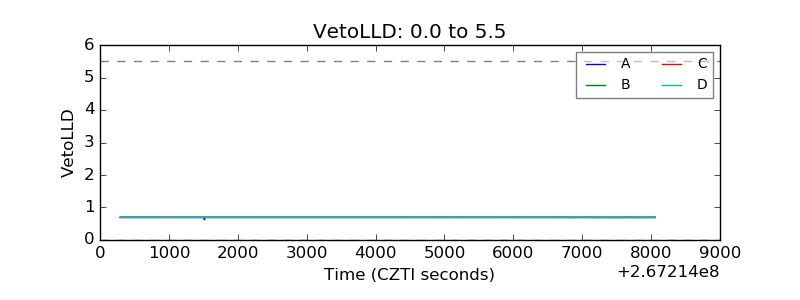 |
| Alpha Counter | 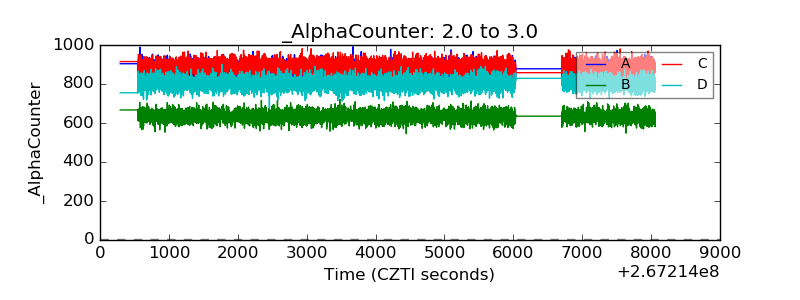 |
| _CPM_Rate |  |
| CZT Counter | 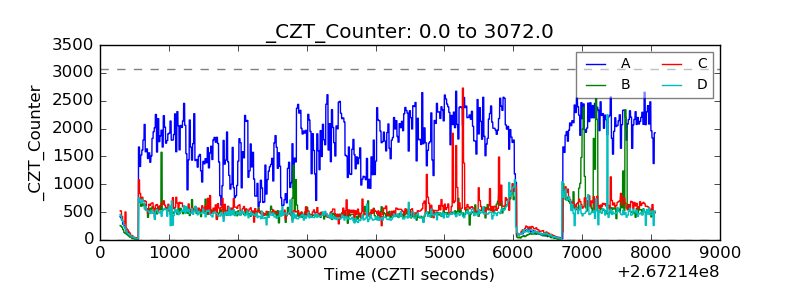 |
| +2.5 Volts monitor | 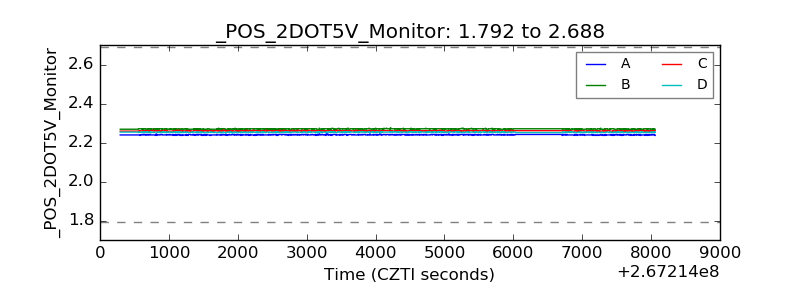 |
| +5 Volts monitor | 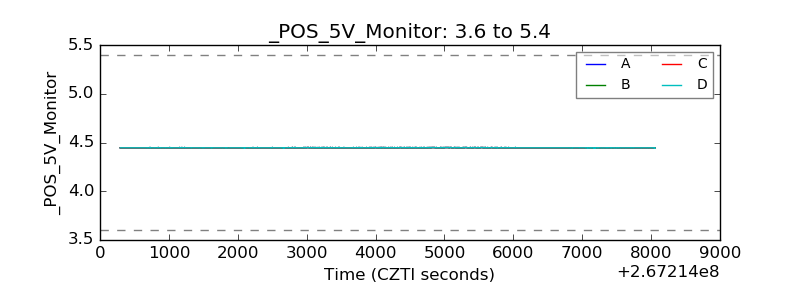 |
| _ROLL_ROT | 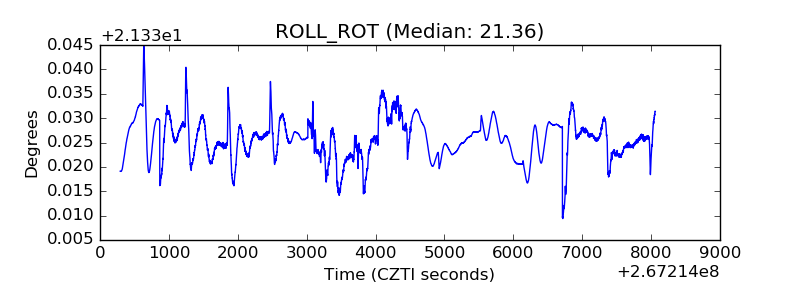 |
| _Roll_DEC |  |
| _Roll_RA | 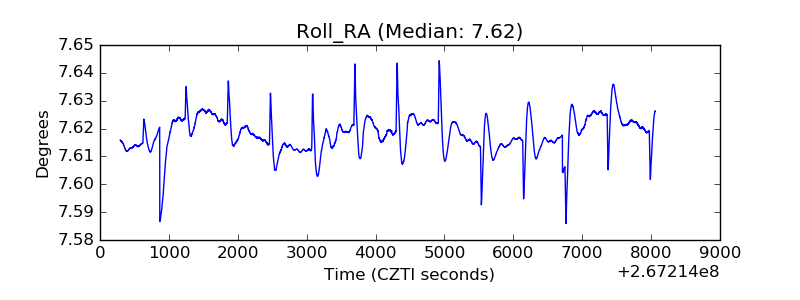 |
| Veto Counter | 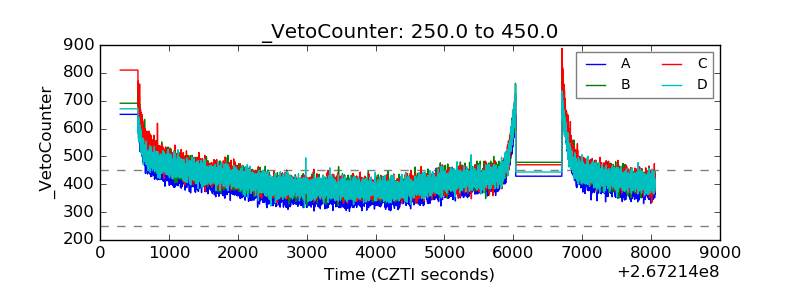 |