| Param | Original file | Final file |
|---|---|---|
| Filename | modeM0/AS1A04_203T01_9000002180_14753cztM0_level2.evt | modeM0/AS1A04_203T01_9000002180_14753cztM0_level2_quad_clean.evt |
| Size (bytes) | 776,635,200 | 86,388,480 |
| Size | 740.7 MB | 82.4 MB |
| Events in quadrant A | 11,271,766 | 502,274 |
| Events in quadrant B | 3,884,579 | 546,884 |
| Events in quadrant C | 4,317,154 | 534,317 |
| Events in quadrant D | 3,559,263 | 529,399 |
| Mode M0 | |||
|---|---|---|---|
| Quadrant | BADHDUFLAG | Total packets | Discarded packets |
| A | 0 | 38516 | 2 |
| B | 0 | 16175 | 1 |
| C | 0 | 17871 | 1 |
| D | 0 | 15527 | 1 |
| Mode SS | |||
|---|---|---|---|
| Quadrant | BADHDUFLAG | Total packets | Discarded packets |
| A | 0 | 148 | 0 |
| B | 0 | 148 | 0 |
| C | 0 | 148 | 0 |
| D | 0 | 148 | 0 |
| Mode M9 | |||
|---|---|---|---|
| Quadrant | BADHDUFLAG | Total packets | Discarded packets |
| A | 0 | 3 | 0 |
| B | 0 | 3 | 0 |
| C | 0 | 3 | 0 |
| D | 0 | 3 | 0 |
| Quadrant | Total seconds | Saturated seconds | Saturation percentage |
|---|---|---|---|
| A | 7214 | 2518 | 34.904353% |
| B | 7214 | 215 | 2.980316% |
| C | 7214 | 88 | 1.219850% |
| D | 7214 | 85 | 1.178264% |
Noise dominated data is calculated using 1-second bins in cleaned event files. If a bin has >2000 counts, and if more than 50% of those come from <1% of pixels, then it is considered to be noise-dominated and hence unusable.
| Quadrant | # 1 sec bins | Bins with >0 counts | Bins with >2000 counts | High rate bins dominated by noise | Noise dominated (total time) | Noise dominated (detector-on time) | Marked lightcurve |
|---|---|---|---|---|---|---|---|
| A | 7545 | 7215 | 2058 | 2058 | 27.28% | 28.52% | 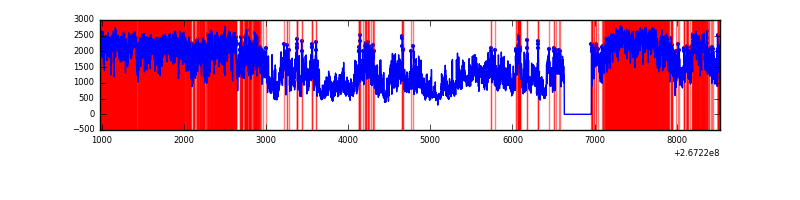 |
| B | 7545 | 7215 | 124 | 124 | 1.64% | 1.72% | 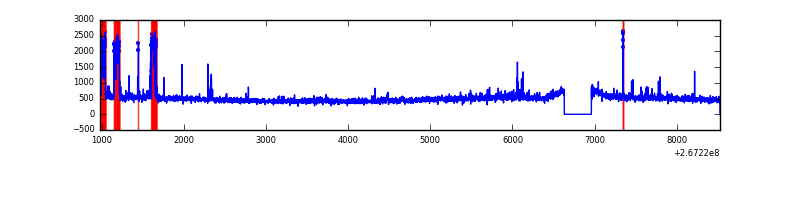 |
| C | 7545 | 7215 | 15 | 15 | 0.20% | 0.21% | 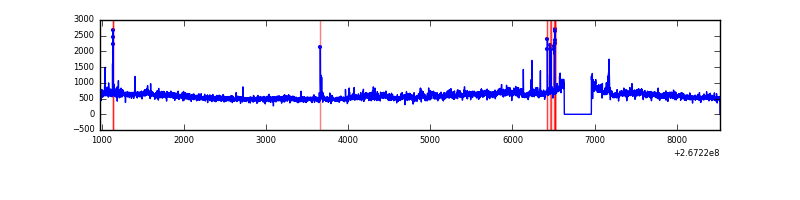 |
| D | 7545 | 7216 | 41 | 41 | 0.54% | 0.57% |  |
Top three noisy pixels from each quadrant. If the there are fewer than three noisy pixels in the level2.evt file, extra rows are filled as -1
| Pixel properties | Quadrant properties | ||||||
|---|---|---|---|---|---|---|---|
| Quadrant | DetID | PixID | Counts | Sigma | Mean | Median | Sigma |
| A | 8 | 15 | 8128058 | 50122.23 | 791 | 775 | 162.1 |
| A | 12 | 189 | 63984 | 389.82 | 791 | 775 | 162.1 |
| A | 9 | 143 | 17442 | 102.79 | 791 | 775 | 162.1 |
| B | 4 | 142 | 384533 | 2294.19 | 870 | 849 | 167.2 |
| B | 0 | 229 | 35294 | 205.96 | 870 | 849 | 167.2 |
| B | 0 | 197 | 19575 | 111.97 | 870 | 849 | 167.2 |
| C | 3 | 233 | 888877 | 4467.48 | 851 | 855 | 198.8 |
| C | 0 | 207 | 73510 | 365.51 | 851 | 855 | 198.8 |
| C | 4 | 254 | 23009 | 111.45 | 851 | 855 | 198.8 |
| D | 2 | 136 | 146539 | 657.13 | 855 | 830 | 221.7 |
| D | 10 | 70 | 56203 | 249.72 | 855 | 830 | 221.7 |
| D | 2 | 120 | 45137 | 199.82 | 855 | 830 | 221.7 |
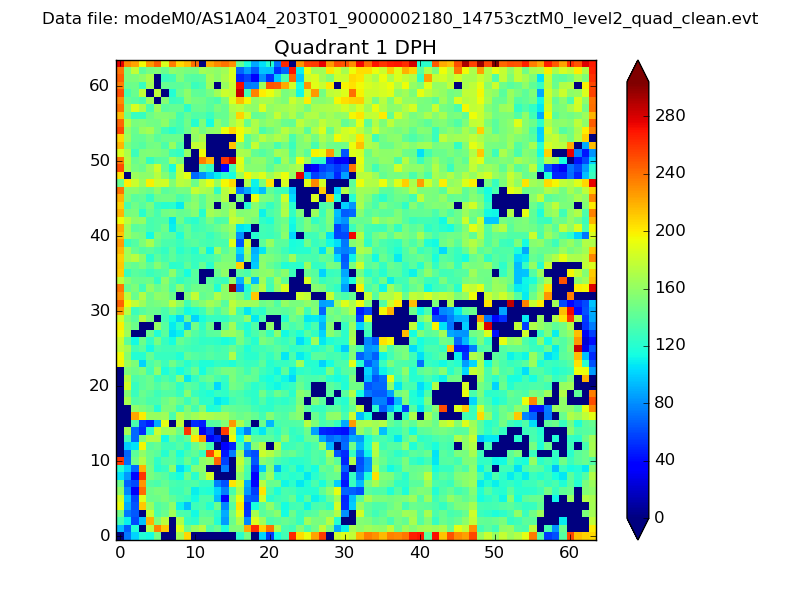
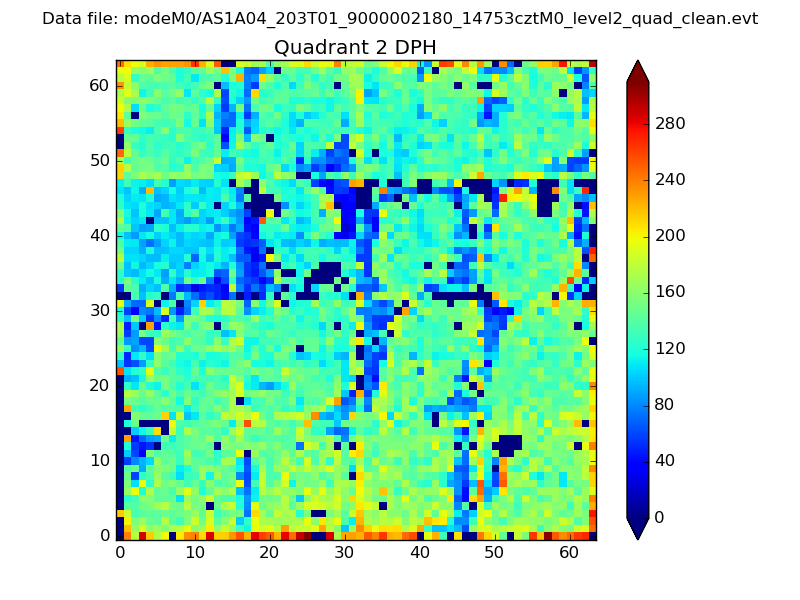
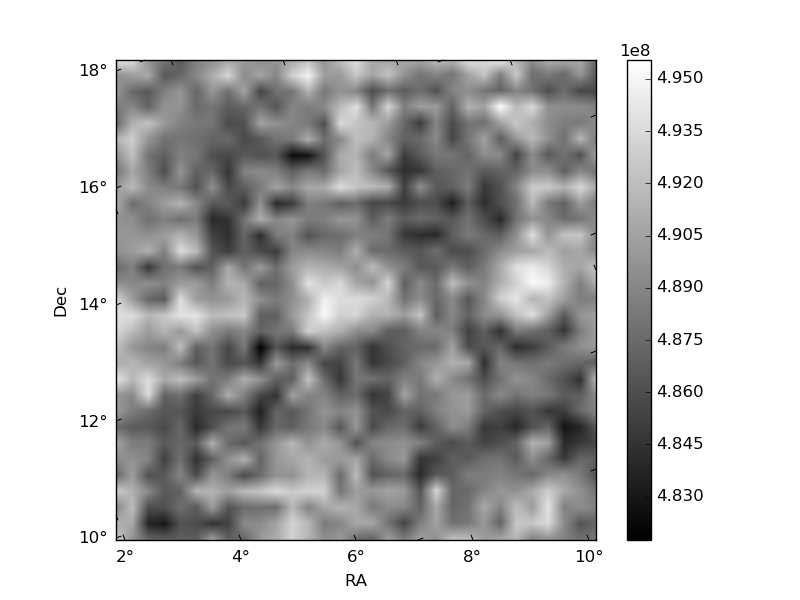
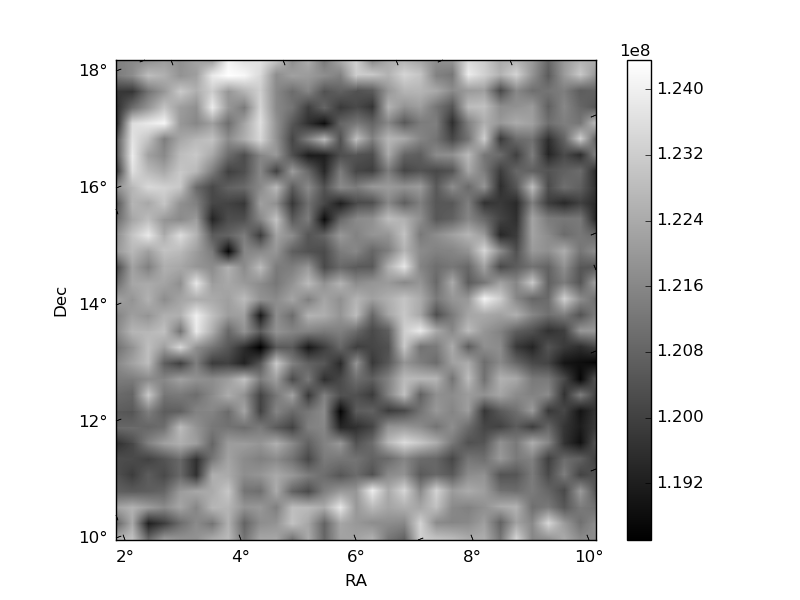
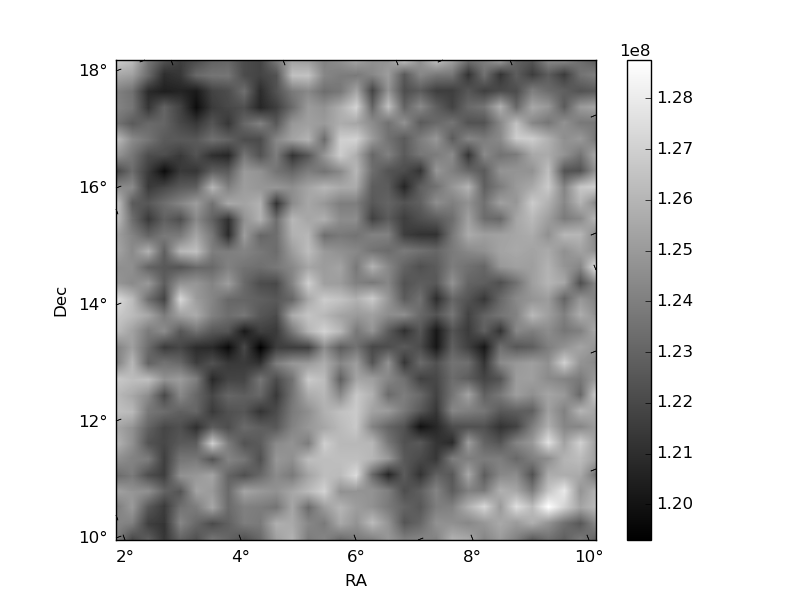
Histogram calculated using DETX and DETY for each event in the final _common_clean file
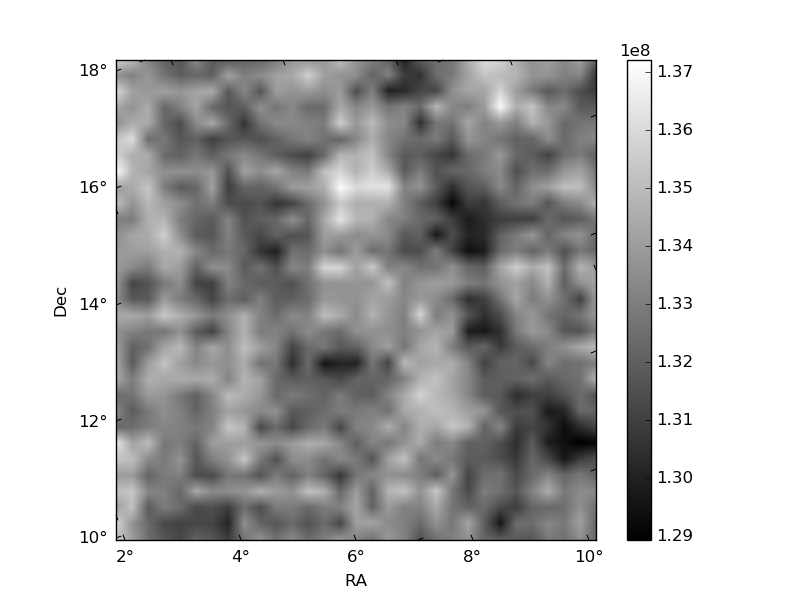
| Quadrant A | 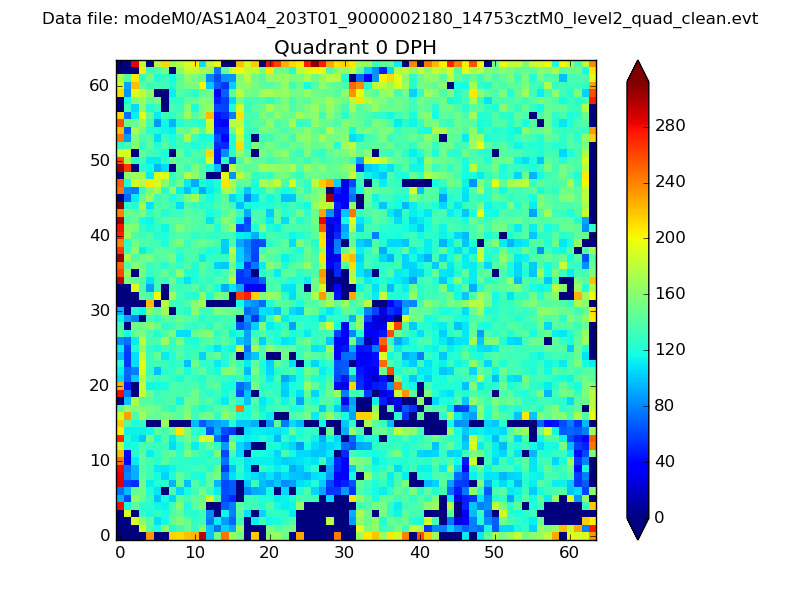 |
 |
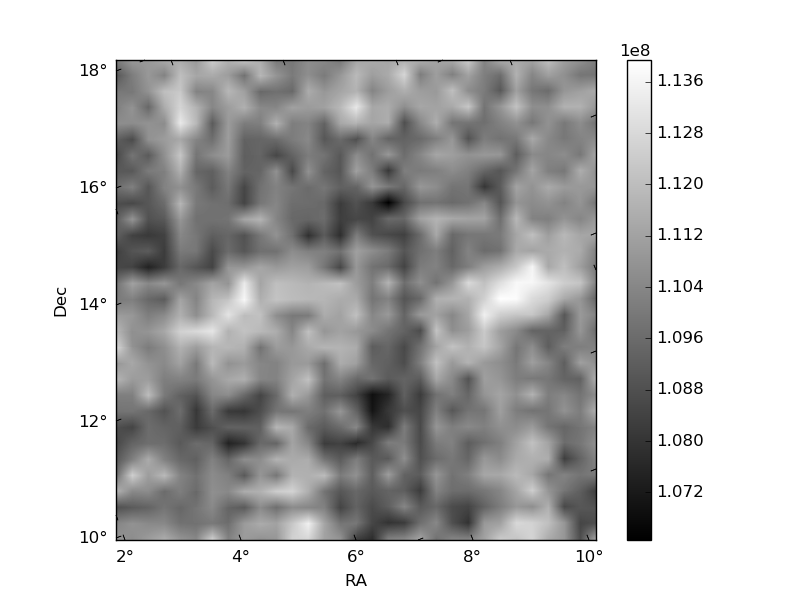
Quadrant B |
|---|---|---|---|
| Quadrant D | 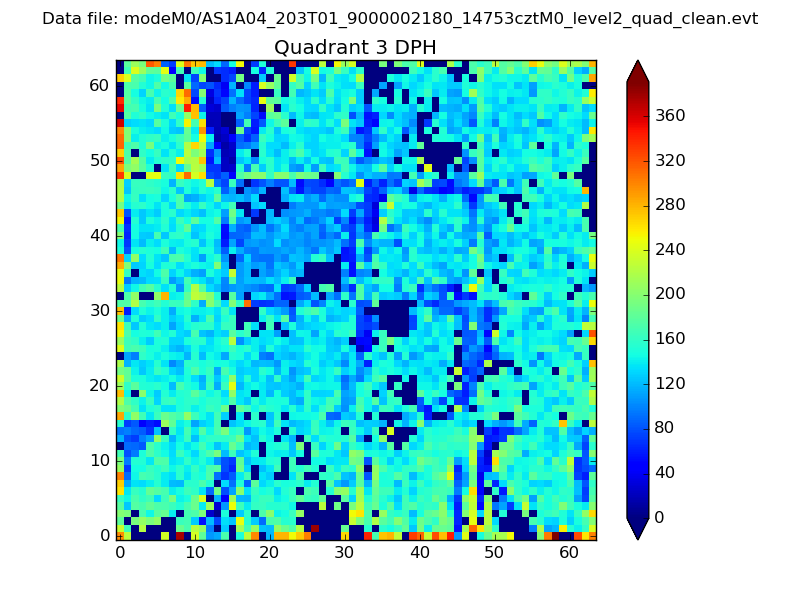 |
 |
Quadrant C |
| Plot type | Count rate plots | Images |
|---|---|---|
| Comparison with Poisson distribution Blue bars denote a histogram of data divided into 1 sec bins. Red curve is a Poisson curve with rate = median count rate of data. |
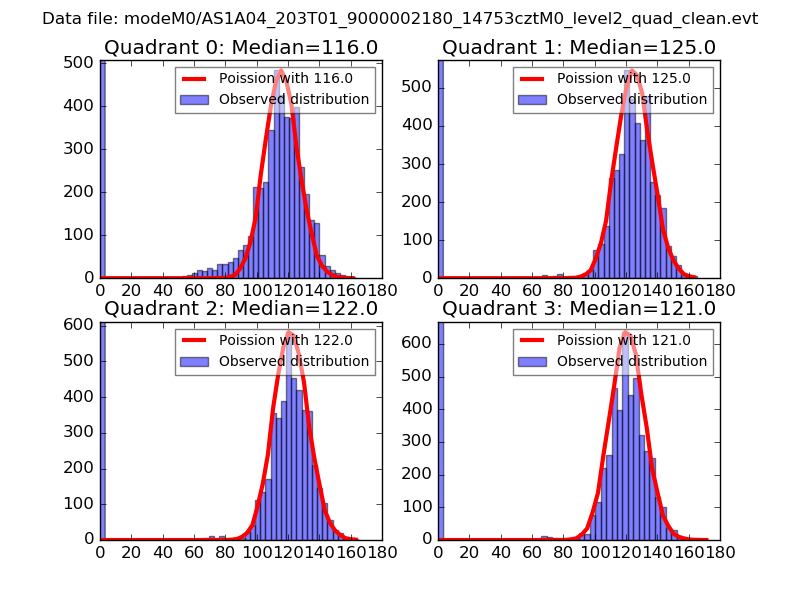 |
 |
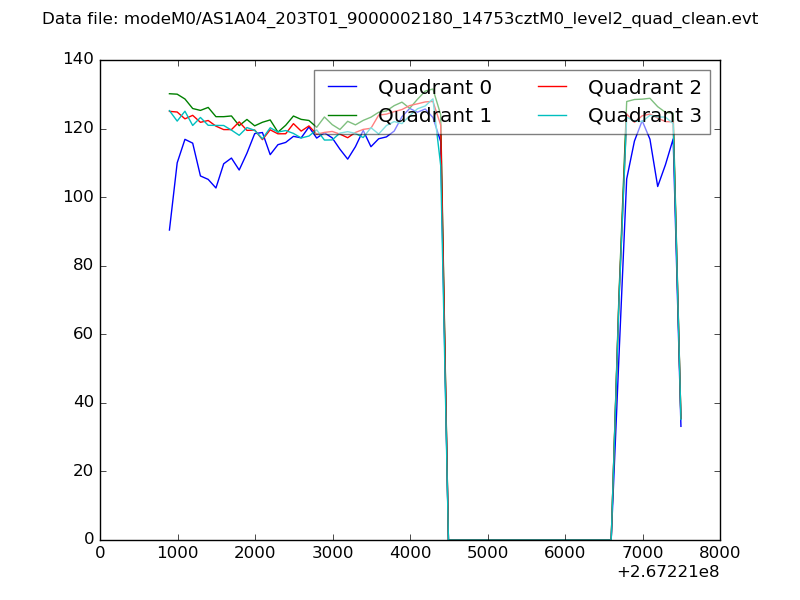
| Quadrant-wise count rates Data is divided into 100 sec bins |
 |
|
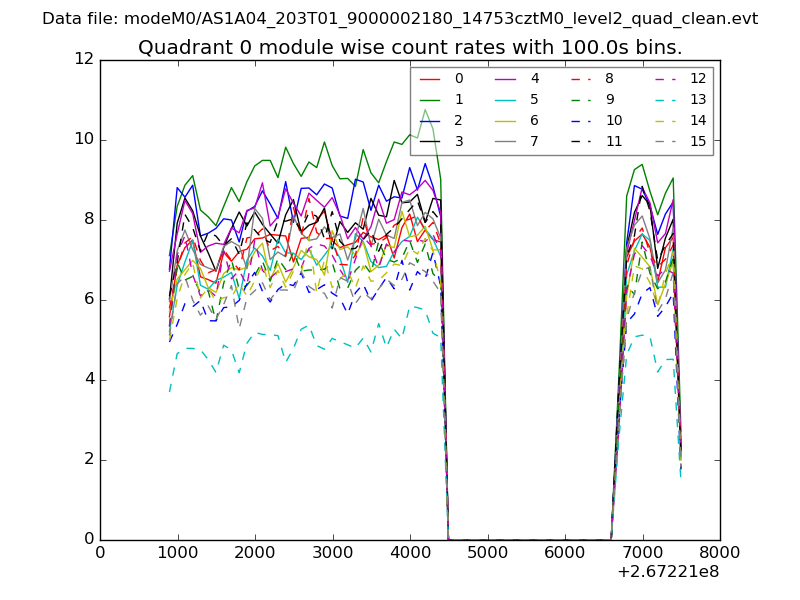
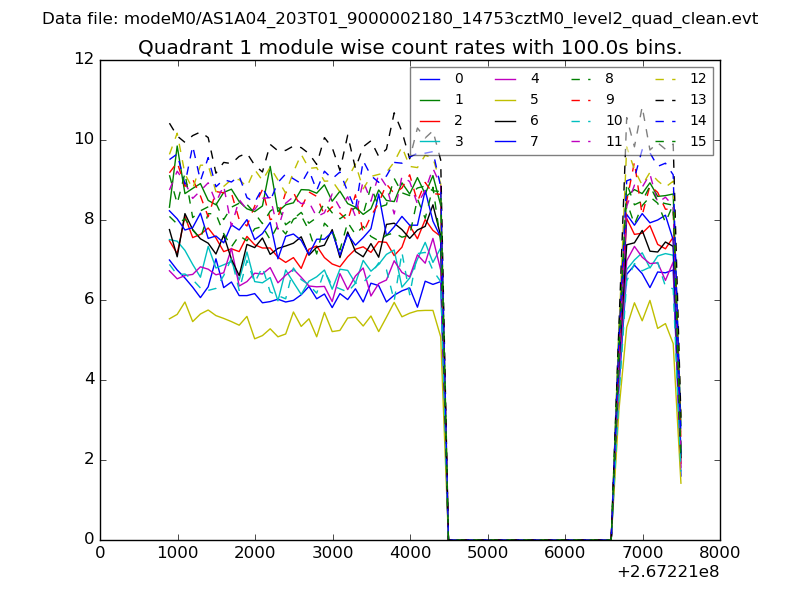
| Module-wise count rates for Quadrant A Data is divided into 100 sec bins |
 |
 |
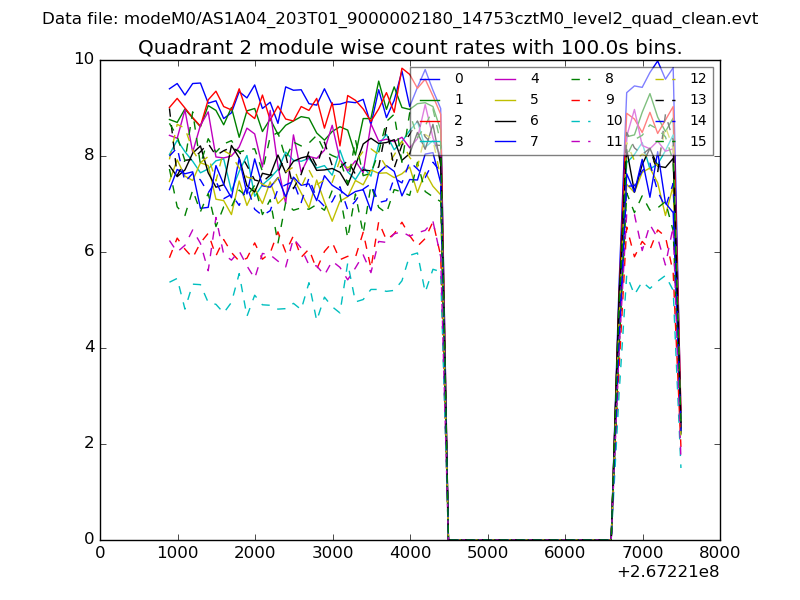
| Module-wise count rates for Quadrant B Data is divided into 100 sec bins |
 |
 |
| Module-wise count rates for Quadrant C Data is divided into 100 sec bins |
 |
 |
| Module-wise count rates for Quadrant D Data is divided into 100 sec bins |
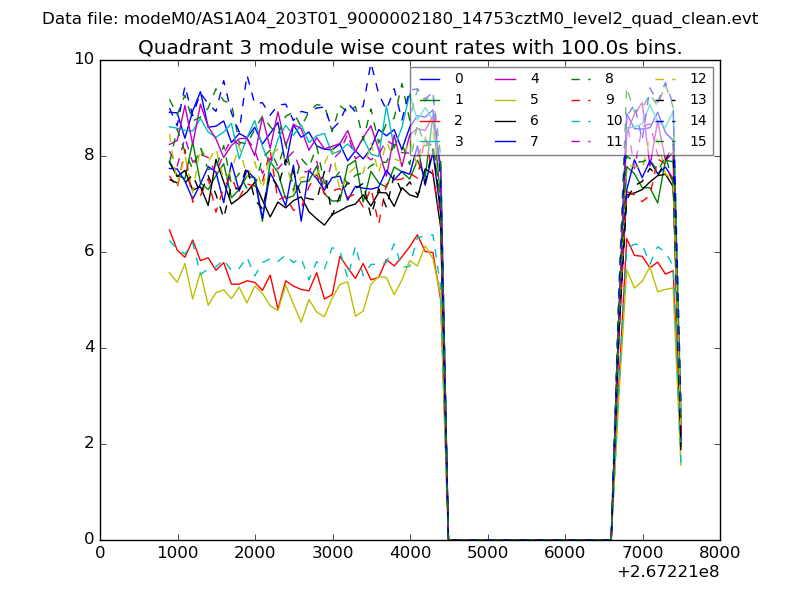 |
 |
| Parameter | Plot |
|---|---|
| CZT HV Monitor | 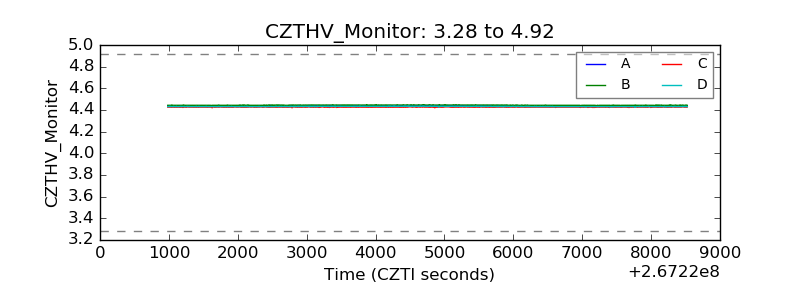 |
| D_VDD | 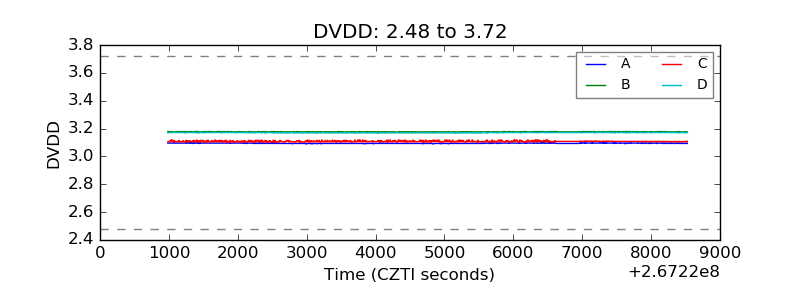 |
| Temperature 1 | 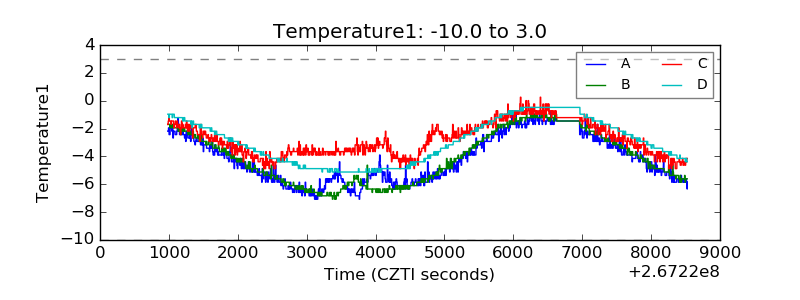 |
| Veto HV Monitor | 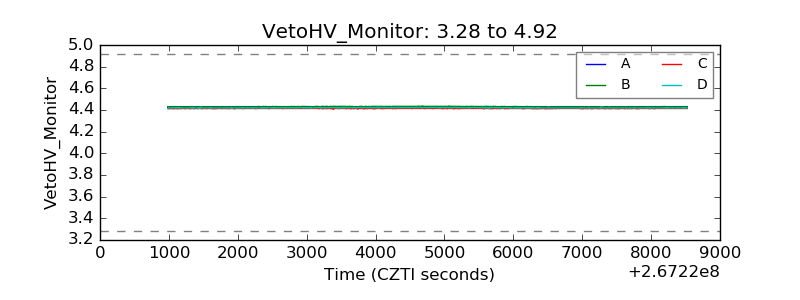 |
| Veto LLD | 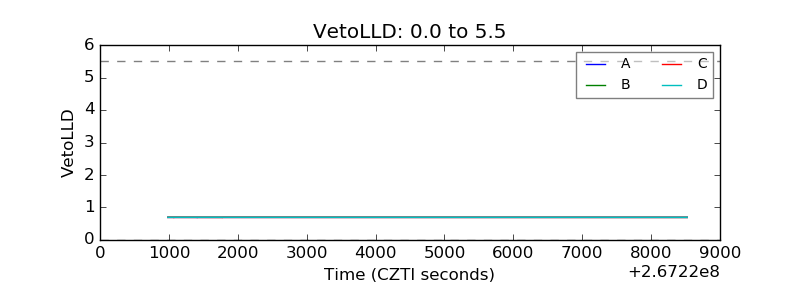 |
| Alpha Counter | 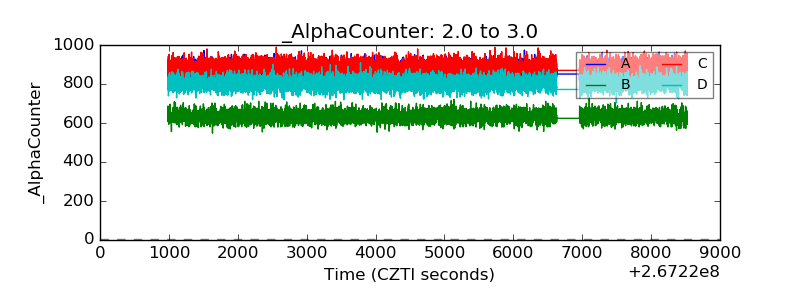 |
| _CPM_Rate | 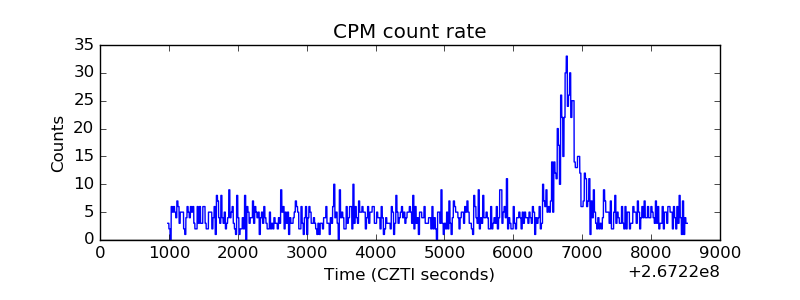 |
| CZT Counter | 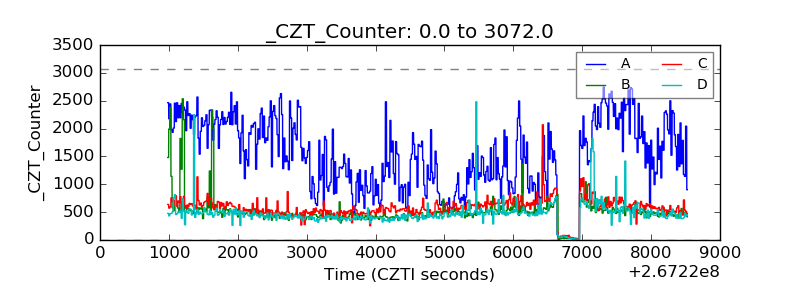 |
| +2.5 Volts monitor |  |
| +5 Volts monitor |  |
| _ROLL_ROT |  |
| _Roll_DEC | 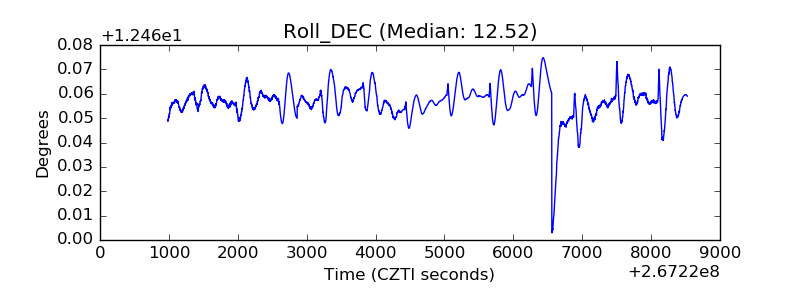 |
| _Roll_RA | 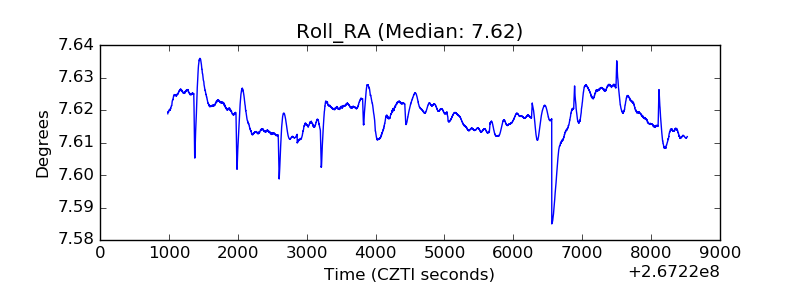 |
| Veto Counter | 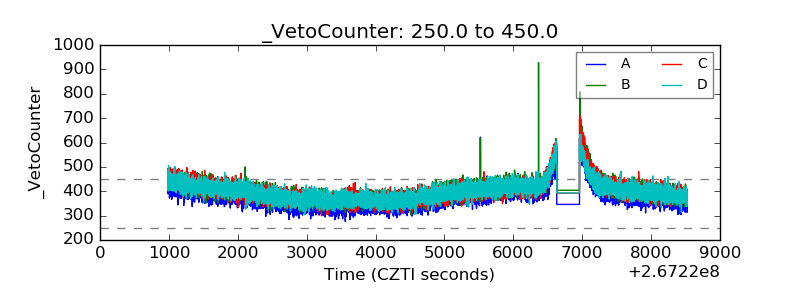 |