| Param | Original file | Final file |
|---|---|---|
| Filename | modeM0/AS1A04_203T01_9000002180_14754cztM0_level2.evt | modeM0/AS1A04_203T01_9000002180_14754cztM0_level2_quad_clean.evt |
| Size (bytes) | 841,072,320 | 90,584,640 |
| Size | 802.1 MB | 86.4 MB |
| Events in quadrant A | 12,420,372 | 517,382 |
| Events in quadrant B | 4,043,508 | 575,345 |
| Events in quadrant C | 4,638,278 | 561,156 |
| Events in quadrant D | 3,854,454 | 558,008 |
| Mode M0 | |||
|---|---|---|---|
| Quadrant | BADHDUFLAG | Total packets | Discarded packets |
| A | 0 | 42190 | 4 |
| B | 0 | 17080 | 2 |
| C | 0 | 18862 | 2 |
| D | 0 | 16863 | 2 |
| Mode SS | |||
|---|---|---|---|
| Quadrant | BADHDUFLAG | Total packets | Discarded packets |
| A | 0 | 158 | 0 |
| B | 0 | 158 | 0 |
| C | 0 | 158 | 0 |
| D | 0 | 158 | 0 |
| Mode M9 | |||
|---|---|---|---|
| Quadrant | BADHDUFLAG | Total packets | Discarded packets |
| A | 0 | 5 | 0 |
| B | 0 | 5 | 0 |
| C | 0 | 5 | 0 |
| D | 0 | 5 | 0 |
| Quadrant | Total seconds | Saturated seconds | Saturation percentage |
|---|---|---|---|
| A | 7627 | 3174 | 41.615314% |
| B | 7627 | 189 | 2.478039% |
| C | 7627 | 147 | 1.927363% |
| D | 7627 | 95 | 1.245575% |
Noise dominated data is calculated using 1-second bins in cleaned event files. If a bin has >2000 counts, and if more than 50% of those come from <1% of pixels, then it is considered to be noise-dominated and hence unusable.
| Quadrant | # 1 sec bins | Bins with >0 counts | Bins with >2000 counts | High rate bins dominated by noise | Noise dominated (total time) | Noise dominated (detector-on time) | Marked lightcurve |
|---|---|---|---|---|---|---|---|
| A | 8199 | 7628 | 2283 | 2283 | 27.84% | 29.93% | 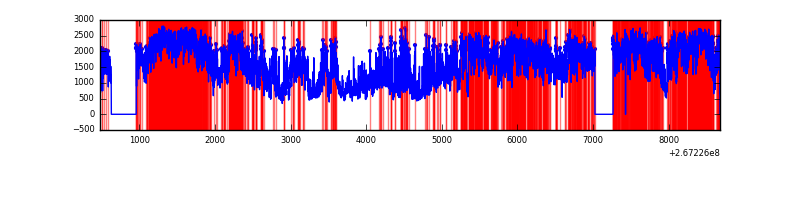 |
| B | 8199 | 7629 | 24 | 24 | 0.29% | 0.31% | 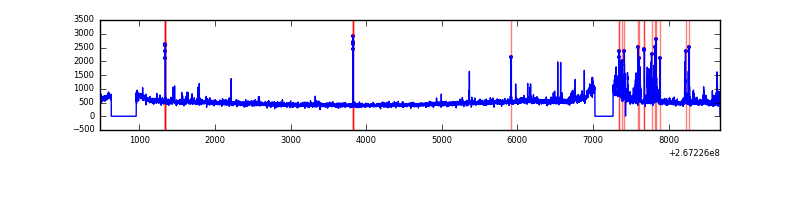 |
| C | 8199 | 7628 | 18 | 18 | 0.22% | 0.24% | 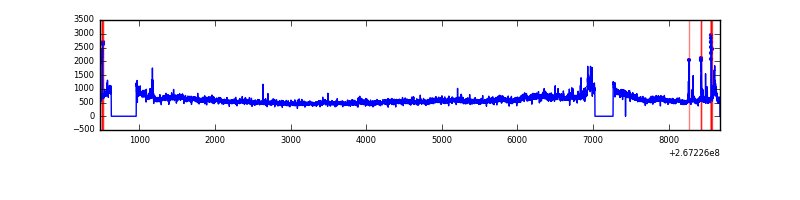 |
| D | 8199 | 7631 | 30 | 30 | 0.37% | 0.39% | 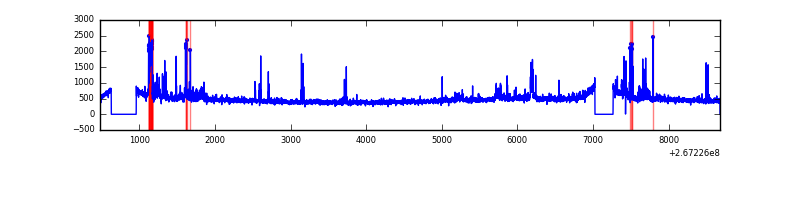 |
Top three noisy pixels from each quadrant. If the there are fewer than three noisy pixels in the level2.evt file, extra rows are filled as -1
| Pixel properties | Quadrant properties | ||||||
|---|---|---|---|---|---|---|---|
| Quadrant | DetID | PixID | Counts | Sigma | Mean | Median | Sigma |
| A | 8 | 15 | 9028586 | 54191.92 | 822 | 804 | 166.6 |
| A | 12 | 189 | 133633 | 797.35 | 822 | 804 | 166.6 |
| A | 0 | 23 | 73338 | 435.41 | 822 | 804 | 166.6 |
| B | 10 | 16 | 227898 | 1241.94 | 943 | 918 | 182.8 |
| B | 4 | 142 | 35175 | 187.44 | 943 | 918 | 182.8 |
| B | 0 | 229 | 28555 | 151.22 | 943 | 918 | 182.8 |
| C | 3 | 233 | 911410 | 4252.23 | 912 | 914 | 214.1 |
| C | 4 | 254 | 104884 | 485.56 | 912 | 914 | 214.1 |
| C | 0 | 207 | 58362 | 268.29 | 912 | 914 | 214.1 |
| D | 2 | 136 | 221990 | 921.36 | 914 | 889 | 240.0 |
| D | 13 | 172 | 48041 | 196.49 | 914 | 889 | 240.0 |
| D | 2 | 234 | 35734 | 145.2 | 914 | 889 | 240.0 |
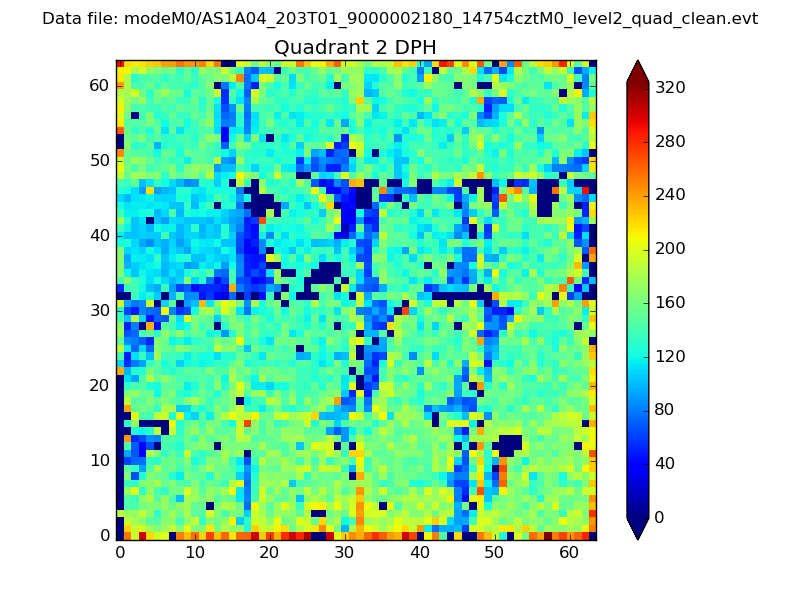
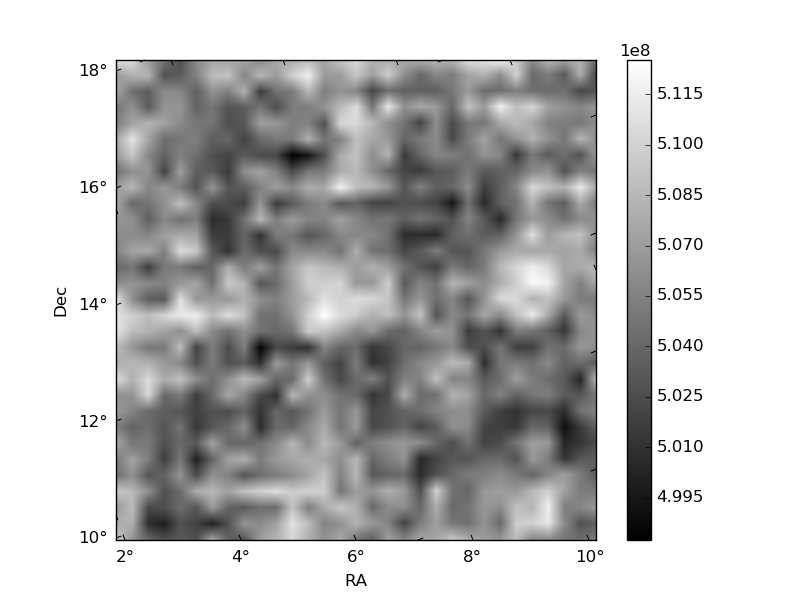
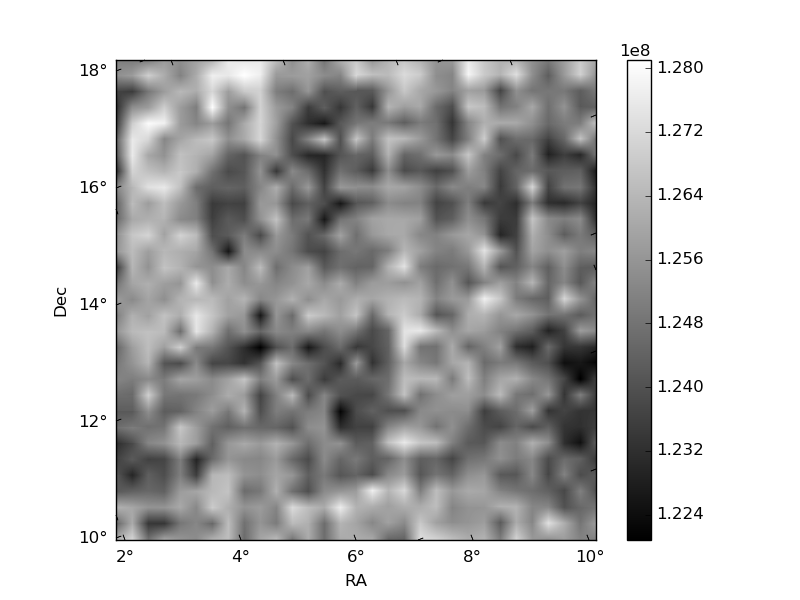
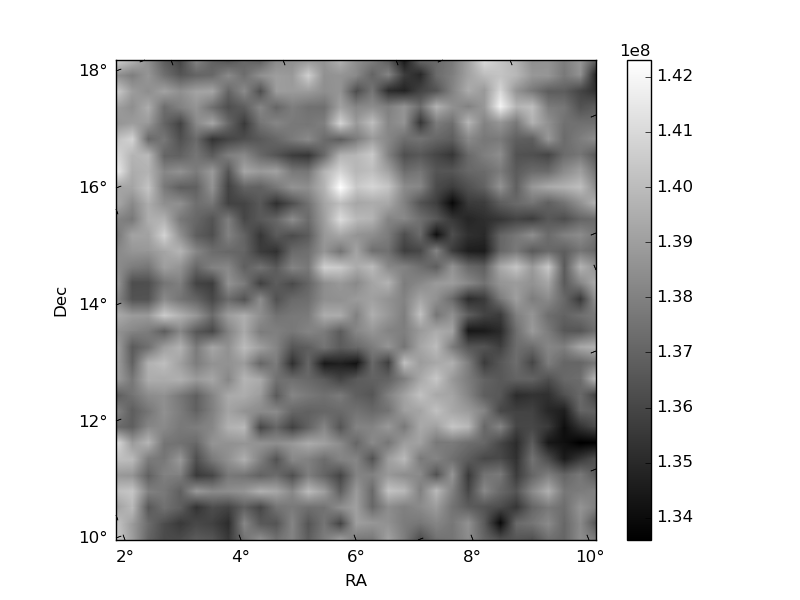
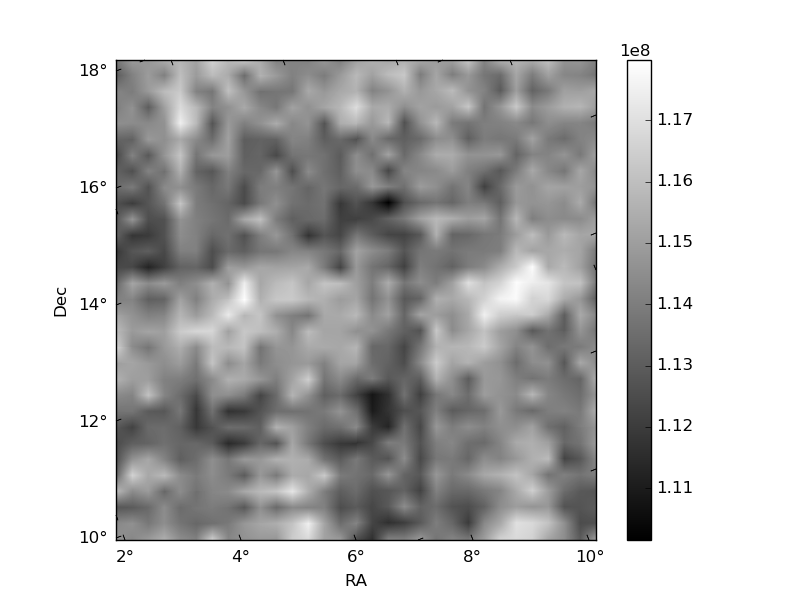
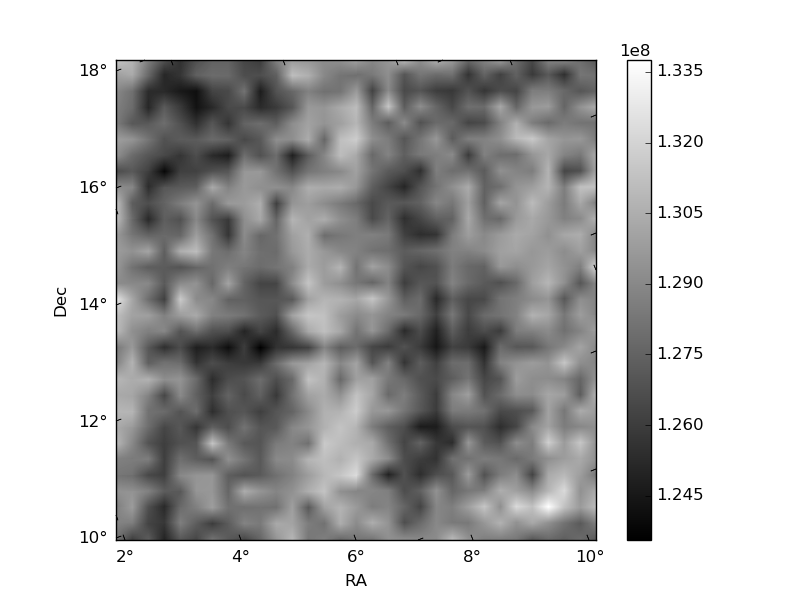
Histogram calculated using DETX and DETY for each event in the final _common_clean file
| Quadrant A | 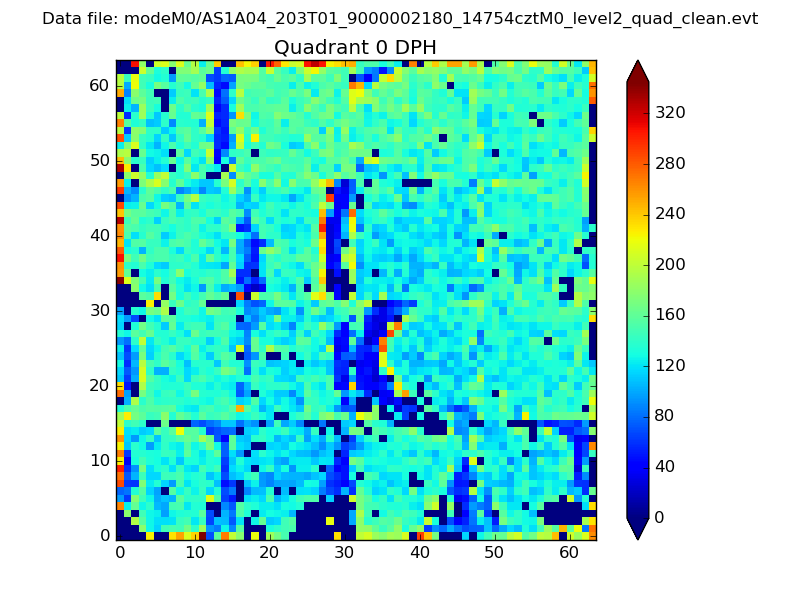 |
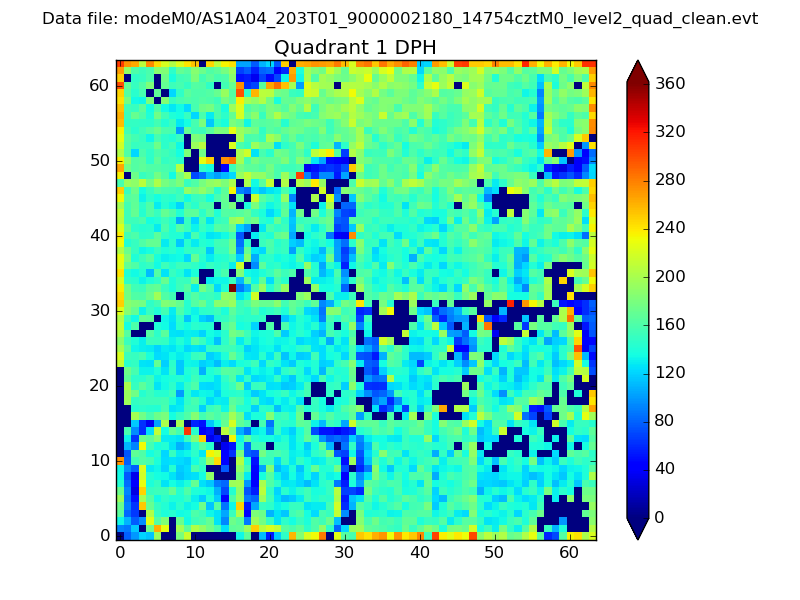 |
Quadrant B |
|---|---|---|---|
| Quadrant D | 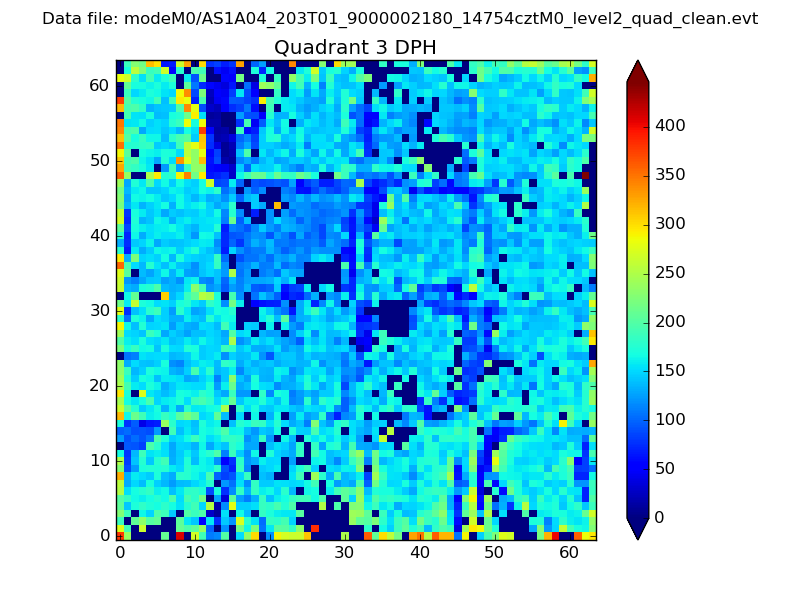 |
 |
Quadrant C |
| Plot type | Count rate plots | Images |
|---|---|---|
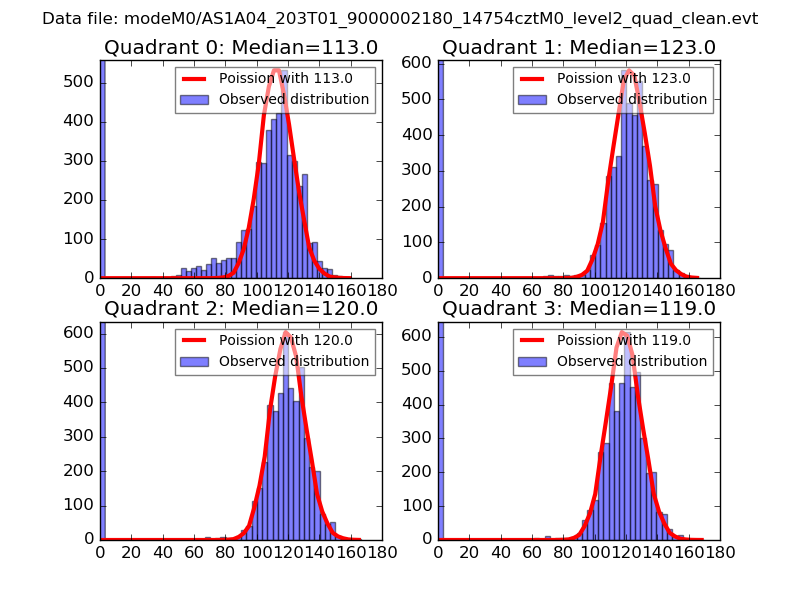
| Comparison with Poisson distribution Blue bars denote a histogram of data divided into 1 sec bins. Red curve is a Poisson curve with rate = median count rate of data. |
 |
 |
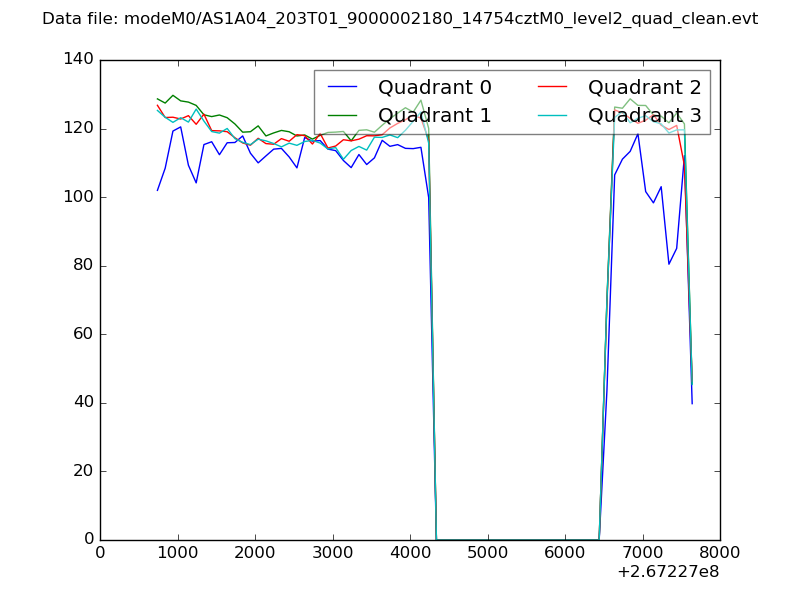
| Quadrant-wise count rates Data is divided into 100 sec bins |
 |
|
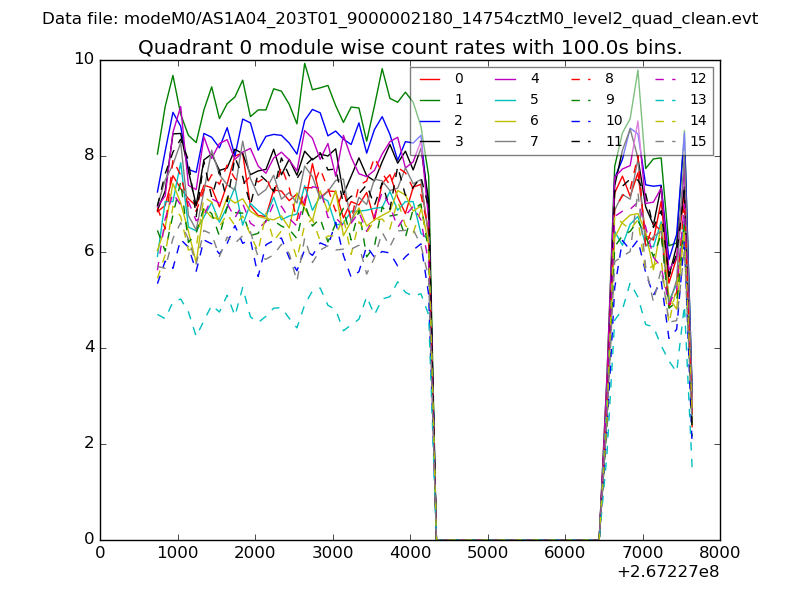
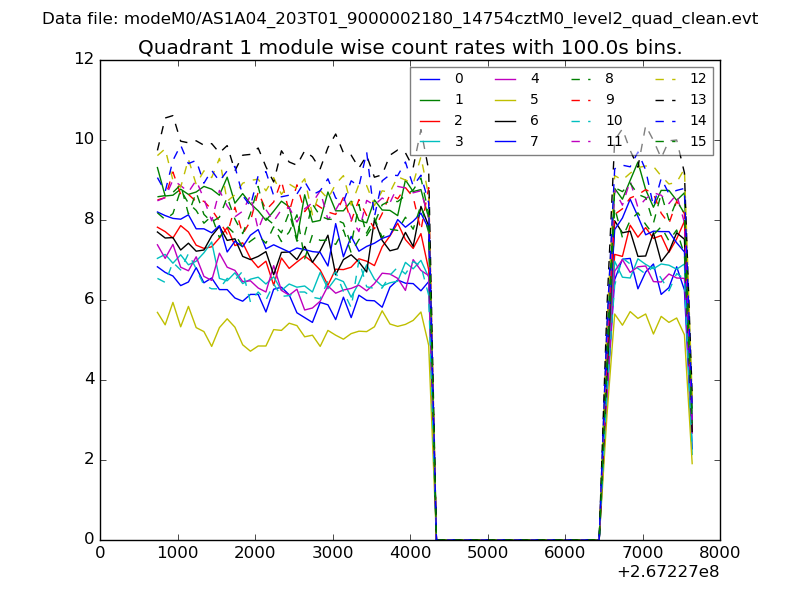
| Module-wise count rates for Quadrant A Data is divided into 100 sec bins |
 |
 |
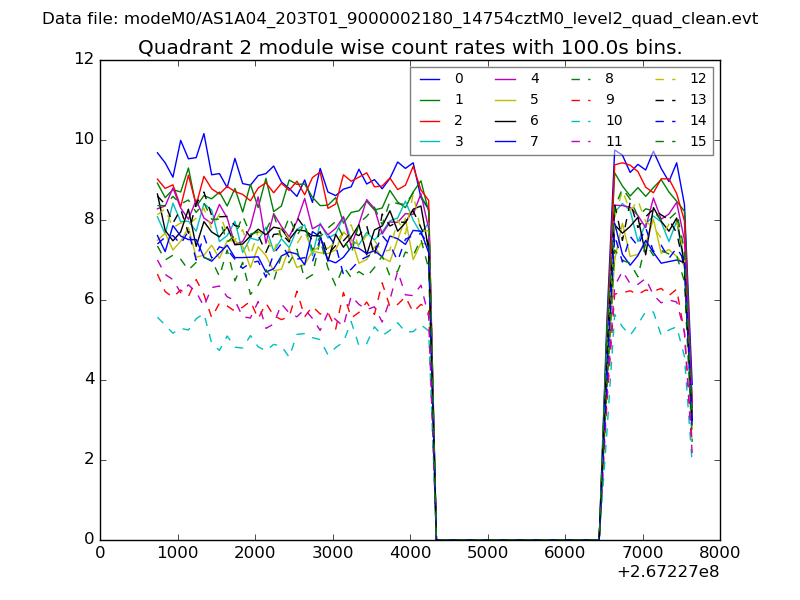
| Module-wise count rates for Quadrant B Data is divided into 100 sec bins |
 |
 |
| Module-wise count rates for Quadrant C Data is divided into 100 sec bins |
 |
 |
| Module-wise count rates for Quadrant D Data is divided into 100 sec bins |
 |
 |
| Parameter | Plot |
|---|---|
| CZT HV Monitor | 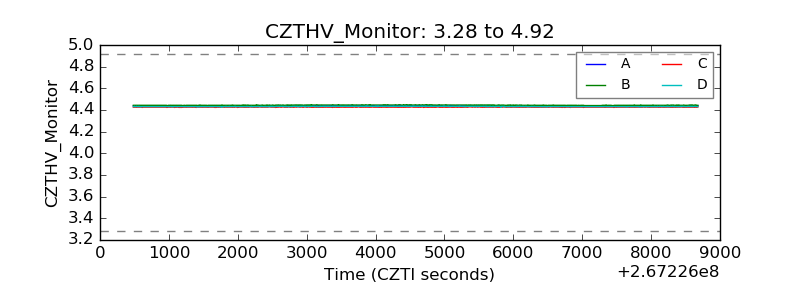 |
| D_VDD | 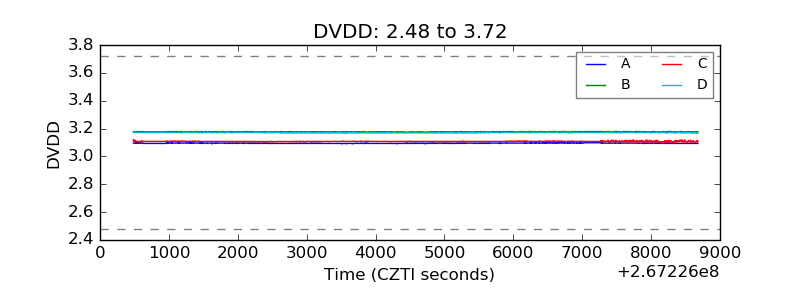 |
| Temperature 1 |  |
| Veto HV Monitor | 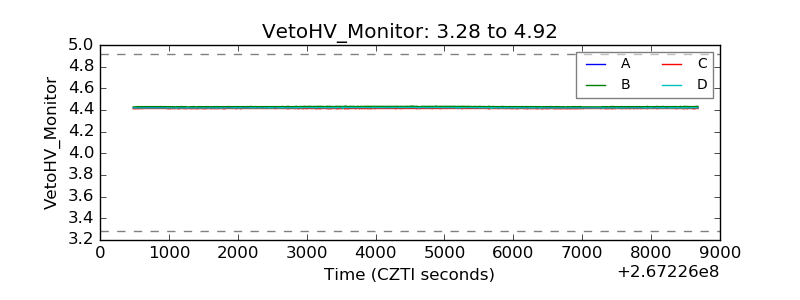 |
| Veto LLD | 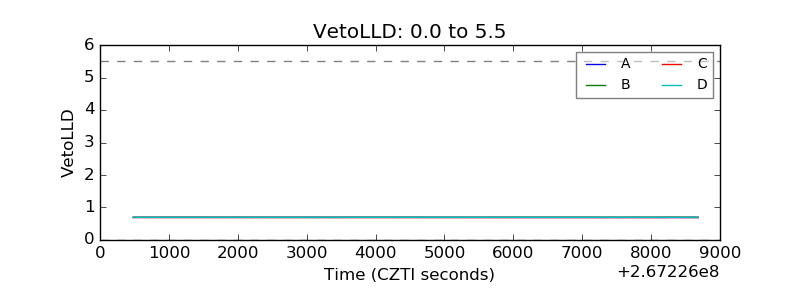 |
| Alpha Counter | 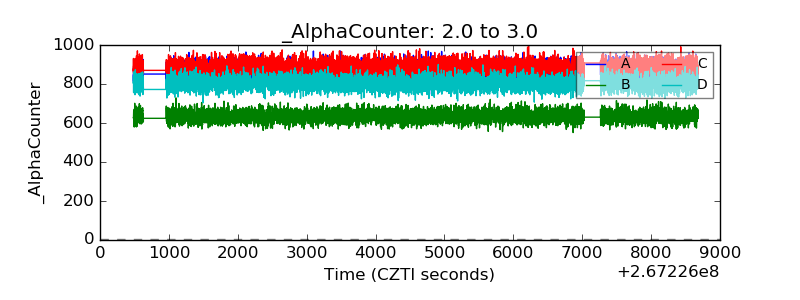 |
| _CPM_Rate | 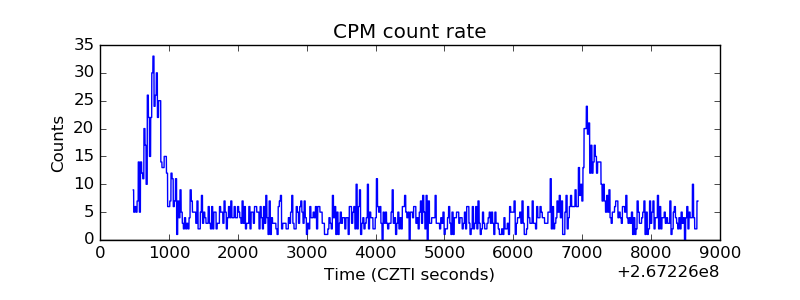 |
| CZT Counter | 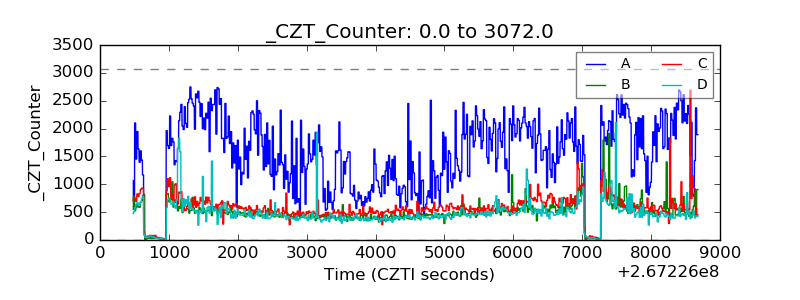 |
| +2.5 Volts monitor | 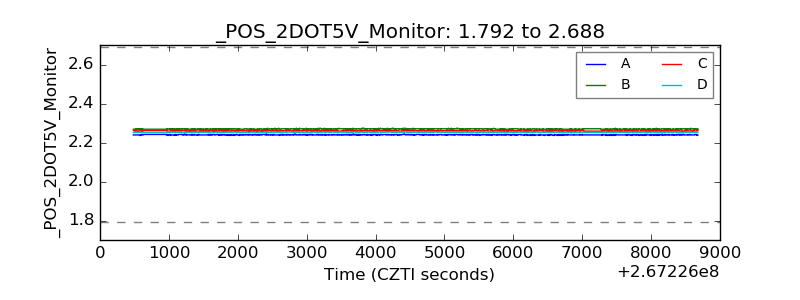 |
| +5 Volts monitor | 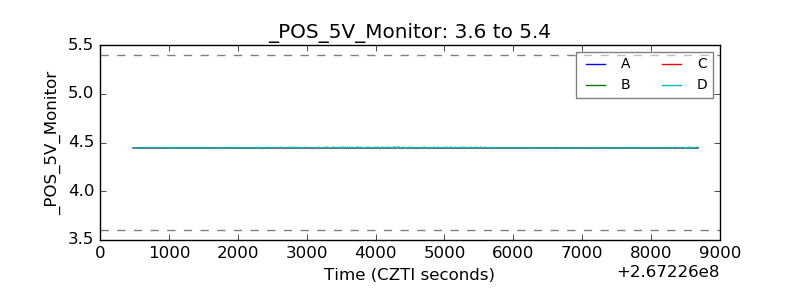 |
| _ROLL_ROT | 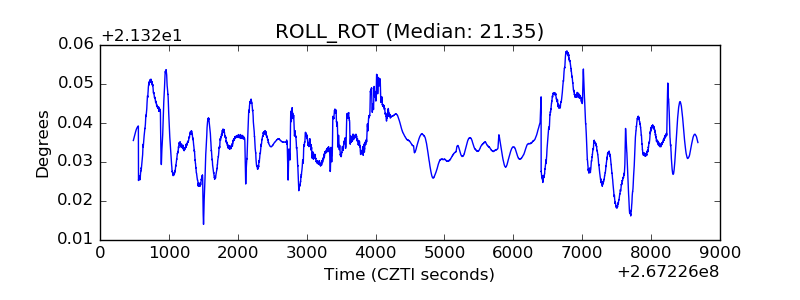 |
| _Roll_DEC |  |
| _Roll_RA | 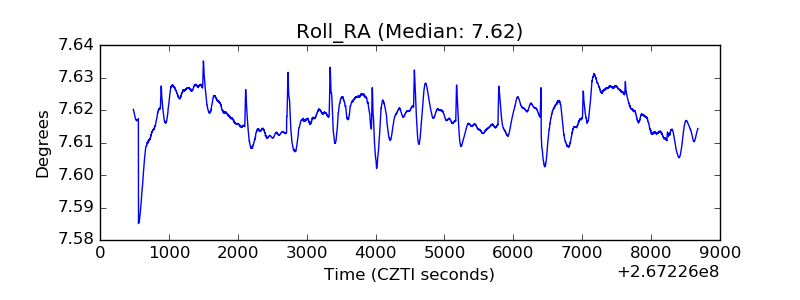 |
| Veto Counter | 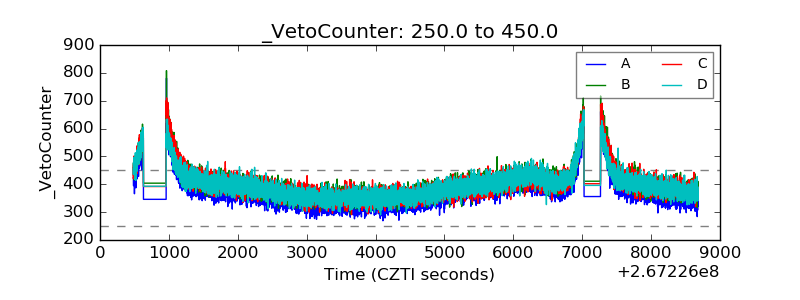 |