| Param | Original file | Final file |
|---|---|---|
| Filename | modeM0/AS1A04_203T01_9000002180_14755cztM0_level2.evt | modeM0/AS1A04_203T01_9000002180_14755cztM0_level2_quad_clean.evt |
| Size (bytes) | 719,812,800 | 96,477,120 |
| Size | 686.5 MB | 92.0 MB |
| Events in quadrant A | 8,411,948 | 578,765 |
| Events in quadrant B | 4,664,953 | 611,375 |
| Events in quadrant C | 4,478,508 | 602,706 |
| Events in quadrant D | 3,725,720 | 595,352 |
| Mode M0 | |||
|---|---|---|---|
| Quadrant | BADHDUFLAG | Total packets | Discarded packets |
| A | 0 | 30261 | 4 |
| B | 0 | 18983 | 2 |
| C | 0 | 18300 | 2 |
| D | 0 | 16554 | 2 |
| Mode SS | |||
|---|---|---|---|
| Quadrant | BADHDUFLAG | Total packets | Discarded packets |
| A | 0 | 158 | 0 |
| B | 0 | 158 | 0 |
| C | 0 | 158 | 0 |
| D | 0 | 158 | 0 |
| Mode M9 | |||
|---|---|---|---|
| Quadrant | BADHDUFLAG | Total packets | Discarded packets |
| A | 0 | 6 | 0 |
| B | 0 | 6 | 0 |
| C | 0 | 6 | 0 |
| D | 0 | 6 | 0 |
| Quadrant | Total seconds | Saturated seconds | Saturation percentage |
|---|---|---|---|
| A | 7663 | 1460 | 19.052590% |
| B | 7663 | 404 | 5.272087% |
| C | 7663 | 126 | 1.644265% |
| D | 7663 | 93 | 1.213624% |
Noise dominated data is calculated using 1-second bins in cleaned event files. If a bin has >2000 counts, and if more than 50% of those come from <1% of pixels, then it is considered to be noise-dominated and hence unusable.
| Quadrant | # 1 sec bins | Bins with >0 counts | Bins with >2000 counts | High rate bins dominated by noise | Noise dominated (total time) | Noise dominated (detector-on time) | Marked lightcurve |
|---|---|---|---|---|---|---|---|
| A | 8284 | 7663 | 930 | 930 | 11.23% | 12.14% | 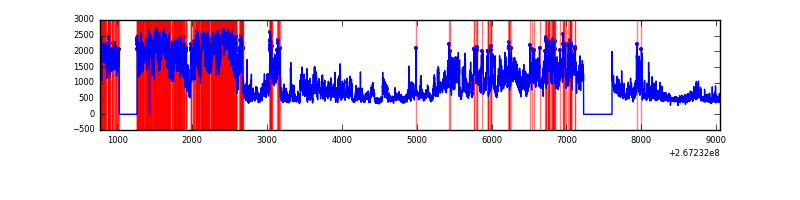 |
| B | 8285 | 7665 | 171 | 171 | 2.06% | 2.23% | 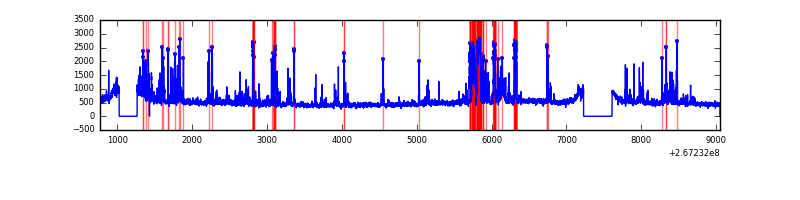 |
| C | 8284 | 7663 | 13 | 13 | 0.16% | 0.17% | 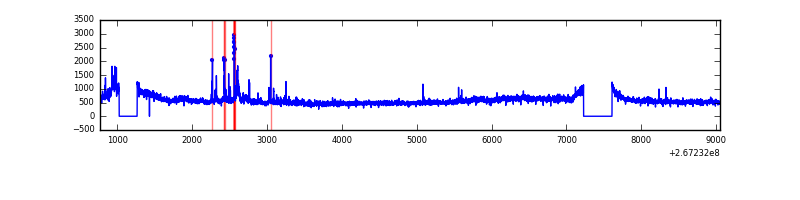 |
| D | 8284 | 7665 | 17 | 17 | 0.21% | 0.22% | 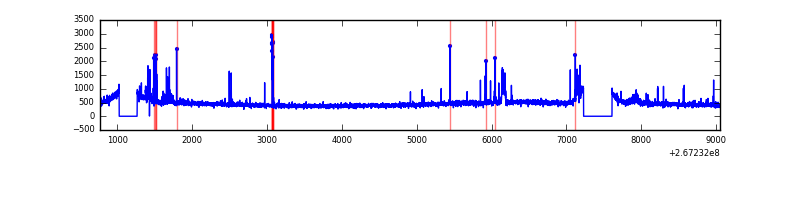 |
Top three noisy pixels from each quadrant. If the there are fewer than three noisy pixels in the level2.evt file, extra rows are filled as -1
| Pixel properties | Quadrant properties | ||||||
|---|---|---|---|---|---|---|---|
| Quadrant | DetID | PixID | Counts | Sigma | Mean | Median | Sigma |
| A | 8 | 15 | 4736017 | 26230.44 | 883 | 862 | 180.5 |
| A | 0 | 23 | 167779 | 924.64 | 883 | 862 | 180.5 |
| A | 12 | 189 | 89302 | 489.91 | 883 | 862 | 180.5 |
| B | 10 | 16 | 874444 | 4845.68 | 929 | 904 | 180.3 |
| B | 0 | 229 | 60062 | 328.16 | 929 | 904 | 180.3 |
| B | 4 | 142 | 30844 | 166.08 | 929 | 904 | 180.3 |
| C | 3 | 233 | 733537 | 3424.21 | 913 | 918 | 214.0 |
| C | 4 | 254 | 133279 | 618.64 | 913 | 918 | 214.0 |
| C | 0 | 207 | 23868 | 107.26 | 913 | 918 | 214.0 |
| D | 2 | 136 | 109814 | 442.96 | 907 | 887 | 245.9 |
| D | 13 | 172 | 54638 | 218.58 | 907 | 887 | 245.9 |
| D | 2 | 234 | 30834 | 121.78 | 907 | 887 | 245.9 |
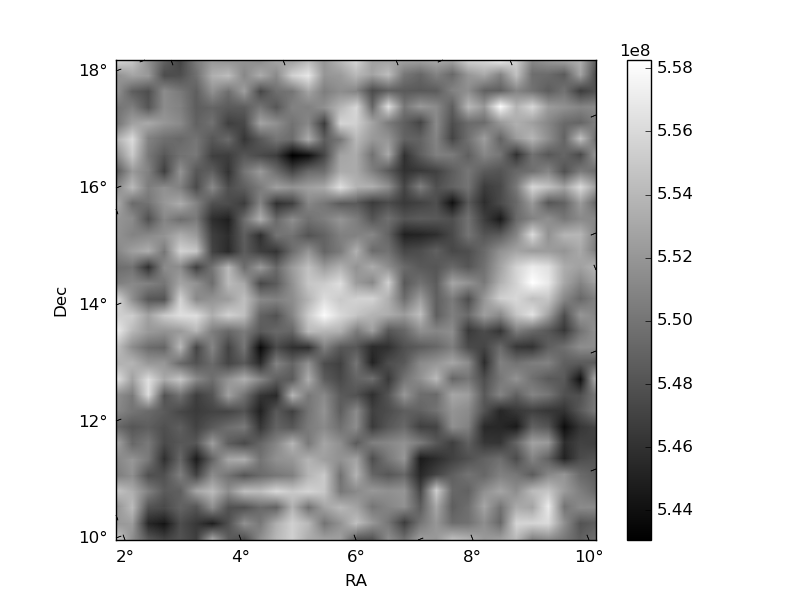
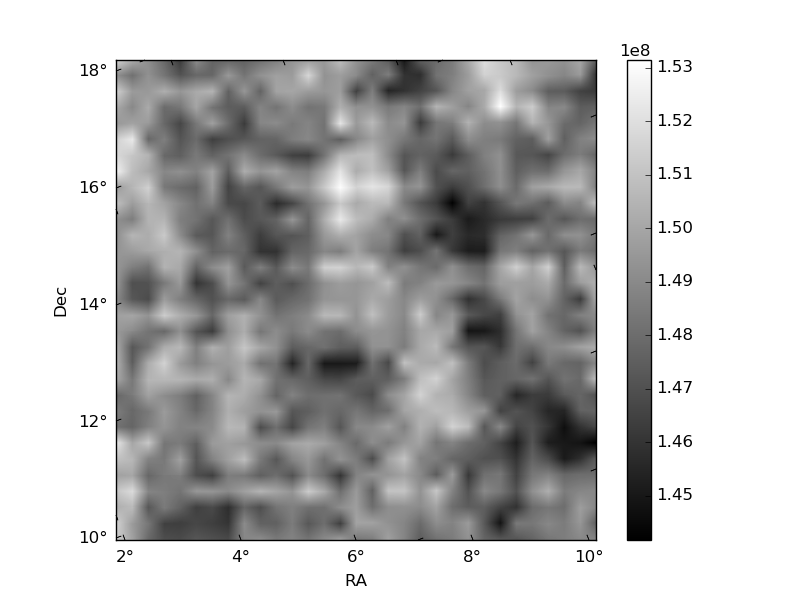
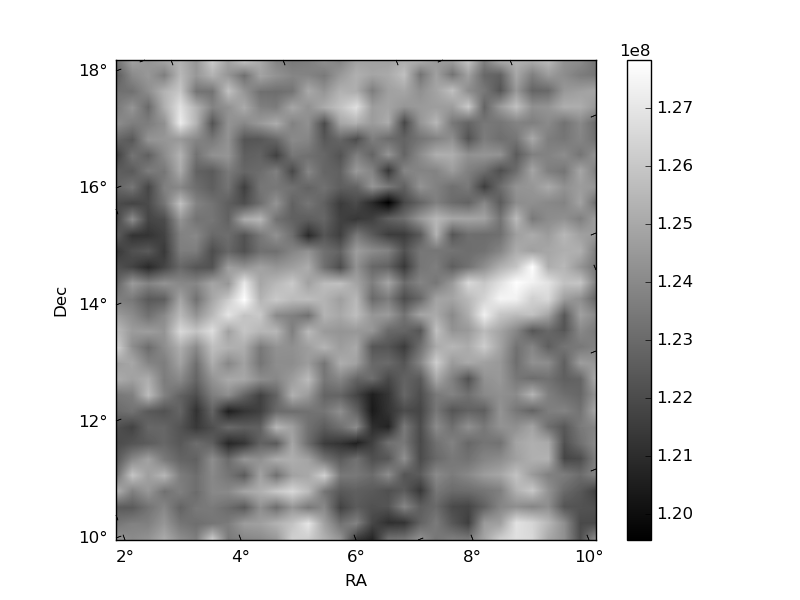
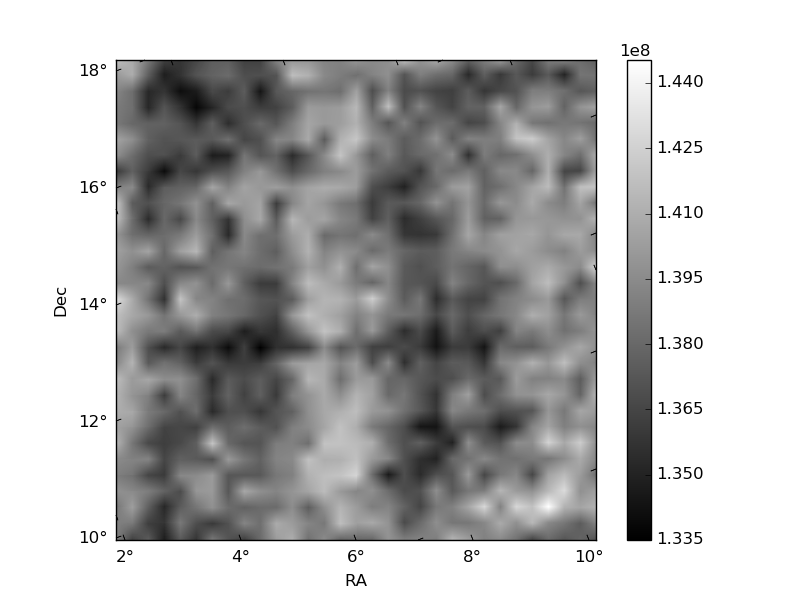
Histogram calculated using DETX and DETY for each event in the final _common_clean file
| Quadrant A | 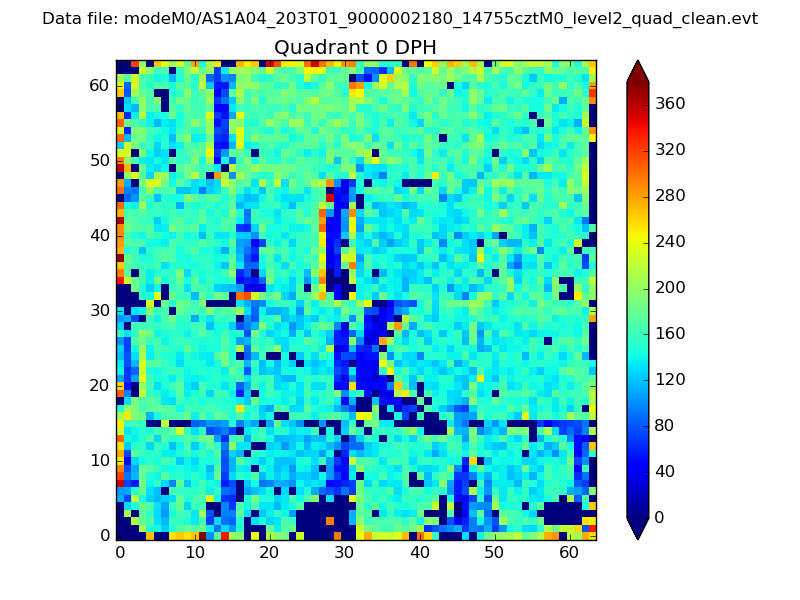 |
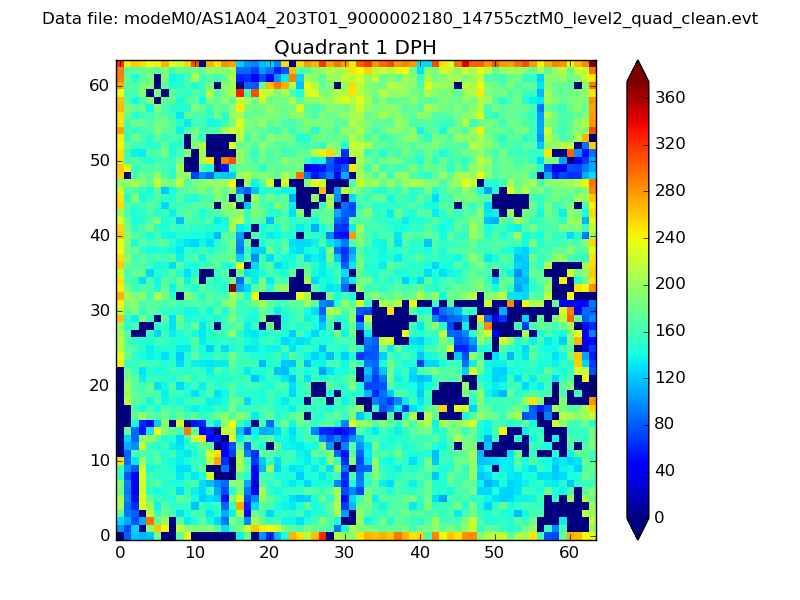 |
Quadrant B |
|---|---|---|---|
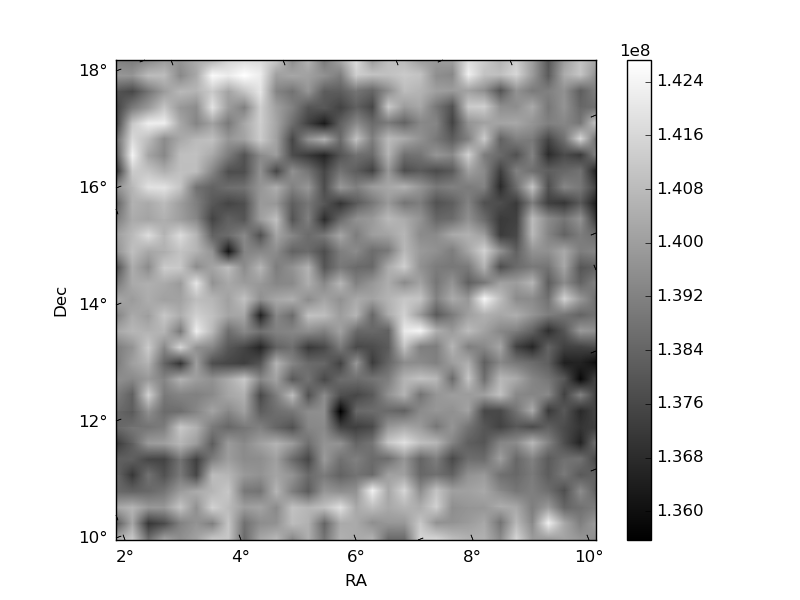
| Quadrant D | 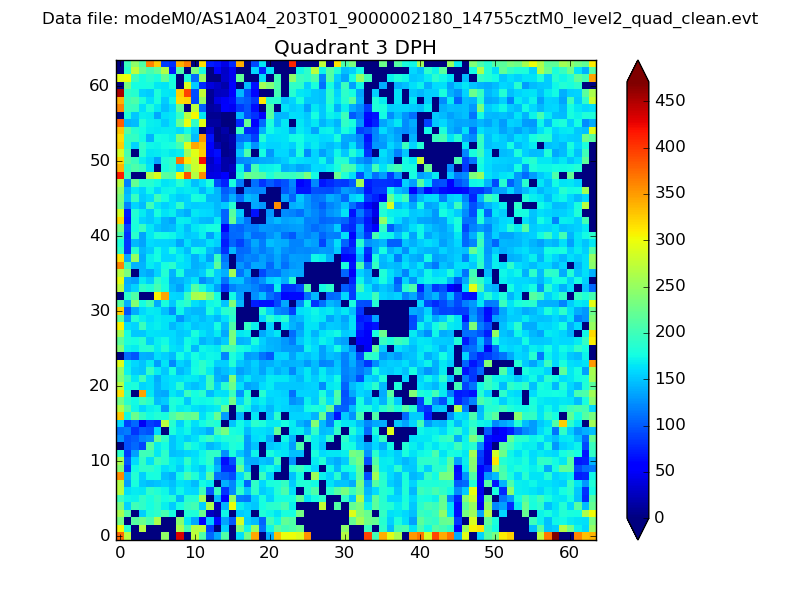 |
 |
Quadrant C |
| Plot type | Count rate plots | Images |
|---|---|---|
| Comparison with Poisson distribution Blue bars denote a histogram of data divided into 1 sec bins. Red curve is a Poisson curve with rate = median count rate of data. |
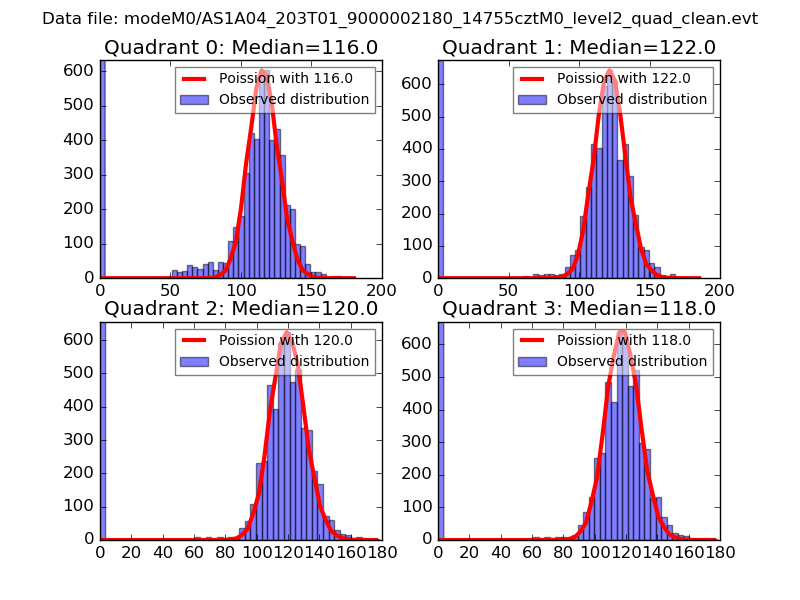 |
 |
| Quadrant-wise count rates Data is divided into 100 sec bins |
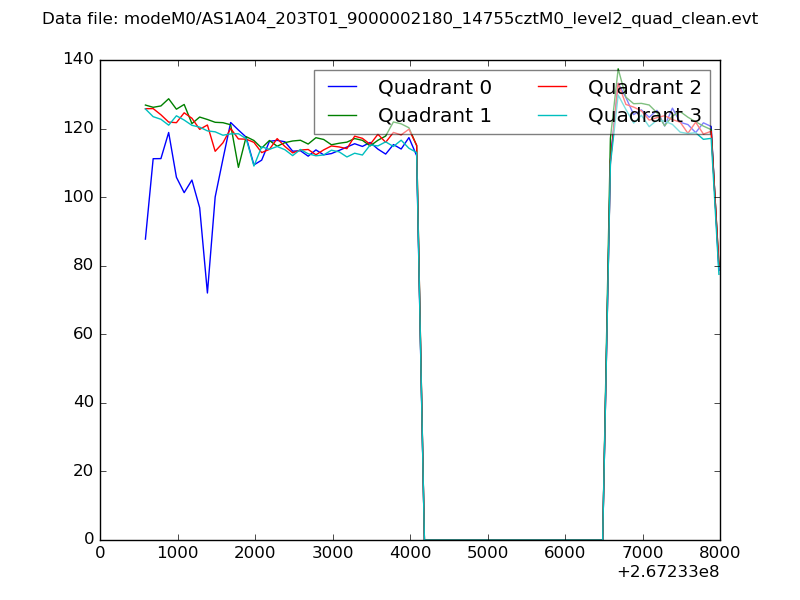 |
|
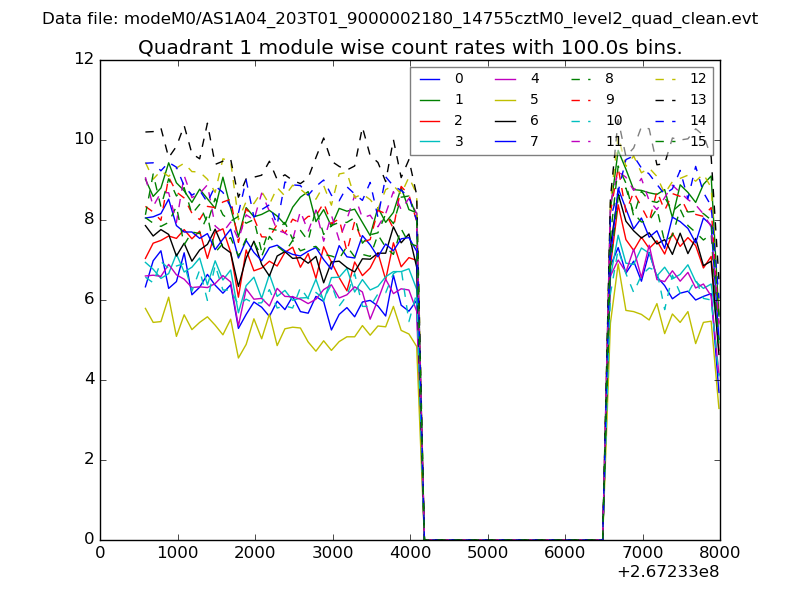
| Module-wise count rates for Quadrant A Data is divided into 100 sec bins |
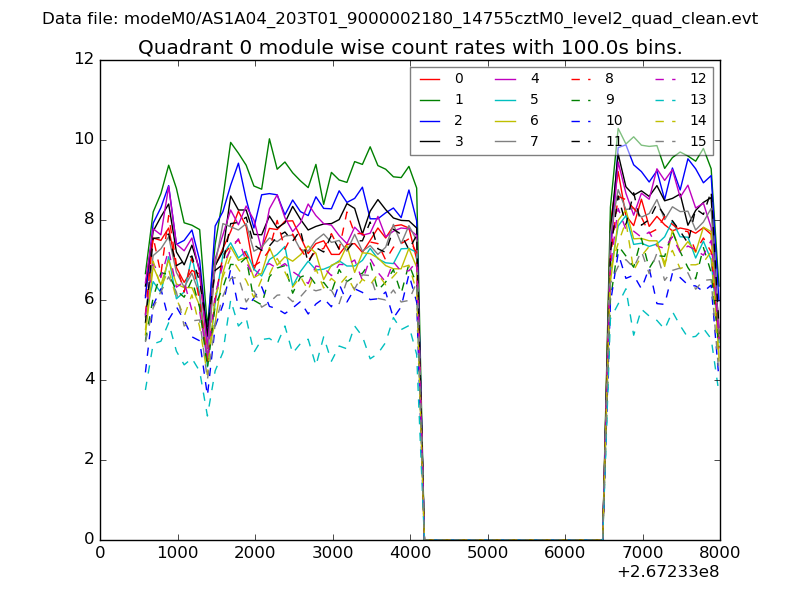 |
 |
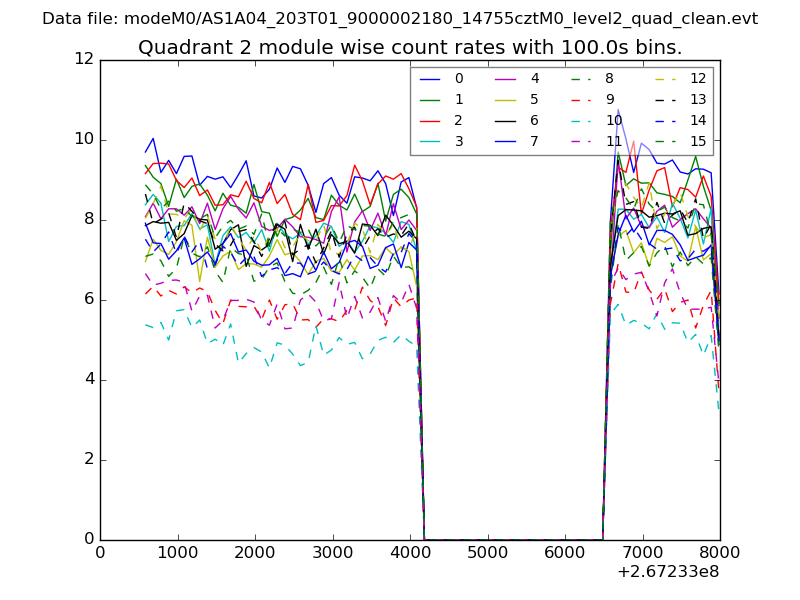
| Module-wise count rates for Quadrant B Data is divided into 100 sec bins |
 |
 |
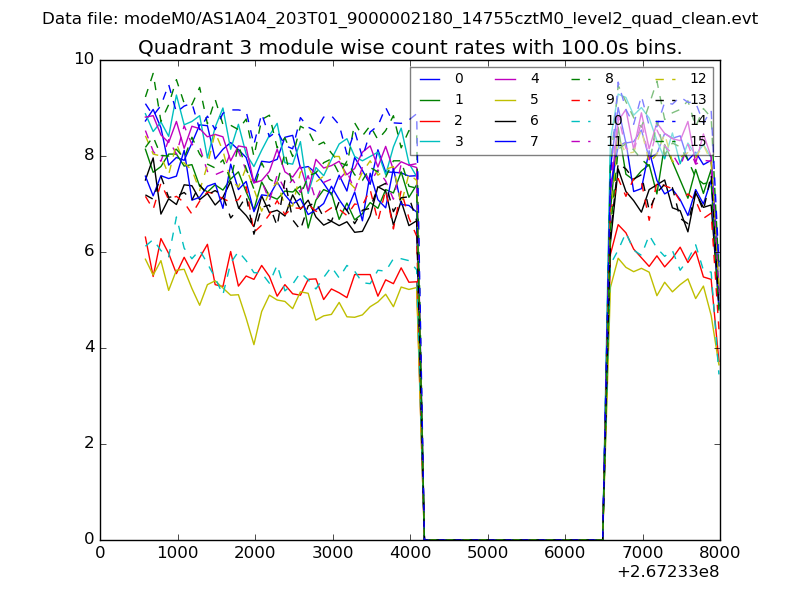
| Module-wise count rates for Quadrant C Data is divided into 100 sec bins |
 |
 |
| Module-wise count rates for Quadrant D Data is divided into 100 sec bins |
 |
 |
| Parameter | Plot |
|---|---|
| CZT HV Monitor | 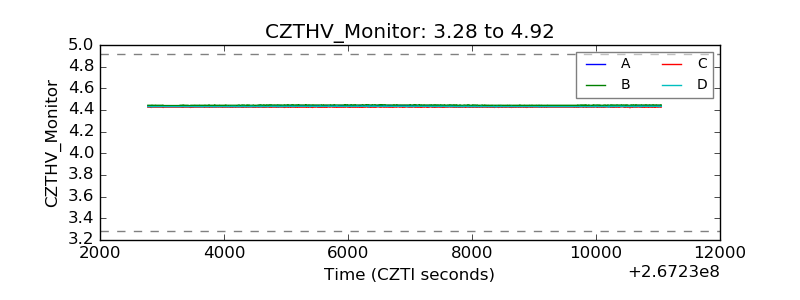 |
| D_VDD | 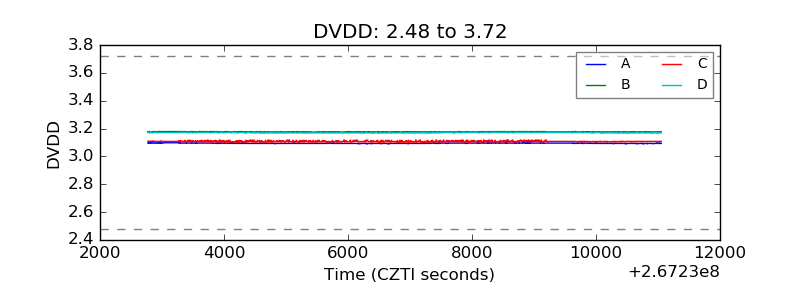 |
| Temperature 1 | 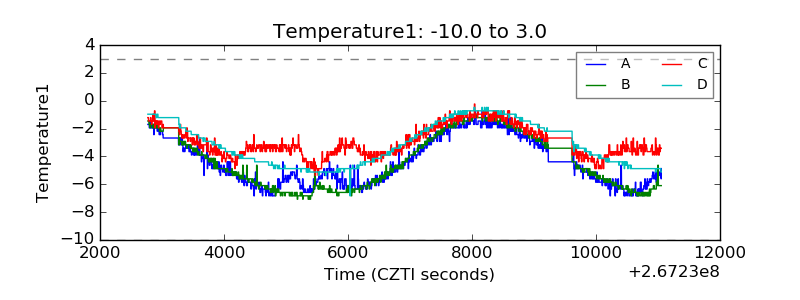 |
| Veto HV Monitor | 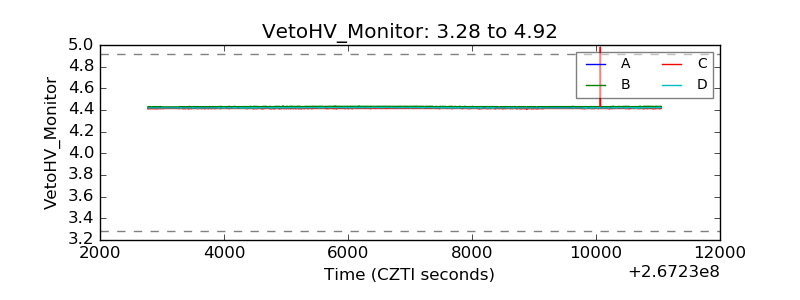 |
| Veto LLD | 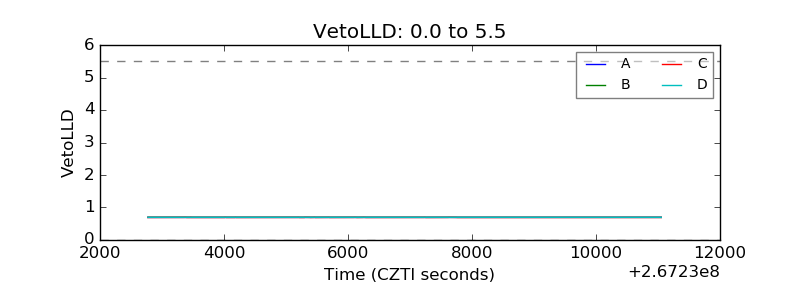 |
| Alpha Counter | 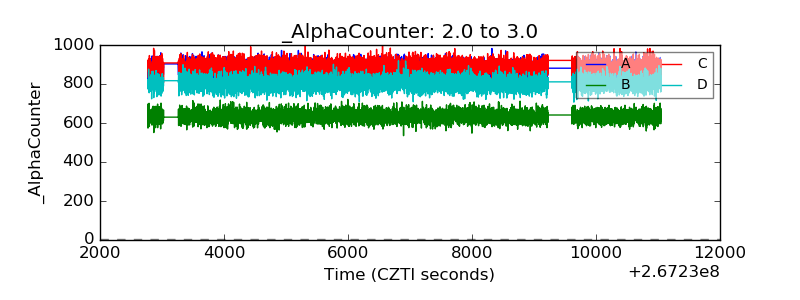 |
| _CPM_Rate | 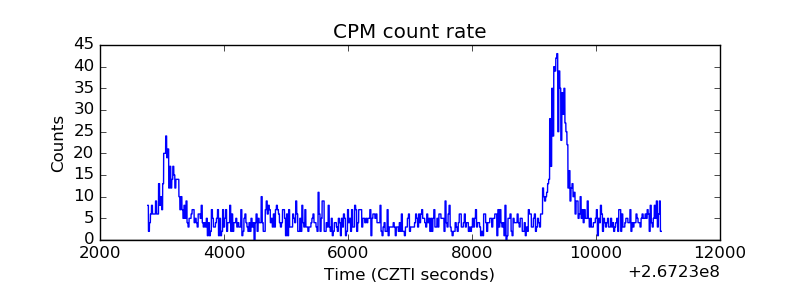 |
| CZT Counter | 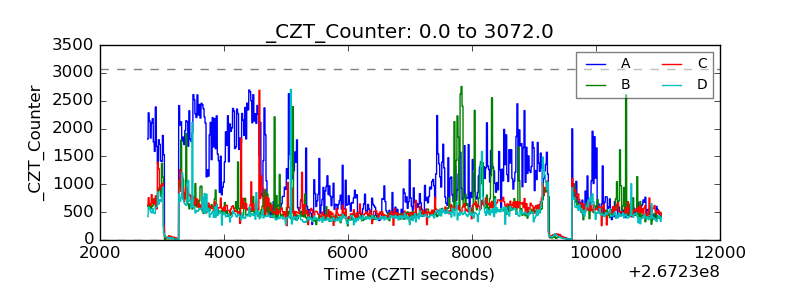 |
| +2.5 Volts monitor | 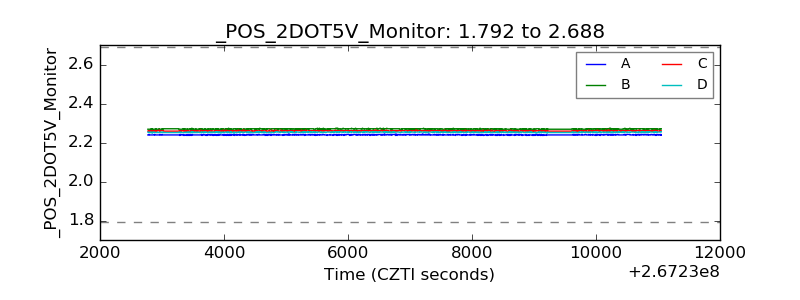 |
| +5 Volts monitor | 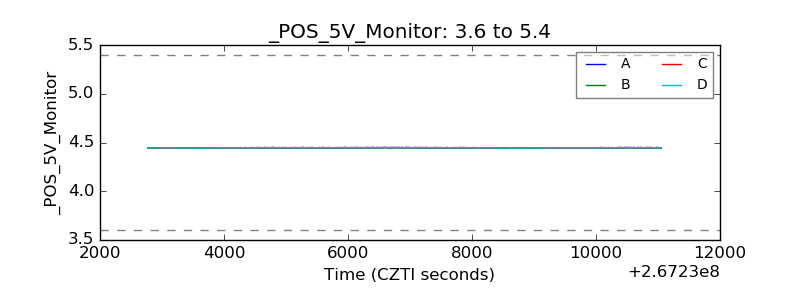 |
| _ROLL_ROT | 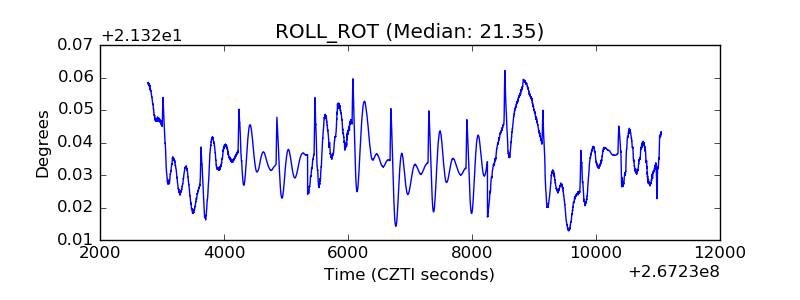 |
| _Roll_DEC |  |
| _Roll_RA | 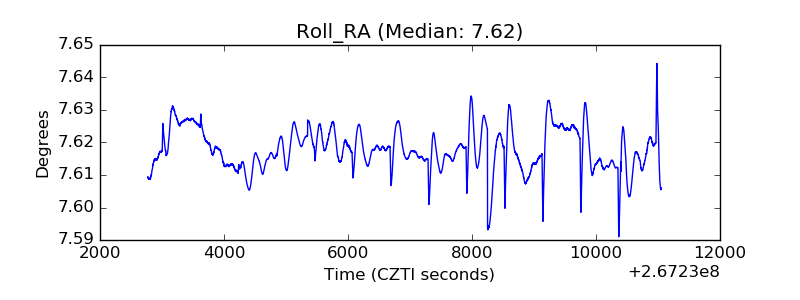 |
| Veto Counter | 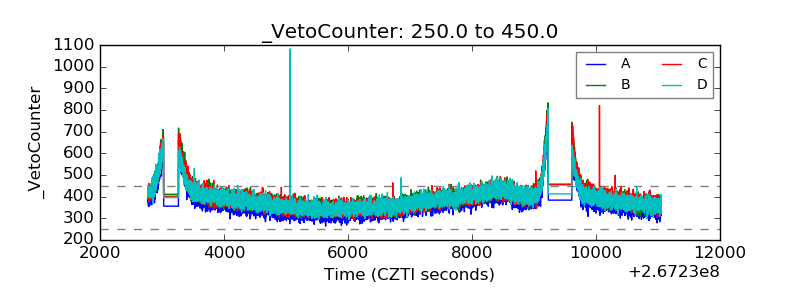 |