| Param | Original file | Final file |
|---|---|---|
| Filename | modeM0/AS1G08_081T01_9000002178cztM0_level2.fits | modeM0/AS1G08_081T01_9000002178cztM0_level2_quad_clean.evt |
| Size (bytes) | 649,739,520 | 598,351,680 |
| Size | 619.6 MB | 570.6 MB |
| Events in quadrant A | 3,962,784 | 3,559,458 |
| Events in quadrant B | 3,822,364 | 3,519,726 |
| Events in quadrant C | 3,927,014 | 3,330,098 |
| Events in quadrant D | 3,482,360 | 3,228,416 |
| Mode M0 | |||
|---|---|---|---|
| Quadrant | BADHDUFLAG | Total packets | Discarded packets |
| A | 0 | 164917 | 0 |
| B | 0 | 142047 | 0 |
| C | 0 | 140362 | 0 |
| D | 0 | 139218 | 0 |
| Mode SS | |||
|---|---|---|---|
| Quadrant | BADHDUFLAG | Total packets | Discarded packets |
| A | 0 | 1330 | 0 |
| B | 0 | 1330 | 0 |
| C | 0 | 1330 | 0 |
| D | 0 | 1330 | 0 |
| Mode M9 | |||
|---|---|---|---|
| Quadrant | BADHDUFLAG | Total packets | Discarded packets |
| A | 0 | 111 | 0 |
| B | 0 | 111 | 0 |
| C | 0 | 111 | 0 |
| D | 0 | 111 | 0 |
| Quadrant | Total seconds | Saturated seconds | Saturation percentage |
|---|---|---|---|
| A | 65372 | 1803 | 2.758062% |
| B | 65372 | 1000 | 1.529707% |
| C | 65372 | 601 | 0.919354% |
| D | 65372 | 638 | 0.975953% |
Noise dominated data is calculated using 1-second bins in cleaned event files. If a bin has >2000 counts, and if more than 50% of those come from <1% of pixels, then it is considered to be noise-dominated and hence unusable.
| Quadrant | # 1 sec bins | Bins with >0 counts | Bins with >2000 counts | High rate bins dominated by noise | Noise dominated (total time) | Noise dominated (detector-on time) | Marked lightcurve |
|---|---|---|---|---|---|---|---|
| A | 76412 | 65359 | 0 | 0 | 0.00% | 0.00% |  |
| B | 76411 | 65358 | 0 | 0 | 0.00% | 0.00% | 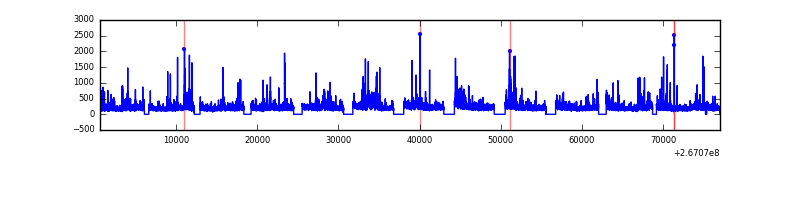 |
| C | 76412 | 65361 | 0 | 0 | 0.00% | 0.00% |  |
| D | 76412 | 65360 | 0 | 0 | 0.00% | 0.00% |  |
Top three noisy pixels from each quadrant. If the there are fewer than three noisy pixels in the level2.evt file, extra rows are filled as -1
| Pixel properties | Quadrant properties | ||||||
|---|---|---|---|---|---|---|---|
| Quadrant | DetID | PixID | Counts | Sigma | Mean | Median | Sigma |
| A | 0 | 29 | 3872 | 11.25 | 1033 | 968 | 258.2 |
| A | 7 | 110 | 3099 | 8.25 | 1033 | 968 | 258.2 |
| A | 15 | 236 | 3054 | 8.08 | 1033 | 968 | 258.2 |
| B | 2 | 9 | 3295 | 11.59 | 1010 | 964 | 201.1 |
| B | 3 | 17 | 2528 | 7.78 | 1010 | 964 | 201.1 |
| B | 5 | 128 | 2468 | 7.48 | 1010 | 964 | 201.1 |
| C | 1 | 80 | 2888 | 7.13 | 1037 | 967 | 269.3 |
| C | 1 | 81 | 2808 | 6.84 | 1037 | 967 | 269.3 |
| C | 12 | 241 | 2741 | 6.59 | 1037 | 967 | 269.3 |
| D | 6 | 231 | 2619 | 6.46 | 993 | 905 | 265.3 |
| D | 3 | 14 | 2529 | 6.12 | 993 | 905 | 265.3 |
| D | 10 | 189 | 2418 | 5.7 | 993 | 905 | 265.3 |
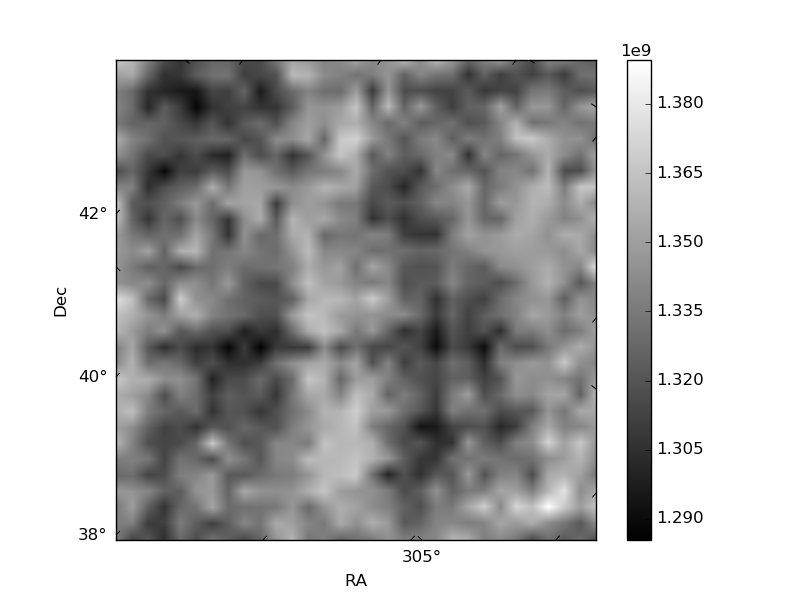
Histogram calculated using DETX and DETY for each event in the final _common_clean file
| Quadrant A |  |
 |
Quadrant B |
|---|---|---|---|
| Quadrant D | 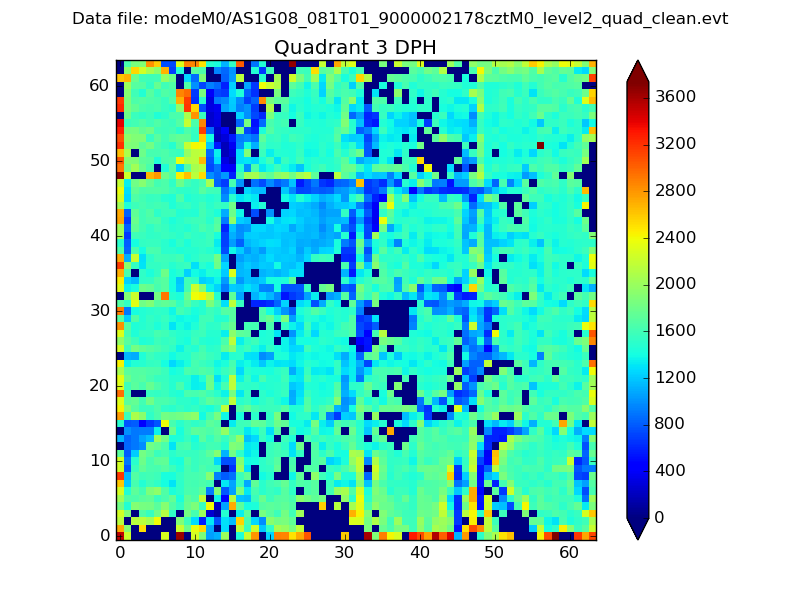 |
 |
Quadrant C |
| Plot type | Count rate plots | Images |
|---|---|---|
| Comparison with Poisson distribution Blue bars denote a histogram of data divided into 1 sec bins. Red curve is a Poisson curve with rate = median count rate of data. |
 |
 |
| Quadrant-wise count rates Data is divided into 100 sec bins |
 |
|
| Module-wise count rates for Quadrant A Data is divided into 100 sec bins |
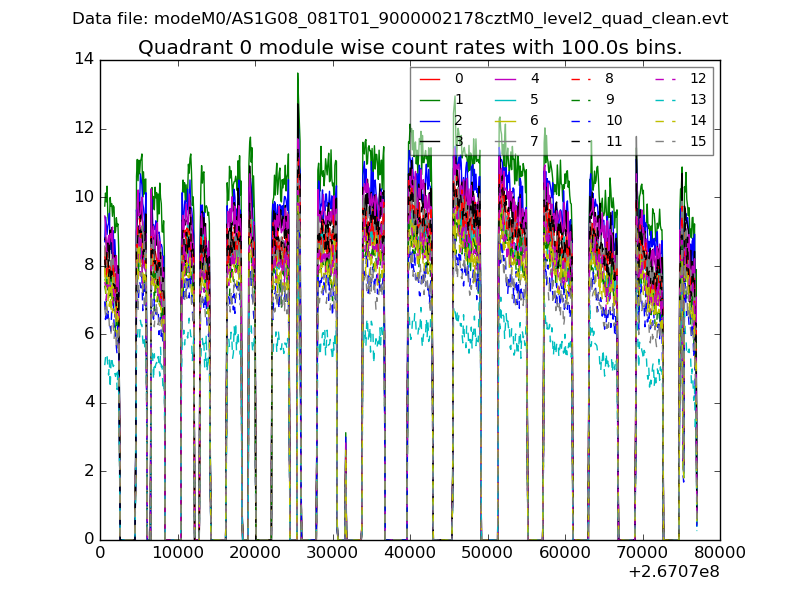 |
 |
| Module-wise count rates for Quadrant B Data is divided into 100 sec bins |
 |
 |
| Module-wise count rates for Quadrant C Data is divided into 100 sec bins |
 |
 |
| Module-wise count rates for Quadrant D Data is divided into 100 sec bins |
 |
 |
| Parameter | Plot |
|---|---|
| CZT HV Monitor |  |
| D_VDD |  |
| Temperature 1 |  |
| Veto HV Monitor |  |
| Veto LLD | 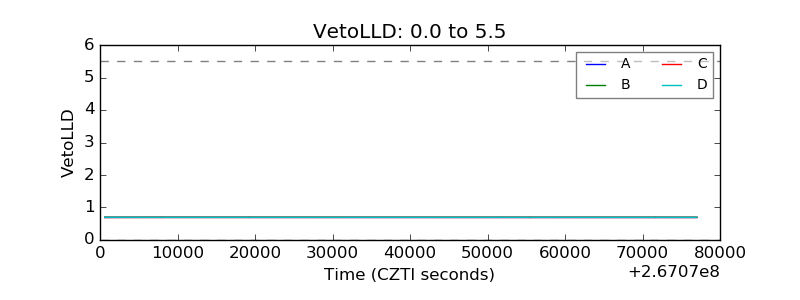 |
| Alpha Counter |  |
| _CPM_Rate | 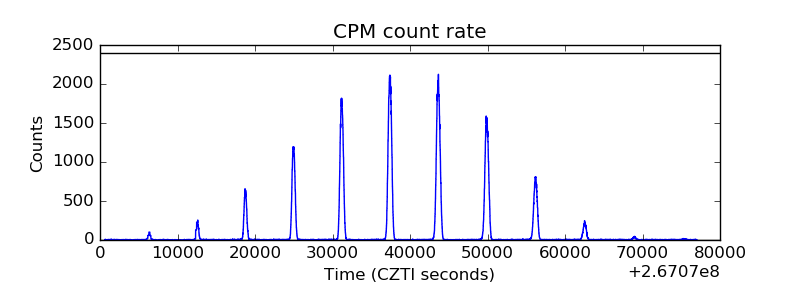 |
| CZT Counter |  |
| +2.5 Volts monitor | 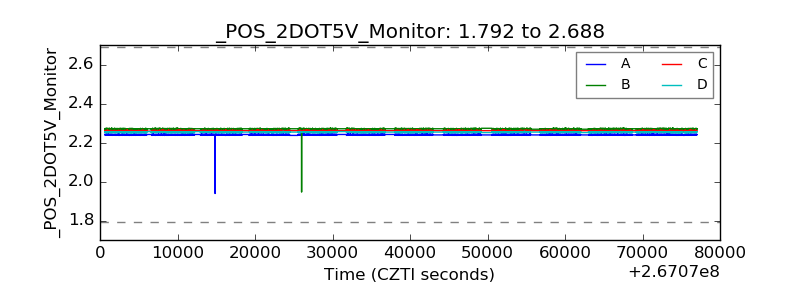 |
| +5 Volts monitor | 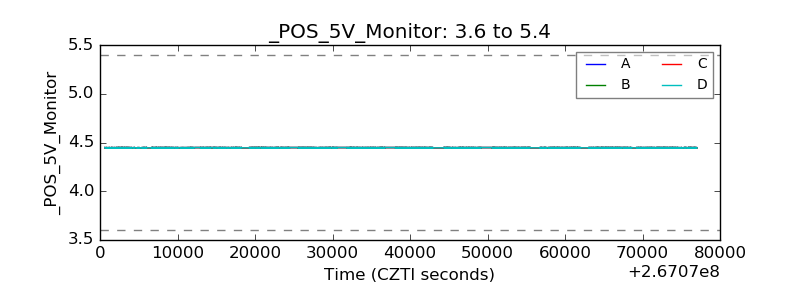 |
| _ROLL_ROT |  |
| _Roll_DEC |  |
| _Roll_RA |  |
| Veto Counter |  |