| Param | Original file | Final file |
|---|---|---|
| Filename | modeM0/AS1G08_081T01_9000002178_14726cztM0_level2.evt | modeM0/AS1G08_081T01_9000002178_14726cztM0_level2_quad_clean.evt |
| Size (bytes) | 79,315,200 | 23,699,520 |
| Size | 75.6 MB | 22.6 MB |
| Events in quadrant A | 600,794 | 158,766 |
| Events in quadrant B | 573,090 | 155,302 |
| Events in quadrant C | 578,604 | 152,508 |
| Events in quadrant D | 558,034 | 153,210 |
| Mode M0 | |||
|---|---|---|---|
| Quadrant | BADHDUFLAG | Total packets | Discarded packets |
| A | 0 | 2682 | 1 |
| B | 0 | 2632 | 0 |
| C | 0 | 2601 | 0 |
| D | 0 | 2703 | 0 |
| Mode SS | |||
|---|---|---|---|
| Quadrant | BADHDUFLAG | Total packets | Discarded packets |
| A | 0 | 26 | 0 |
| B | 0 | 26 | 0 |
| C | 0 | 26 | 0 |
| D | 0 | 26 | 0 |
| Quadrant | Total seconds | Saturated seconds | Saturation percentage |
|---|---|---|---|
| A | 1298 | 3 | 0.231125% |
| B | 1298 | 0 | 0.000000% |
| C | 1298 | 0 | 0.000000% |
| D | 1298 | 0 | 0.000000% |
Noise dominated data is calculated using 1-second bins in cleaned event files. If a bin has >2000 counts, and if more than 50% of those come from <1% of pixels, then it is considered to be noise-dominated and hence unusable.
| Quadrant | # 1 sec bins | Bins with >0 counts | Bins with >2000 counts | High rate bins dominated by noise | Noise dominated (total time) | Noise dominated (detector-on time) | Marked lightcurve |
|---|---|---|---|---|---|---|---|
| A | 1299 | 1299 | 2 | 2 | 0.15% | 0.15% | 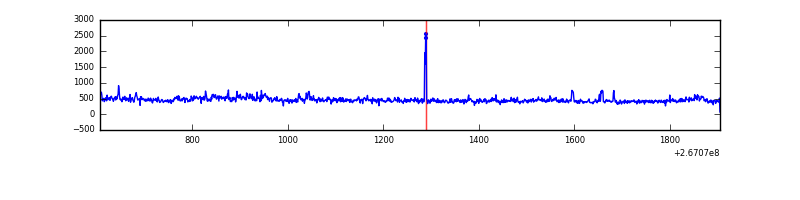 |
| B | 1299 | 1299 | 0 | 0 | 0.00% | 0.00% | 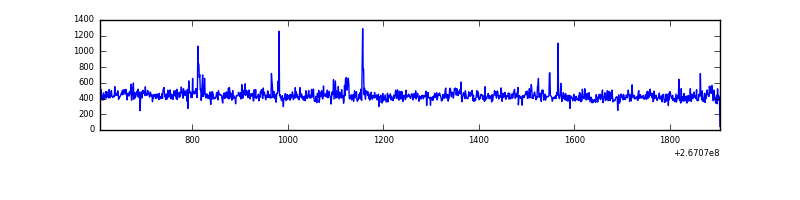 |
| C | 1299 | 1299 | 0 | 0 | 0.00% | 0.00% | 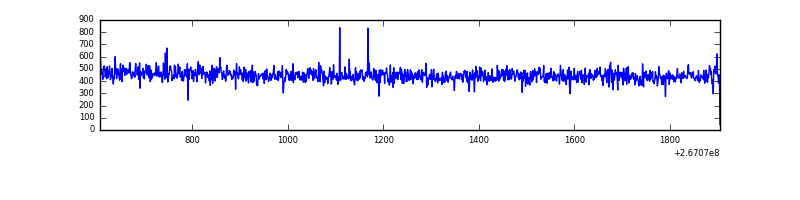 |
| D | 1299 | 1299 | 1 | 1 | 0.08% | 0.08% | 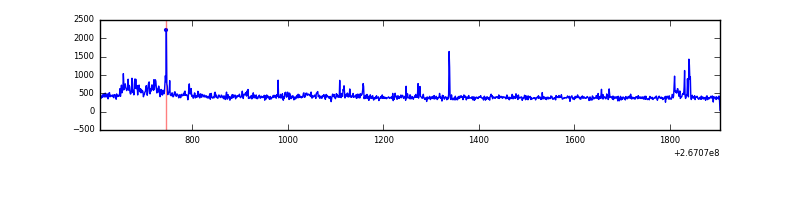 |
Top three noisy pixels from each quadrant. If the there are fewer than three noisy pixels in the level2.evt file, extra rows are filled as -1
| Pixel properties | Quadrant properties | ||||||
|---|---|---|---|---|---|---|---|
| Quadrant | DetID | PixID | Counts | Sigma | Mean | Median | Sigma |
| A | 12 | 189 | 36368 | 1199.2 | 137 | 134 | 30.2 |
| A | 8 | 15 | 25086 | 825.81 | 137 | 134 | 30.2 |
| A | 9 | 143 | 9292 | 303.09 | 137 | 134 | 30.2 |
| B | 0 | 229 | 17749 | 613.31 | 138 | 135 | 28.7 |
| B | 0 | 205 | 5831 | 198.33 | 138 | 135 | 28.7 |
| B | 0 | 230 | 4377 | 147.71 | 138 | 135 | 28.7 |
| C | 3 | 233 | 51701 | 1559.5 | 135 | 135 | 33.1 |
| C | 13 | 61 | 928 | 23.98 | 135 | 135 | 33.1 |
| C | 6 | 96 | 574 | 13.28 | 135 | 135 | 33.1 |
| D | 12 | 16 | 31186 | 923.3 | 133 | 128 | 33.6 |
| D | 13 | 238 | 9405 | 275.79 | 133 | 128 | 33.6 |
| D | 15 | 0 | 5171 | 149.92 | 133 | 128 | 33.6 |
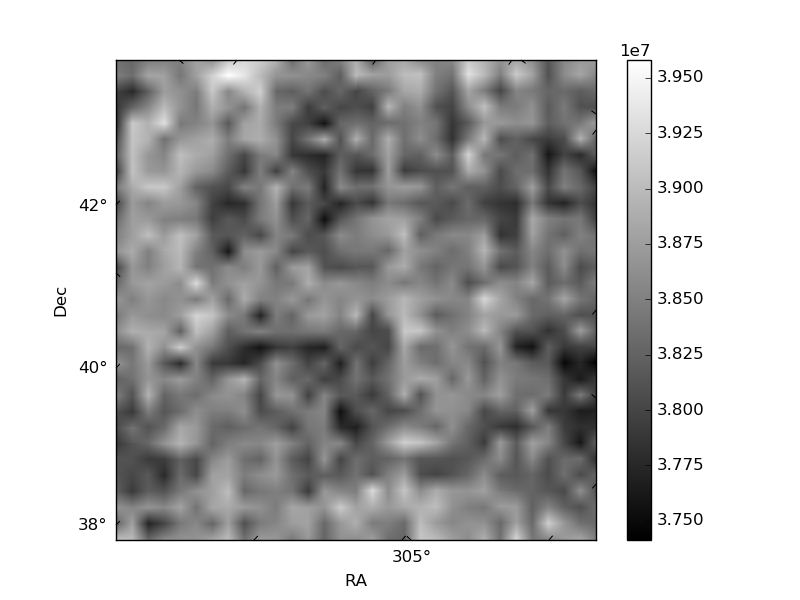
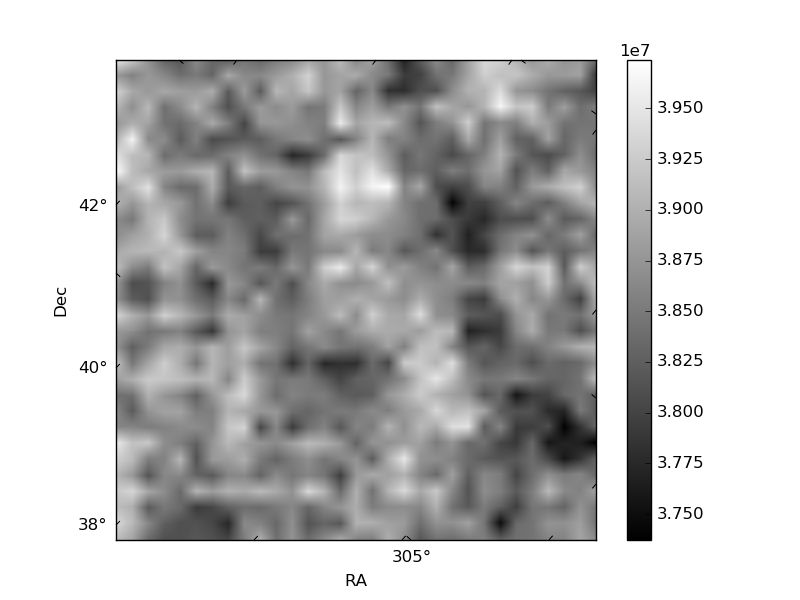
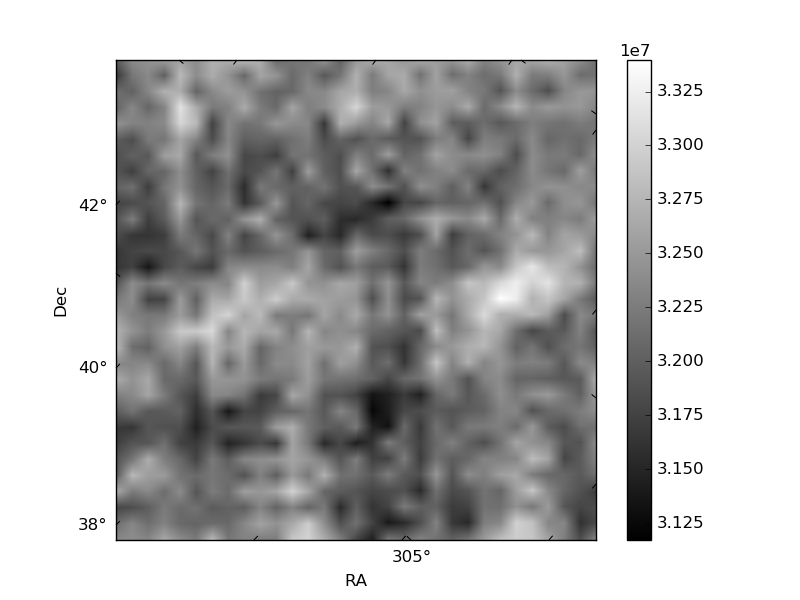
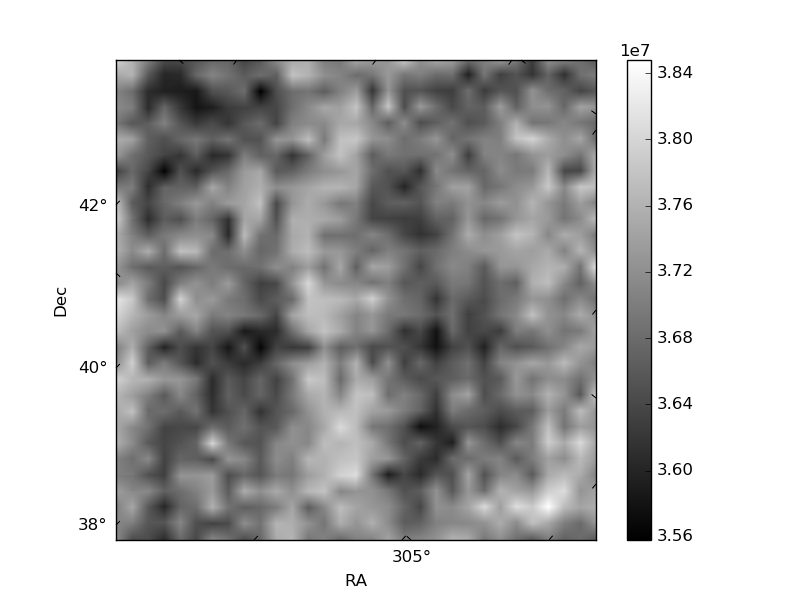
Histogram calculated using DETX and DETY for each event in the final _common_clean file
| Quadrant A | 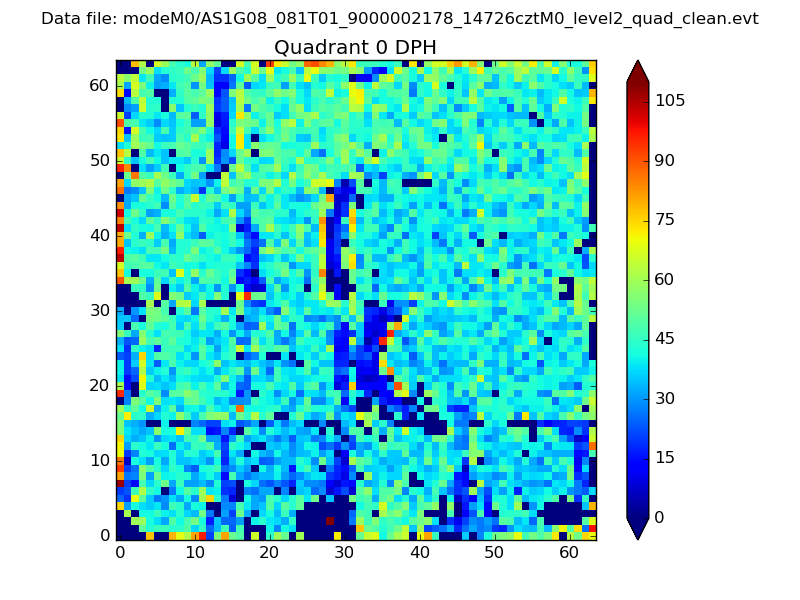 |
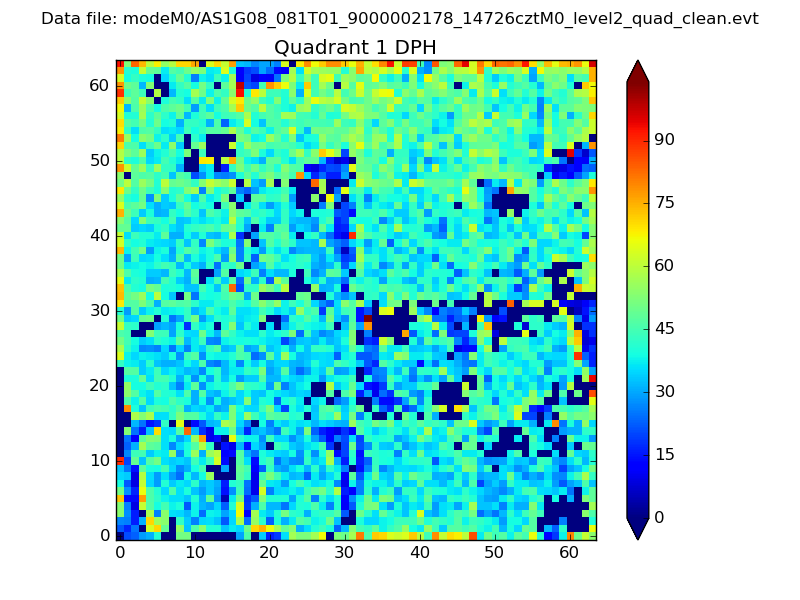 |
Quadrant B |
|---|---|---|---|
| Quadrant D | 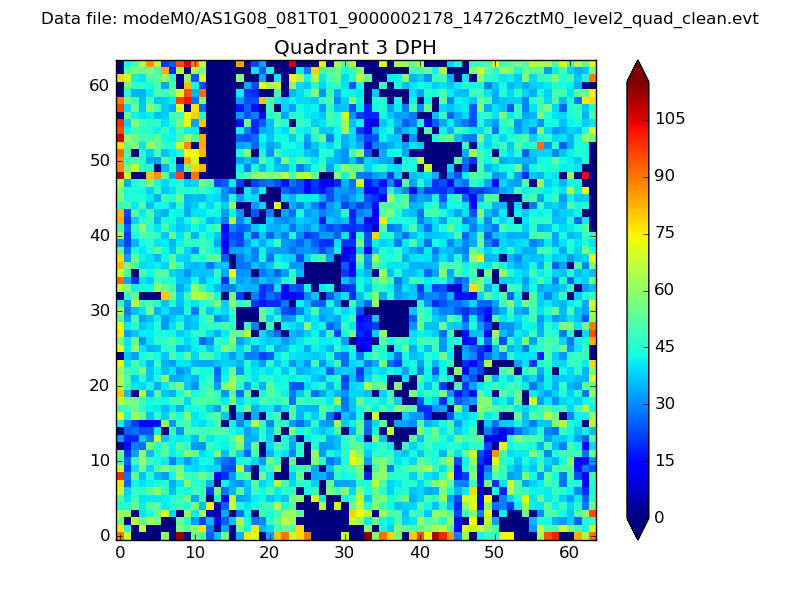 |
 |
Quadrant C |
| Plot type | Count rate plots | Images |
|---|---|---|
| Comparison with Poisson distribution Blue bars denote a histogram of data divided into 1 sec bins. Red curve is a Poisson curve with rate = median count rate of data. |
 |
 |
| Quadrant-wise count rates Data is divided into 100 sec bins |
 |
|
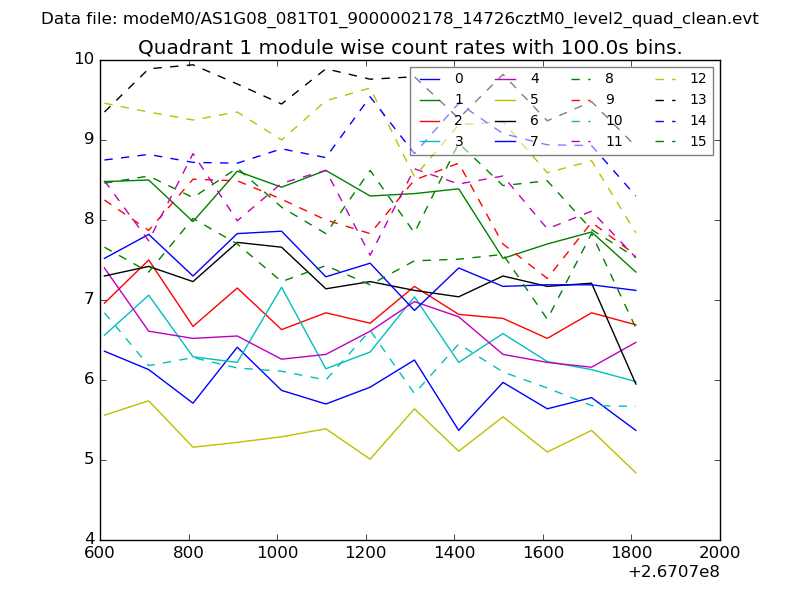
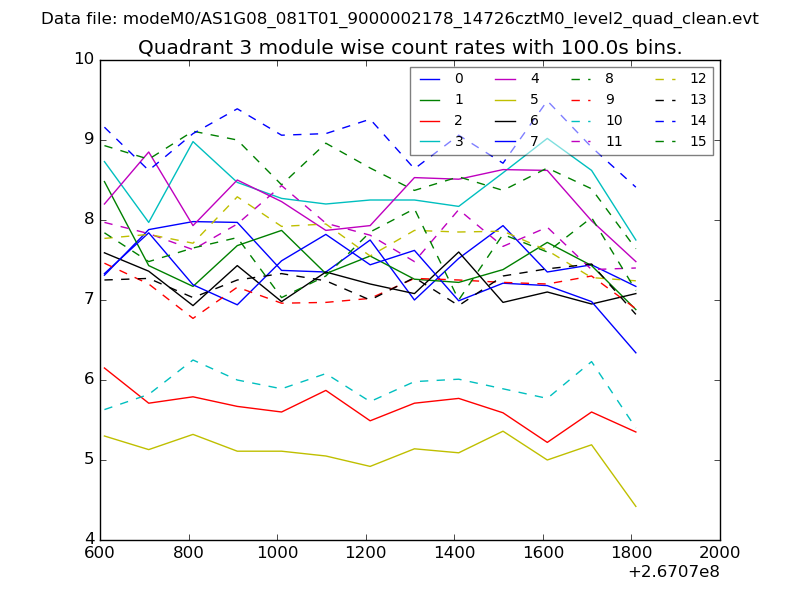
| Module-wise count rates for Quadrant A Data is divided into 100 sec bins |
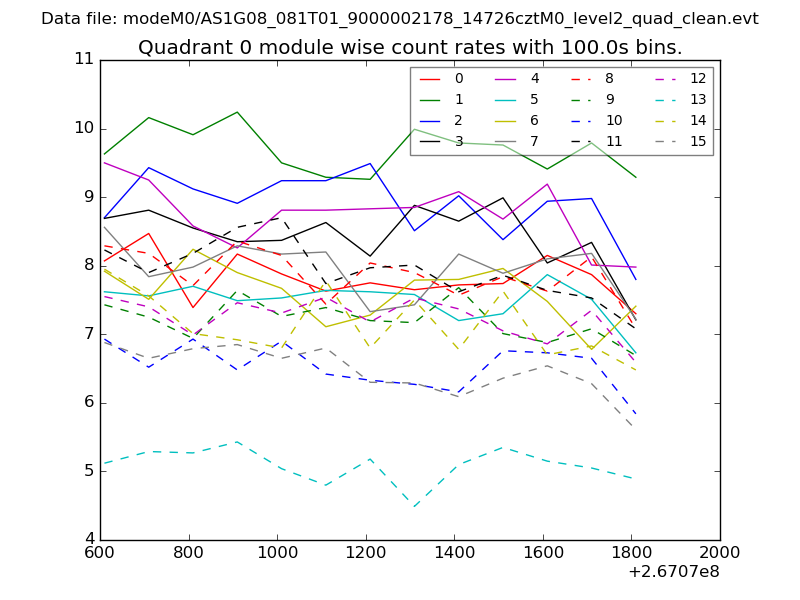 |
 |
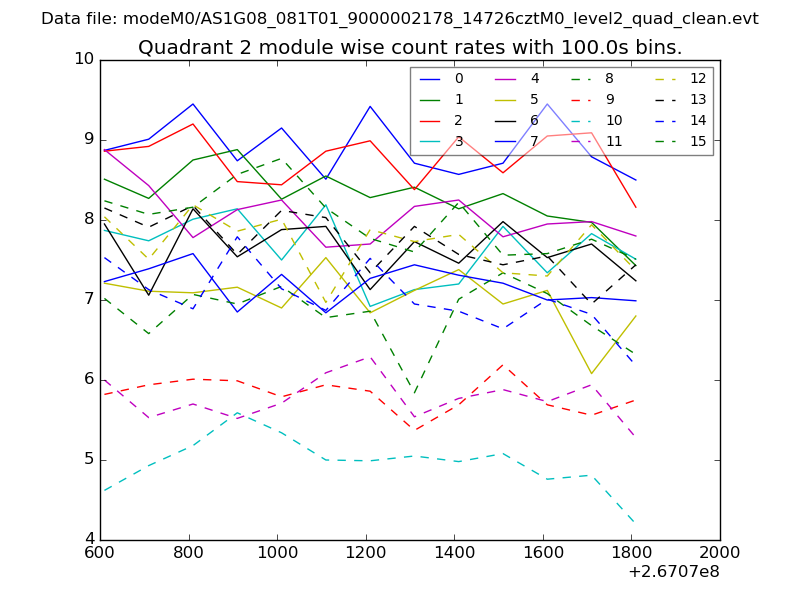
| Module-wise count rates for Quadrant B Data is divided into 100 sec bins |
 |
 |
| Module-wise count rates for Quadrant C Data is divided into 100 sec bins |
 |
 |
| Module-wise count rates for Quadrant D Data is divided into 100 sec bins |
 |
 |
| Parameter | Plot |
|---|---|
| CZT HV Monitor | 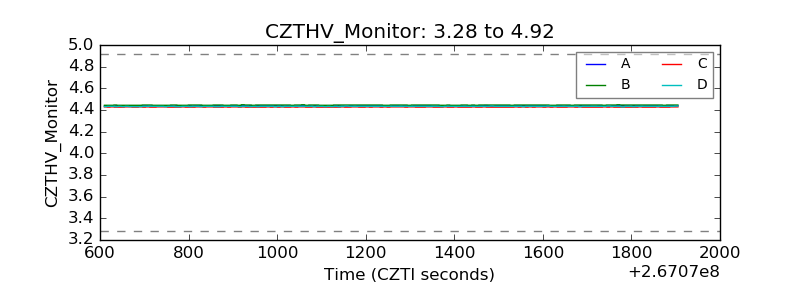 |
| D_VDD | 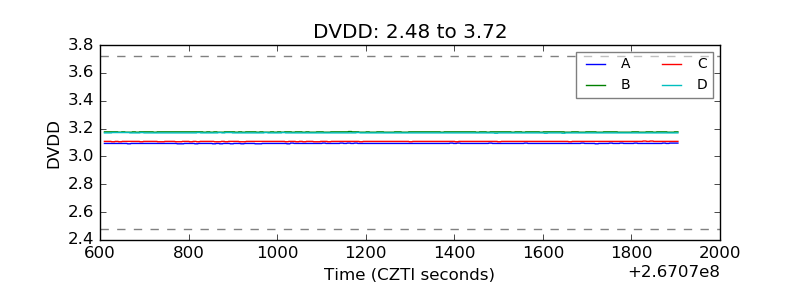 |
| Temperature 1 | 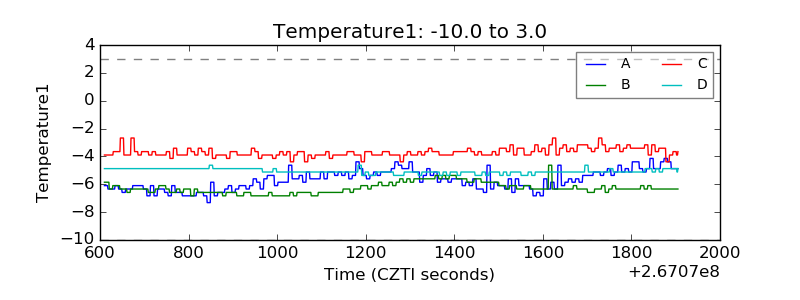 |
| Veto HV Monitor | 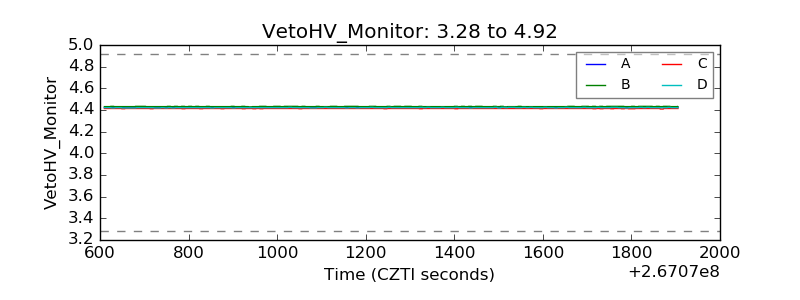 |
| Veto LLD | 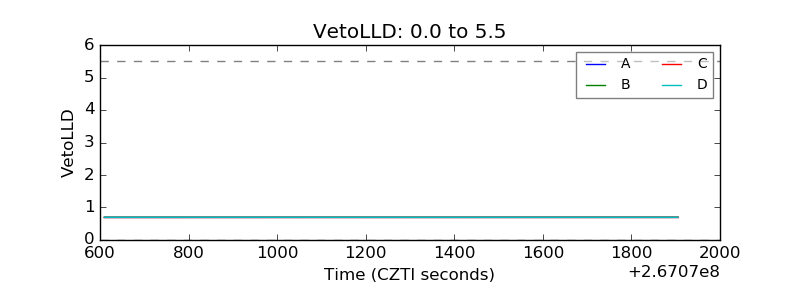 |
| Alpha Counter |  |
| _CPM_Rate | 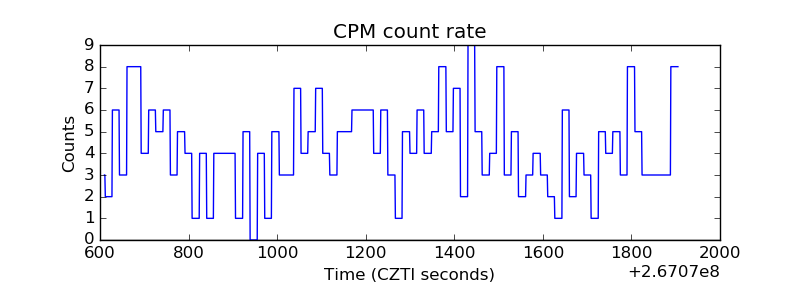 |
| CZT Counter | 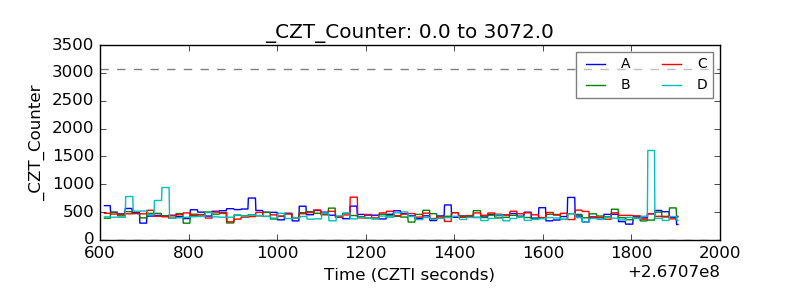 |
| +2.5 Volts monitor |  |
| +5 Volts monitor |  |
| _ROLL_ROT | 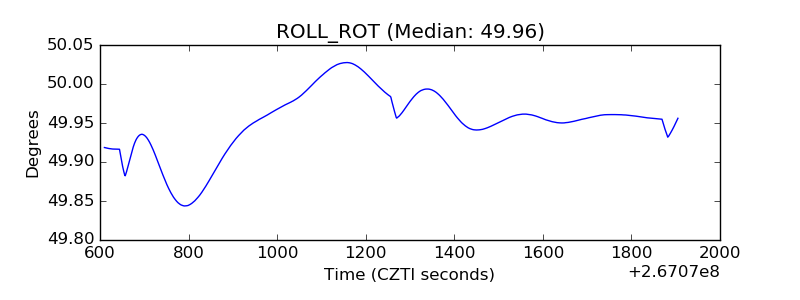 |
| _Roll_DEC | 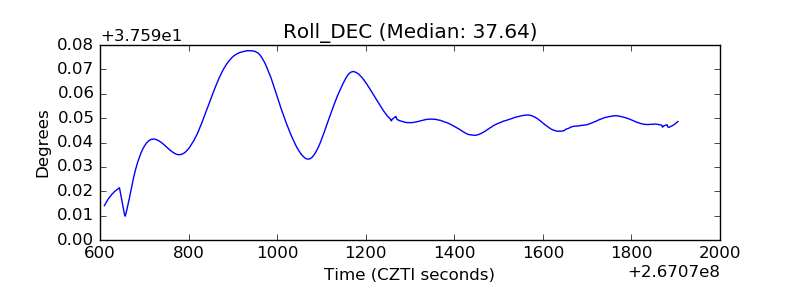 |
| _Roll_RA |  |
| Veto Counter | 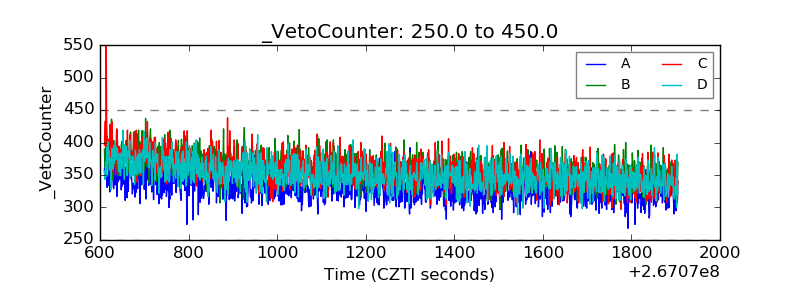 |