| Param | Original file | Final file |
|---|---|---|
| Filename | modeM0/AS1G08_081T01_9000002178_14729cztM0_level2.evt | modeM0/AS1G08_081T01_9000002178_14729cztM0_level2_quad_clean.evt |
| Size (bytes) | 418,700,160 | 80,475,840 |
| Size | 399.3 MB | 76.7 MB |
| Events in quadrant A | 3,158,241 | 506,065 |
| Events in quadrant B | 3,064,659 | 501,649 |
| Events in quadrant C | 3,089,725 | 491,667 |
| Events in quadrant D | 2,932,348 | 490,915 |
| Mode M0 | |||
|---|---|---|---|
| Quadrant | BADHDUFLAG | Total packets | Discarded packets |
| A | 0 | 13347 | 2 |
| B | 0 | 13117 | 1 |
| C | 0 | 13053 | 1 |
| D | 0 | 13185 | 1 |
| Mode SS | |||
|---|---|---|---|
| Quadrant | BADHDUFLAG | Total packets | Discarded packets |
| A | 0 | 130 | 0 |
| B | 0 | 130 | 0 |
| C | 0 | 130 | 0 |
| D | 0 | 130 | 0 |
| Mode M9 | |||
|---|---|---|---|
| Quadrant | BADHDUFLAG | Total packets | Discarded packets |
| A | 0 | 9 | 0 |
| B | 0 | 9 | 0 |
| C | 0 | 9 | 0 |
| D | 0 | 9 | 0 |
| Quadrant | Total seconds | Saturated seconds | Saturation percentage |
|---|---|---|---|
| A | 6400 | 44 | 0.687500% |
| B | 6400 | 48 | 0.750000% |
| C | 6400 | 30 | 0.468750% |
| D | 6400 | 34 | 0.531250% |
Noise dominated data is calculated using 1-second bins in cleaned event files. If a bin has >2000 counts, and if more than 50% of those come from <1% of pixels, then it is considered to be noise-dominated and hence unusable.
| Quadrant | # 1 sec bins | Bins with >0 counts | Bins with >2000 counts | High rate bins dominated by noise | Noise dominated (total time) | Noise dominated (detector-on time) | Marked lightcurve |
|---|---|---|---|---|---|---|---|
| A | 7296 | 6401 | 0 | 0 | 0.00% | 0.00% | 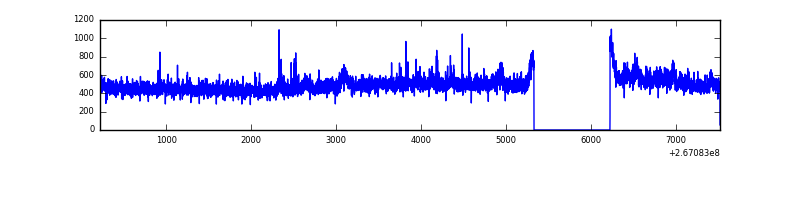 |
| B | 7296 | 6401 | 2 | 2 | 0.03% | 0.03% | 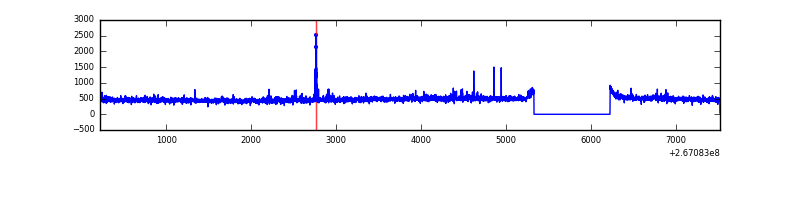 |
| C | 7296 | 6401 | 3 | 3 | 0.04% | 0.05% | 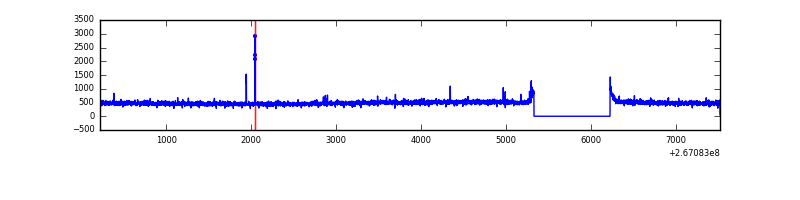 |
| D | 7296 | 6401 | 5 | 5 | 0.07% | 0.08% | 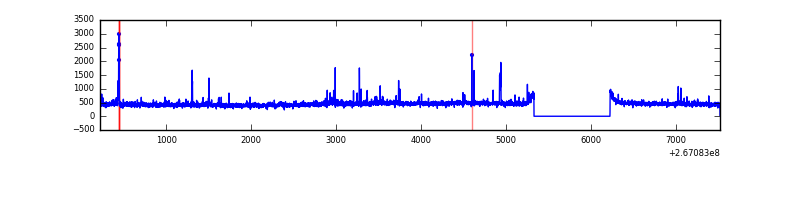 |
Top three noisy pixels from each quadrant. If the there are fewer than three noisy pixels in the level2.evt file, extra rows are filled as -1
| Pixel properties | Quadrant properties | ||||||
|---|---|---|---|---|---|---|---|
| Quadrant | DetID | PixID | Counts | Sigma | Mean | Median | Sigma |
| A | 8 | 15 | 134569 | 852.45 | 768 | 750 | 157.0 |
| A | 12 | 189 | 52469 | 329.46 | 768 | 750 | 157.0 |
| A | 1 | 162 | 7581 | 43.51 | 768 | 750 | 157.0 |
| B | 0 | 205 | 26359 | 174.0 | 760 | 741 | 147.2 |
| B | 4 | 48 | 18856 | 123.04 | 760 | 741 | 147.2 |
| B | 12 | 111 | 17571 | 114.31 | 760 | 741 | 147.2 |
| C | 3 | 233 | 199298 | 1165.0 | 733 | 738 | 170.4 |
| C | 4 | 254 | 27850 | 159.07 | 733 | 738 | 170.4 |
| C | 13 | 61 | 5383 | 27.25 | 733 | 738 | 170.4 |
| D | 12 | 16 | 55799 | 312.06 | 738 | 718 | 176.5 |
| D | 10 | 70 | 22407 | 122.88 | 738 | 718 | 176.5 |
| D | 2 | 234 | 21861 | 119.79 | 738 | 718 | 176.5 |
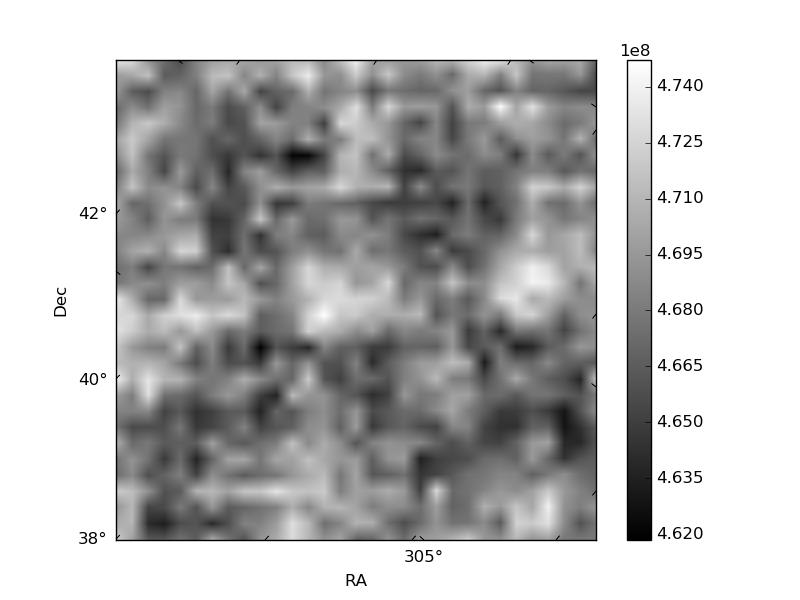
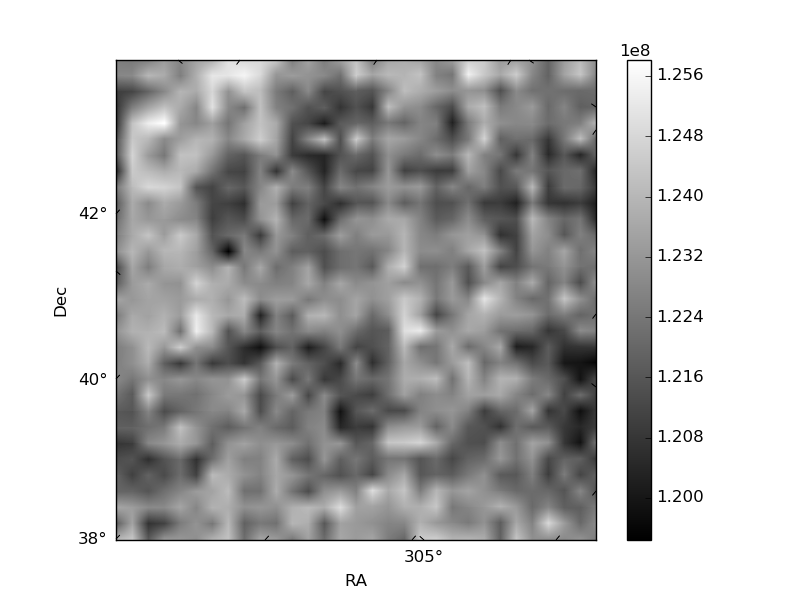
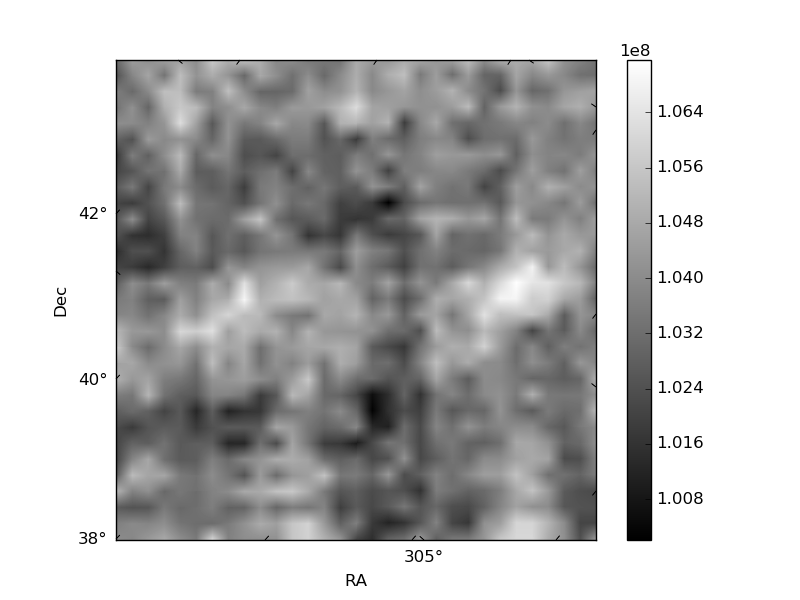
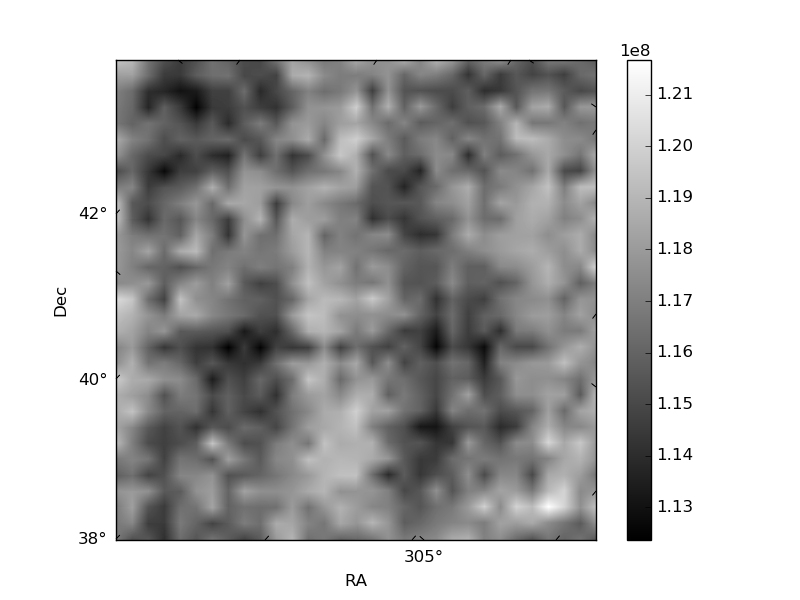
Histogram calculated using DETX and DETY for each event in the final _common_clean file
| Quadrant A | 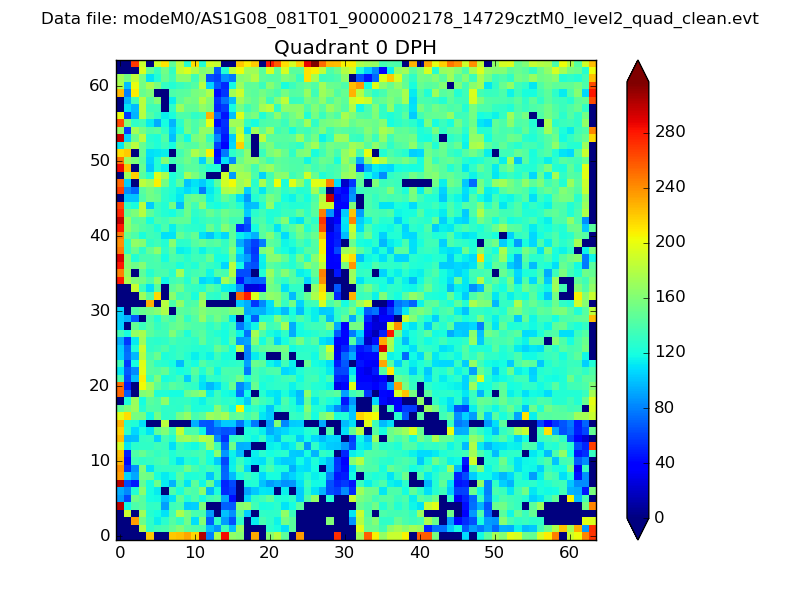 |
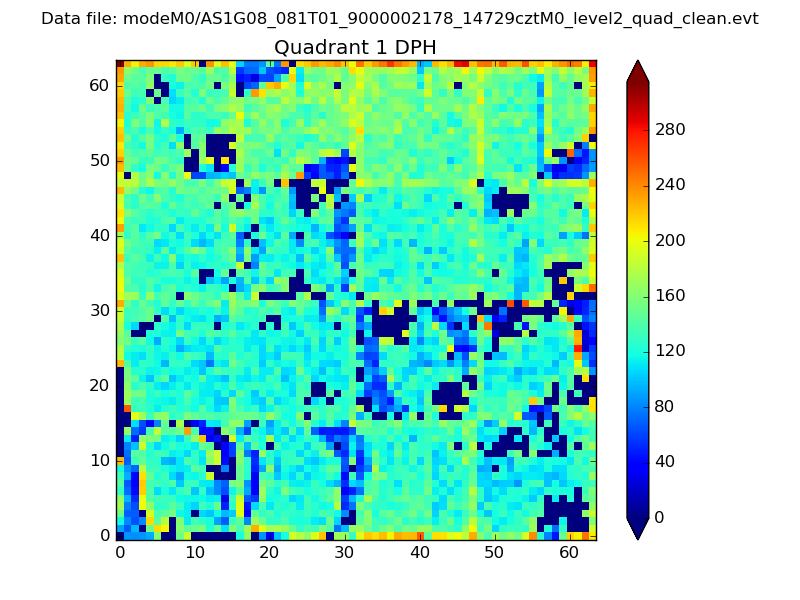 |
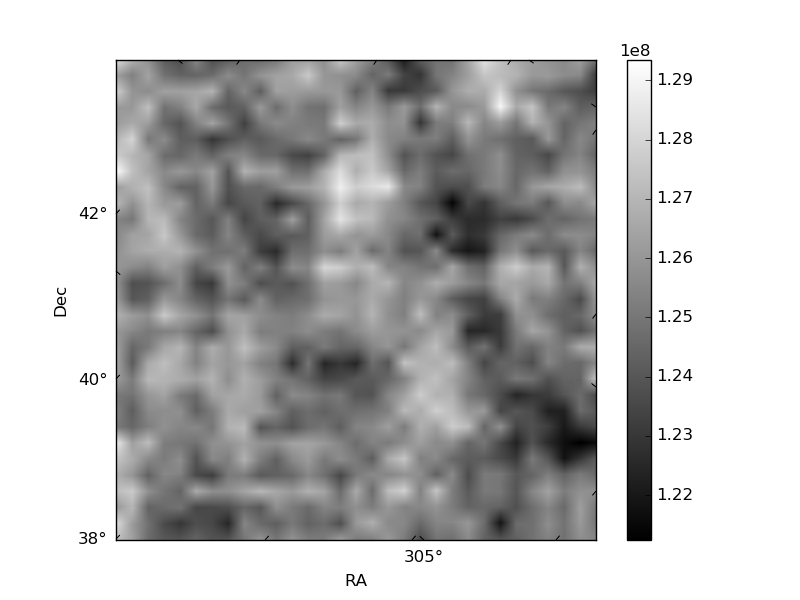
Quadrant B |
|---|---|---|---|
| Quadrant D | 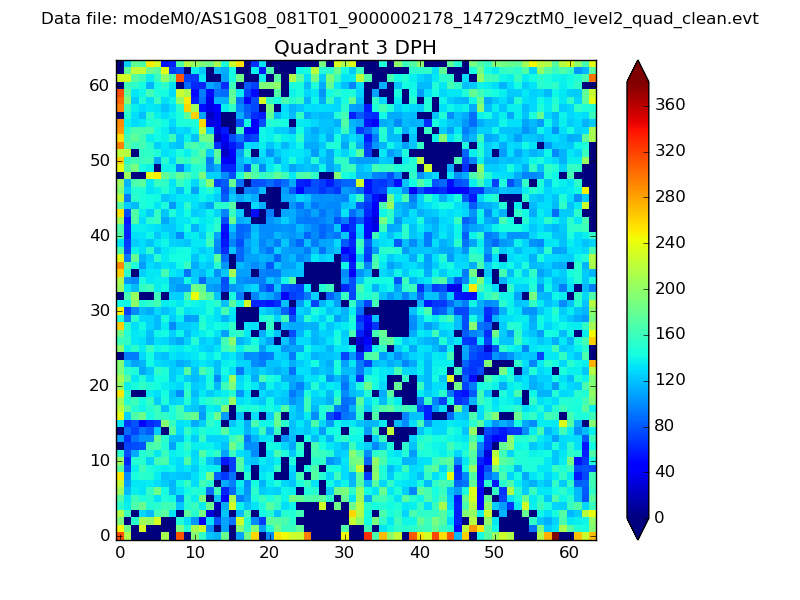 |
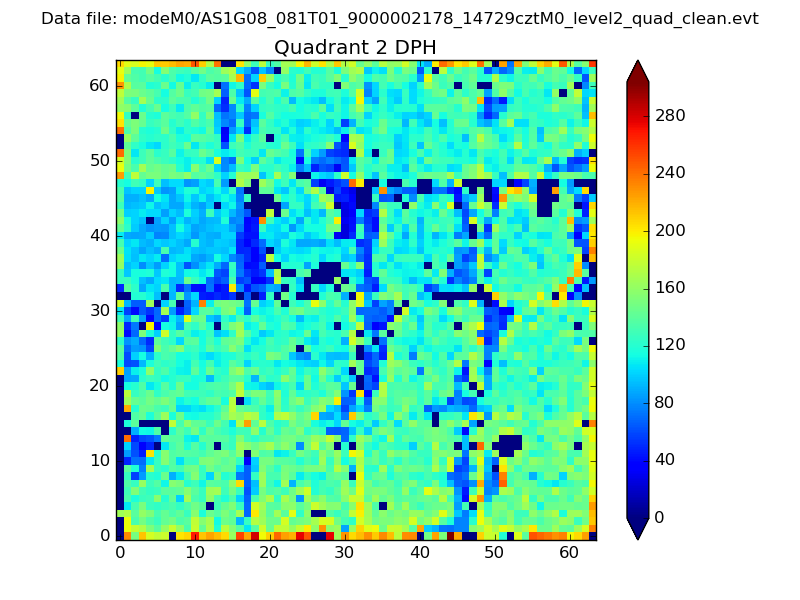 |
Quadrant C |
| Plot type | Count rate plots | Images |
|---|---|---|
| Comparison with Poisson distribution Blue bars denote a histogram of data divided into 1 sec bins. Red curve is a Poisson curve with rate = median count rate of data. |
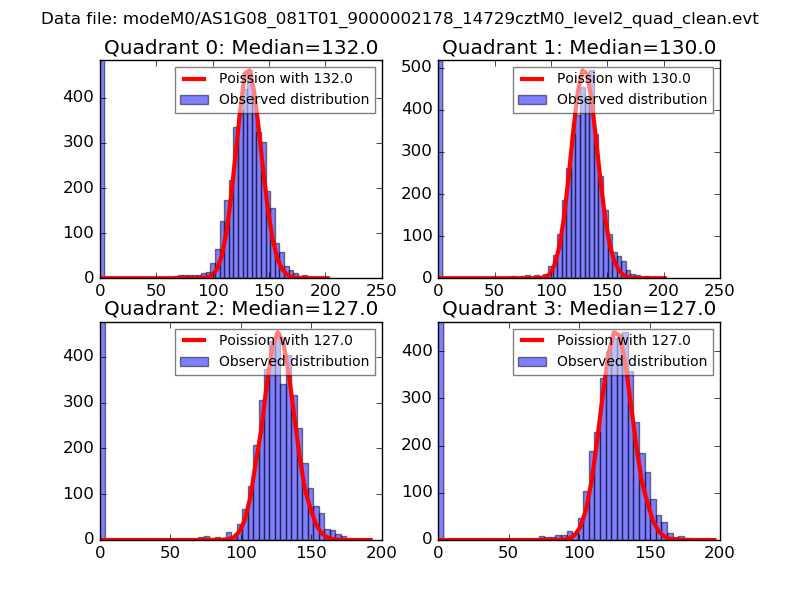 |
 |
| Quadrant-wise count rates Data is divided into 100 sec bins |
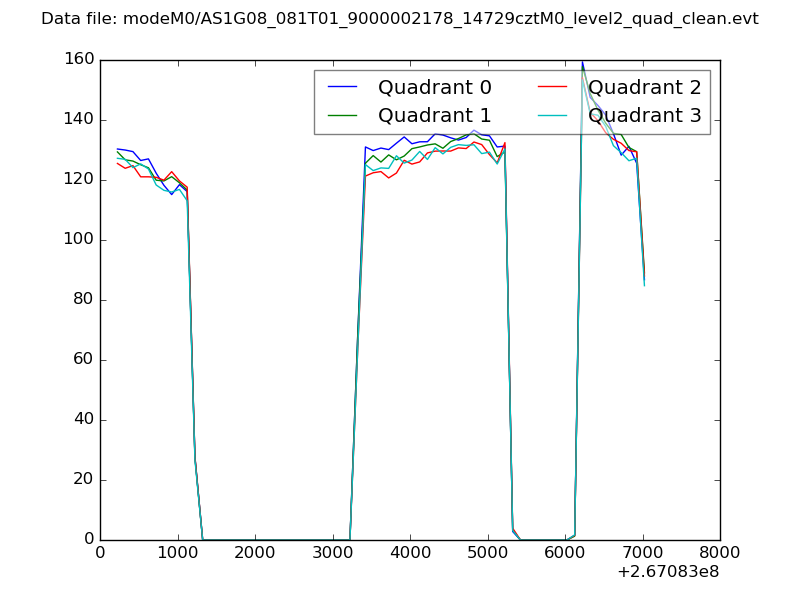 |
|
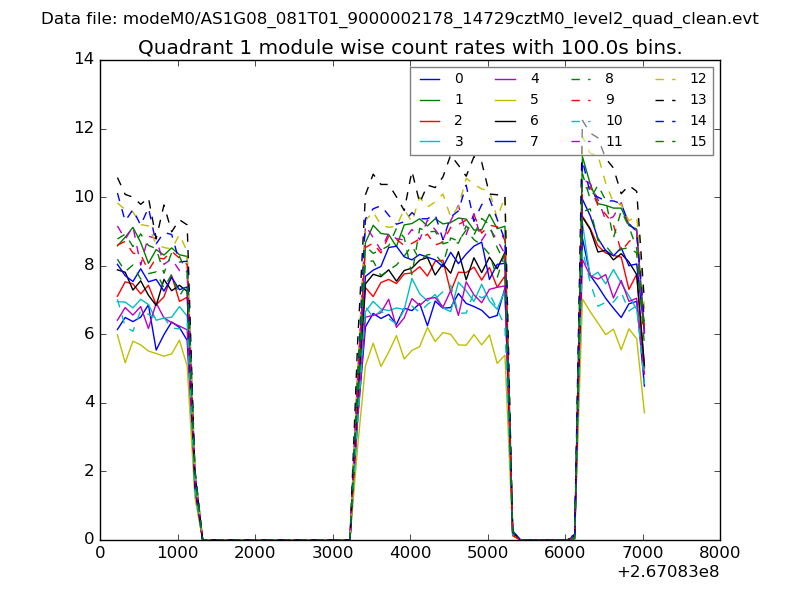
| Module-wise count rates for Quadrant A Data is divided into 100 sec bins |
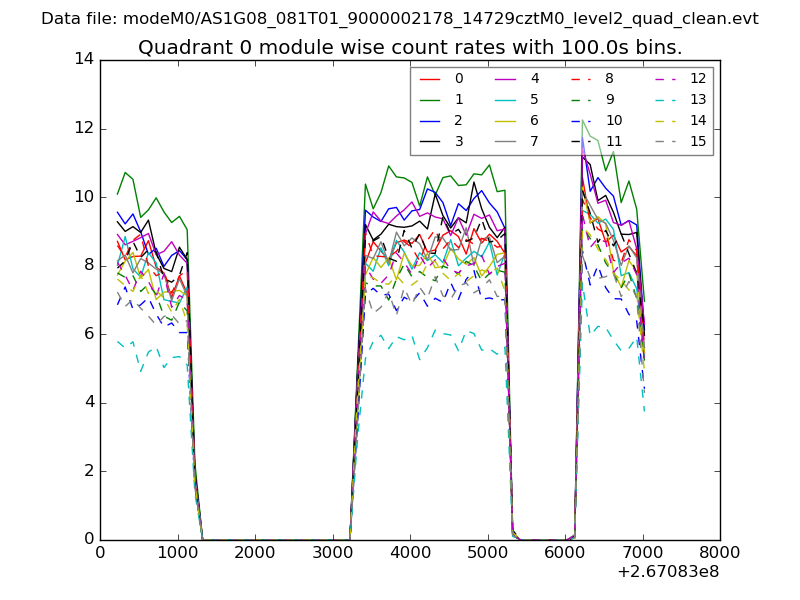 |
 |
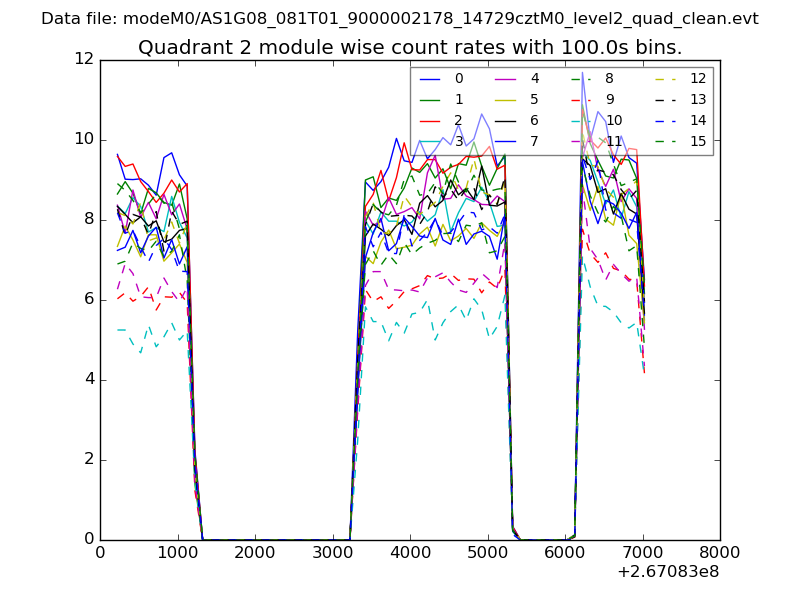
| Module-wise count rates for Quadrant B Data is divided into 100 sec bins |
 |
 |
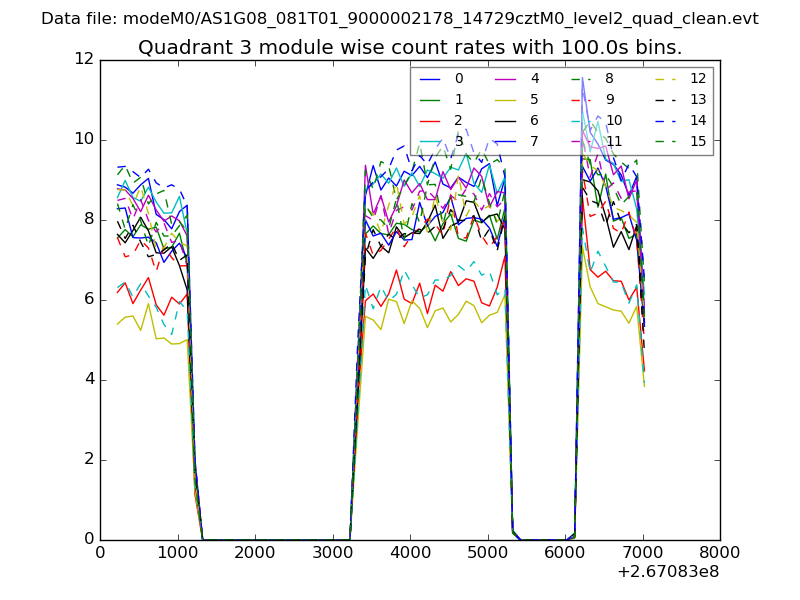
| Module-wise count rates for Quadrant C Data is divided into 100 sec bins |
 |
 |
| Module-wise count rates for Quadrant D Data is divided into 100 sec bins |
 |
 |
| Parameter | Plot |
|---|---|
| CZT HV Monitor | 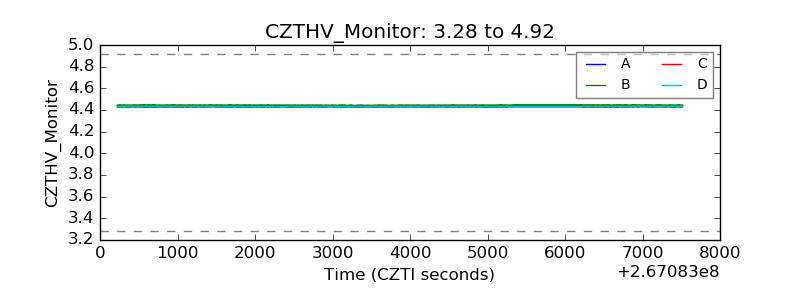 |
| D_VDD |  |
| Temperature 1 | 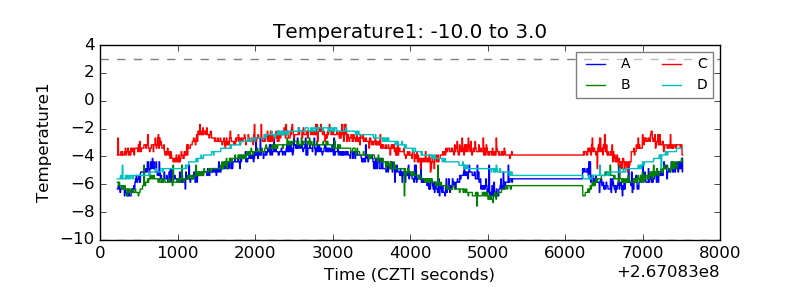 |
| Veto HV Monitor | 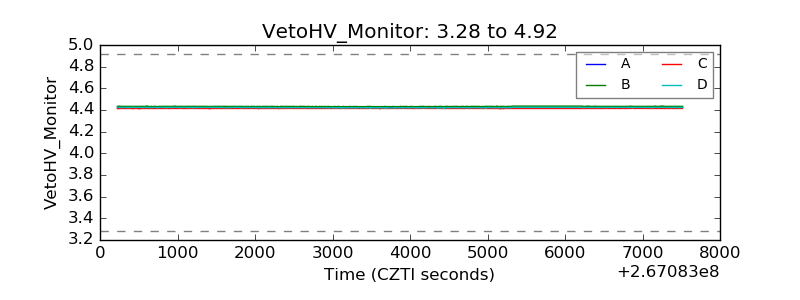 |
| Veto LLD | 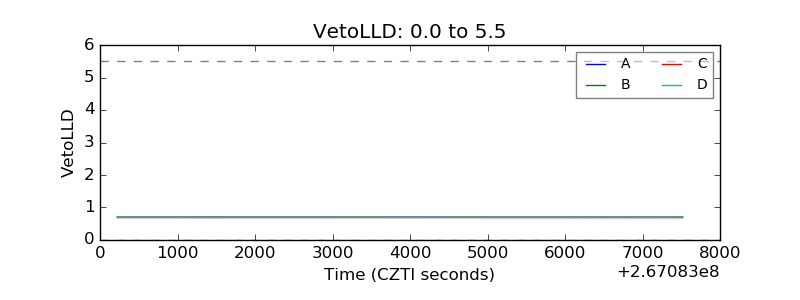 |
| Alpha Counter |  |
| _CPM_Rate |  |
| CZT Counter | 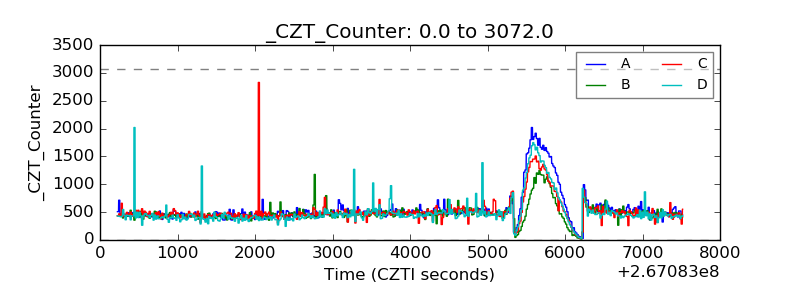 |
| +2.5 Volts monitor |  |
| +5 Volts monitor |  |
| _ROLL_ROT | 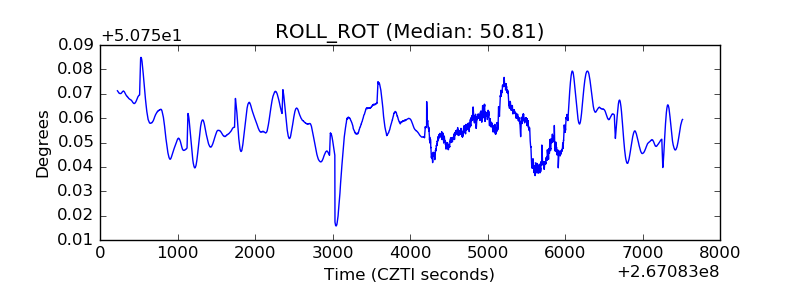 |
| _Roll_DEC | 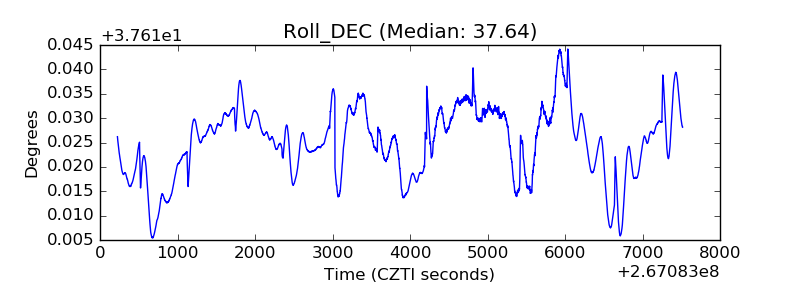 |
| _Roll_RA |  |
| Veto Counter | 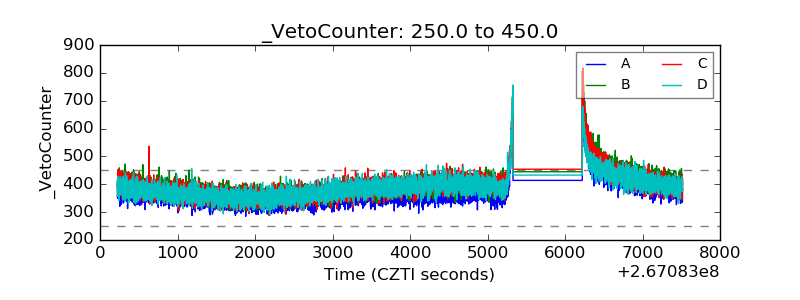 |