| Param | Original file | Final file |
|---|---|---|
| Filename | modeM0/AS1G08_081T01_9000002178_14730cztM0_level2.evt | modeM0/AS1G08_081T01_9000002178_14730cztM0_level2_quad_clean.evt |
| Size (bytes) | 458,876,160 | 78,837,120 |
| Size | 437.6 MB | 75.2 MB |
| Events in quadrant A | 3,504,521 | 487,576 |
| Events in quadrant B | 3,330,120 | 486,592 |
| Events in quadrant C | 3,289,804 | 474,239 |
| Events in quadrant D | 3,319,161 | 473,539 |
| Mode M0 | |||
|---|---|---|---|
| Quadrant | BADHDUFLAG | Total packets | Discarded packets |
| A | 0 | 14363 | 3 |
| B | 0 | 13899 | 2 |
| C | 0 | 13775 | 2 |
| D | 0 | 14248 | 2 |
| Mode SS | |||
|---|---|---|---|
| Quadrant | BADHDUFLAG | Total packets | Discarded packets |
| A | 0 | 134 | 0 |
| B | 0 | 134 | 0 |
| C | 0 | 134 | 0 |
| D | 0 | 134 | 0 |
| Mode M9 | |||
|---|---|---|---|
| Quadrant | BADHDUFLAG | Total packets | Discarded packets |
| A | 0 | 16 | 0 |
| B | 0 | 16 | 0 |
| C | 0 | 16 | 0 |
| D | 0 | 17 | 0 |
| Quadrant | Total seconds | Saturated seconds | Saturation percentage |
|---|---|---|---|
| A | 6681 | 73 | 1.092651% |
| B | 6681 | 74 | 1.107619% |
| C | 6681 | 39 | 0.583745% |
| D | 6681 | 50 | 0.748391% |
Noise dominated data is calculated using 1-second bins in cleaned event files. If a bin has >2000 counts, and if more than 50% of those come from <1% of pixels, then it is considered to be noise-dominated and hence unusable.
| Quadrant | # 1 sec bins | Bins with >0 counts | Bins with >2000 counts | High rate bins dominated by noise | Noise dominated (total time) | Noise dominated (detector-on time) | Marked lightcurve |
|---|---|---|---|---|---|---|---|
| A | 7722 | 6682 | 2 | 2 | 0.03% | 0.03% | 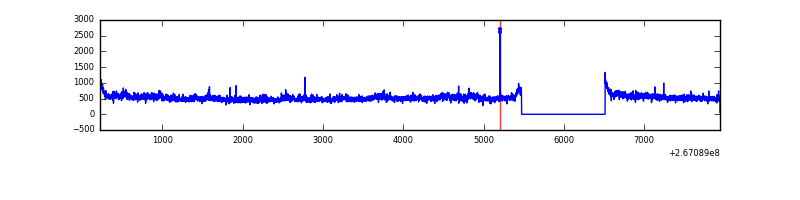 |
| B | 7722 | 6682 | 3 | 3 | 0.04% | 0.04% | 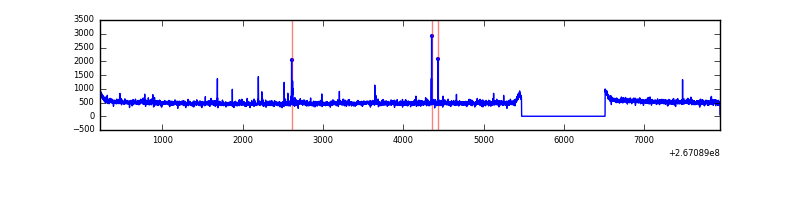 |
| C | 7722 | 6682 | 0 | 0 | 0.00% | 0.00% | 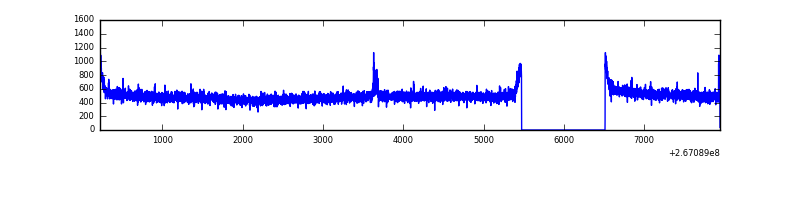 |
| D | 7722 | 6682 | 1 | 1 | 0.01% | 0.01% | 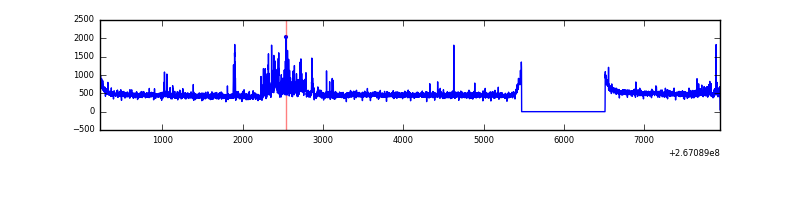 |
Top three noisy pixels from each quadrant. If the there are fewer than three noisy pixels in the level2.evt file, extra rows are filled as -1
| Pixel properties | Quadrant properties | ||||||
|---|---|---|---|---|---|---|---|
| Quadrant | DetID | PixID | Counts | Sigma | Mean | Median | Sigma |
| A | 8 | 15 | 245626 | 1446.49 | 833 | 813 | 169.2 |
| A | 12 | 189 | 40437 | 234.12 | 833 | 813 | 169.2 |
| A | 9 | 143 | 13156 | 72.93 | 833 | 813 | 169.2 |
| B | 0 | 214 | 25024 | 153.44 | 824 | 805 | 157.8 |
| B | 0 | 205 | 22623 | 138.23 | 824 | 805 | 157.8 |
| B | 12 | 111 | 18695 | 113.34 | 824 | 805 | 157.8 |
| C | 3 | 233 | 168889 | 912.93 | 795 | 801 | 184.1 |
| C | 6 | 96 | 15429 | 79.45 | 795 | 801 | 184.1 |
| C | 4 | 254 | 6646 | 31.75 | 795 | 801 | 184.1 |
| D | 12 | 16 | 224481 | 1174.18 | 802 | 784 | 190.5 |
| D | 2 | 152 | 23489 | 119.18 | 802 | 784 | 190.5 |
| D | 2 | 234 | 22848 | 115.81 | 802 | 784 | 190.5 |
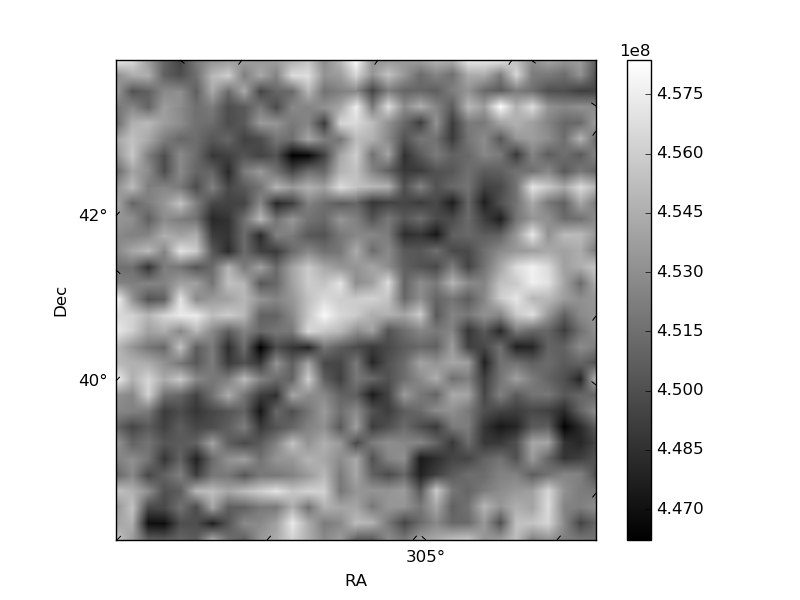
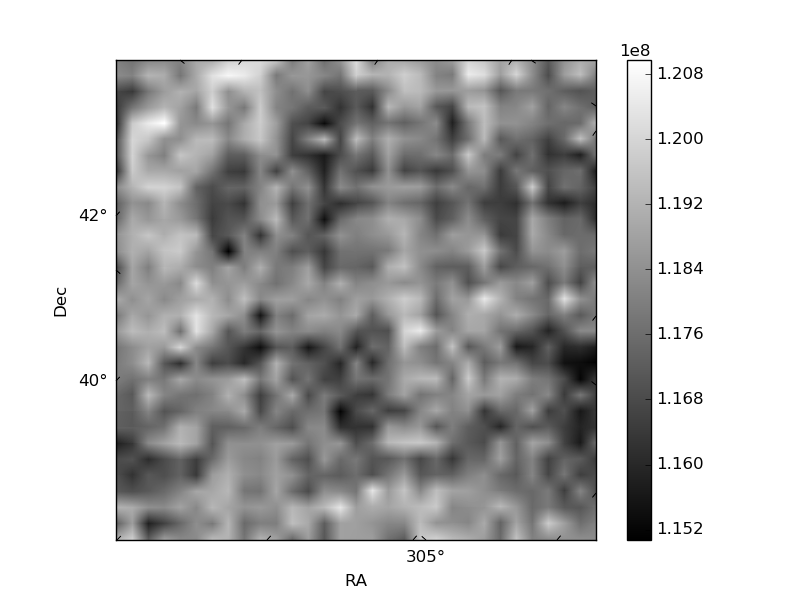
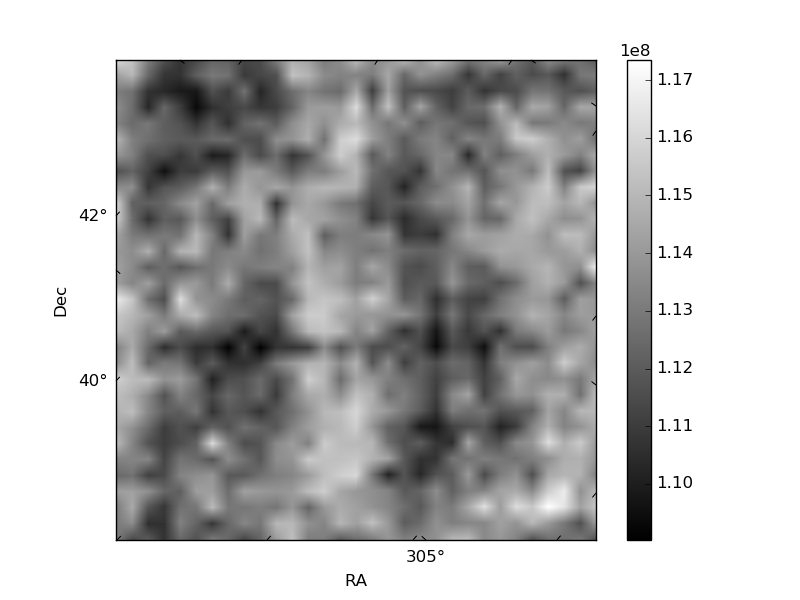
Histogram calculated using DETX and DETY for each event in the final _common_clean file
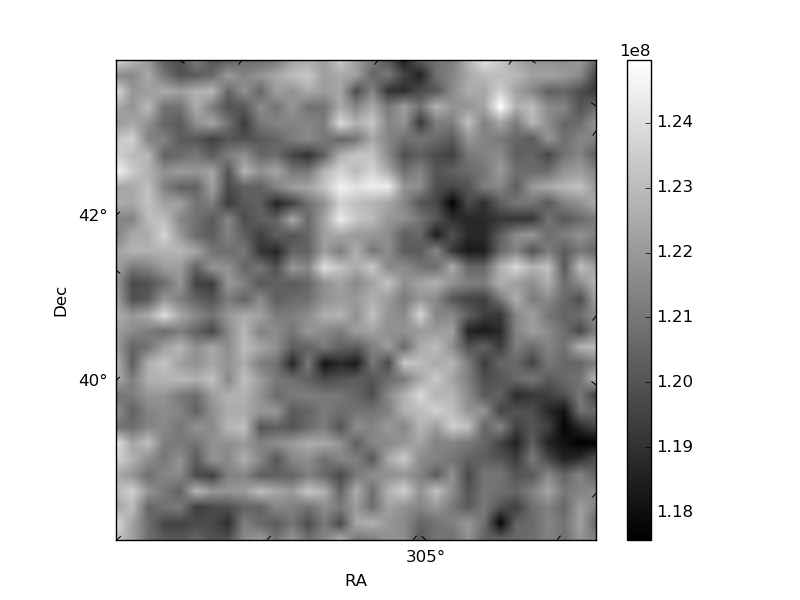
| Quadrant A | 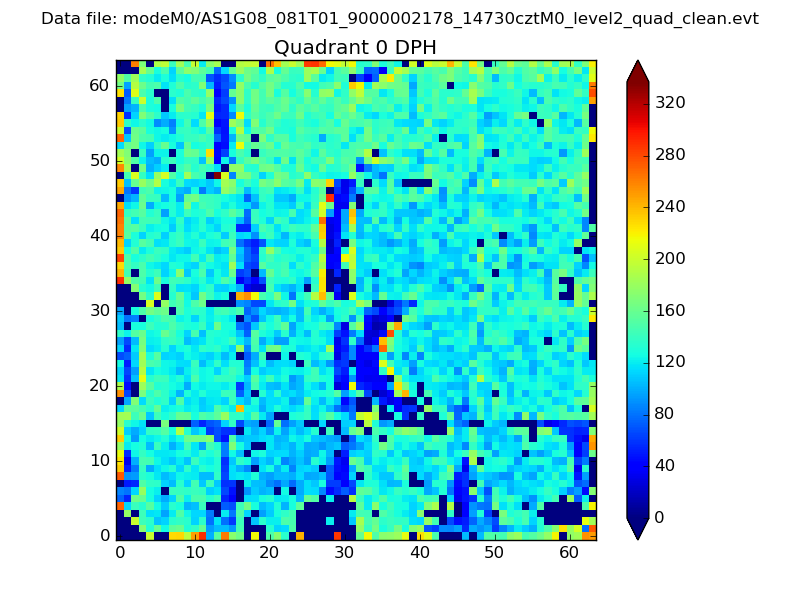 |
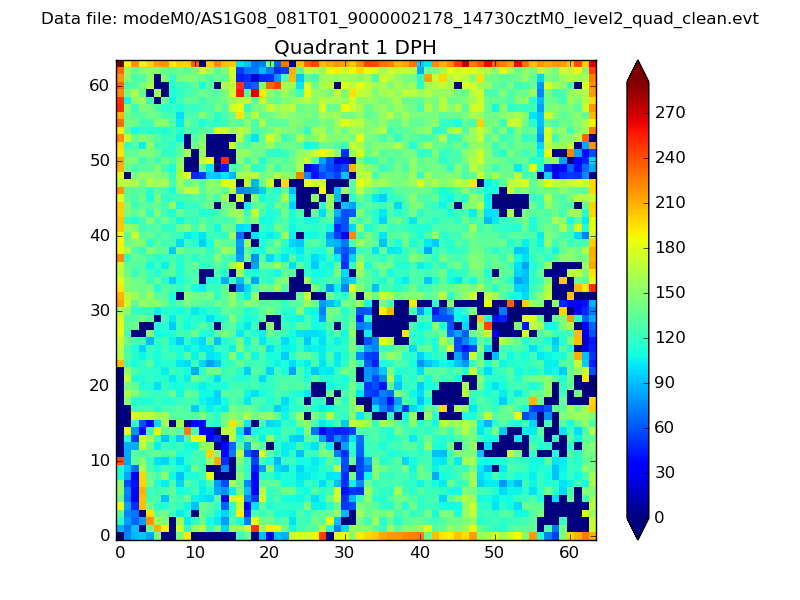 |
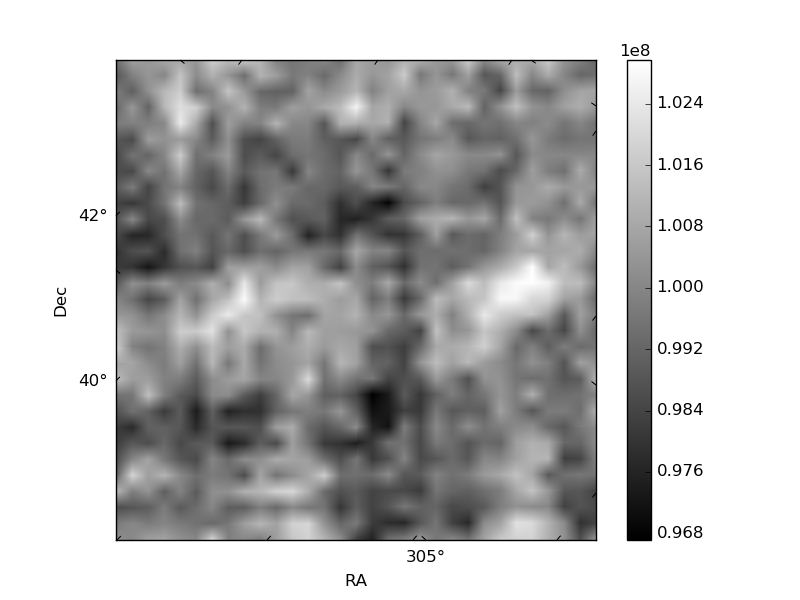
Quadrant B |
|---|---|---|---|
| Quadrant D | 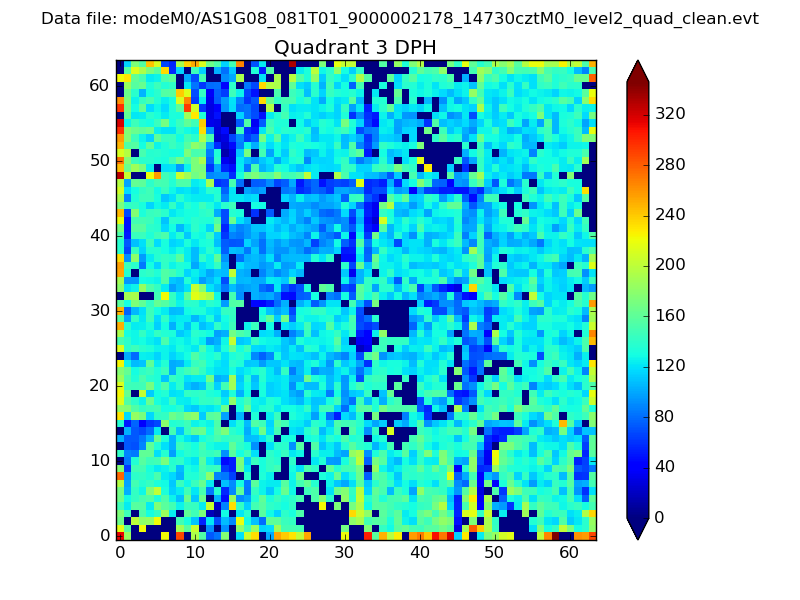 |
 |
Quadrant C |
| Plot type | Count rate plots | Images |
|---|---|---|
| Comparison with Poisson distribution Blue bars denote a histogram of data divided into 1 sec bins. Red curve is a Poisson curve with rate = median count rate of data. |
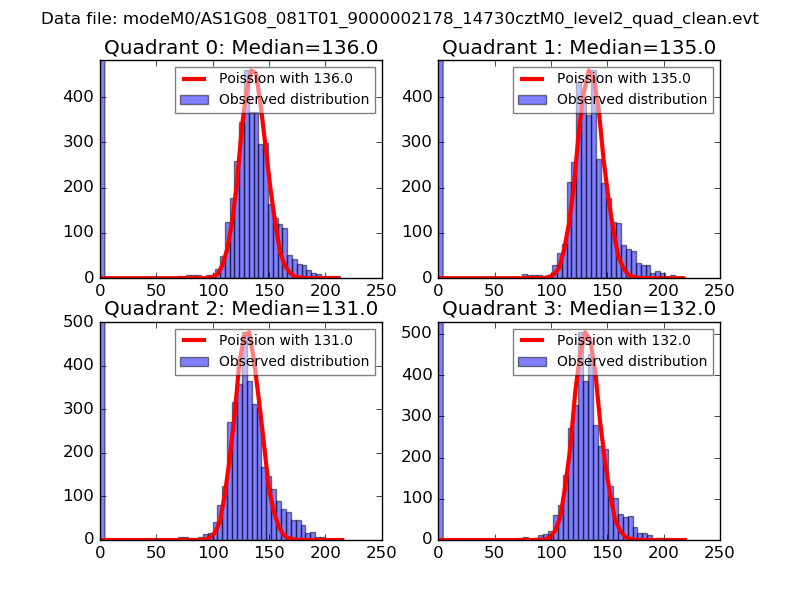 |
 |
| Quadrant-wise count rates Data is divided into 100 sec bins |
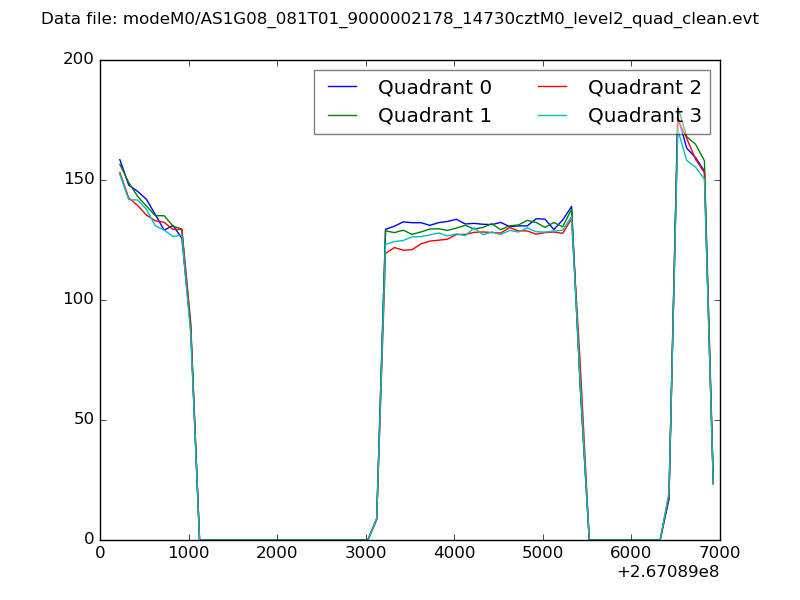 |
|
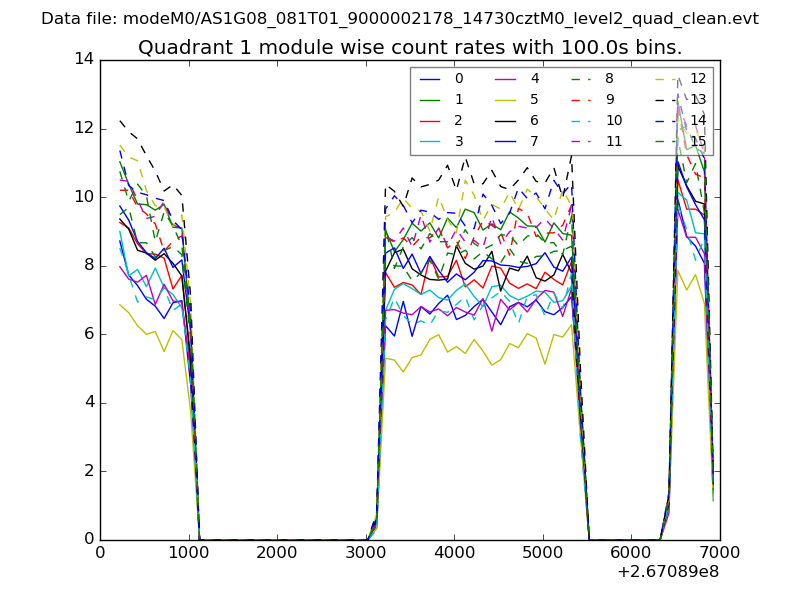
| Module-wise count rates for Quadrant A Data is divided into 100 sec bins |
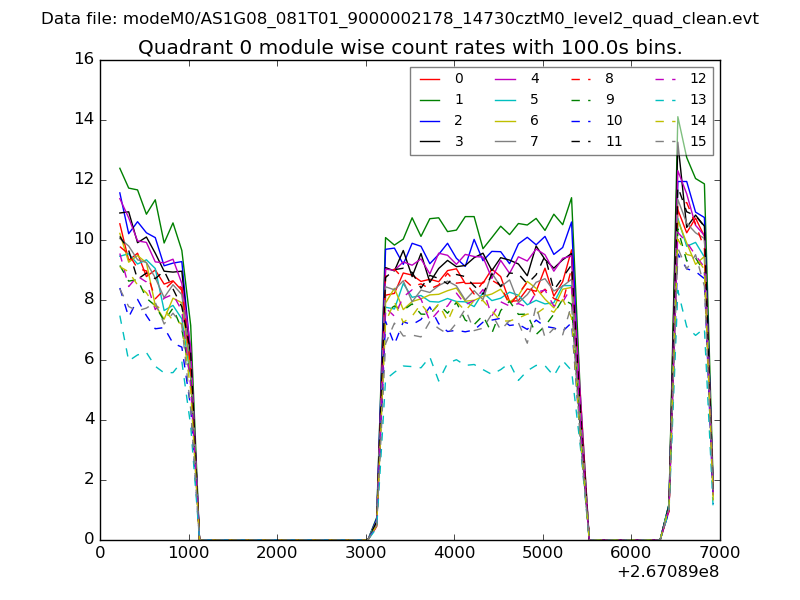 |
 |
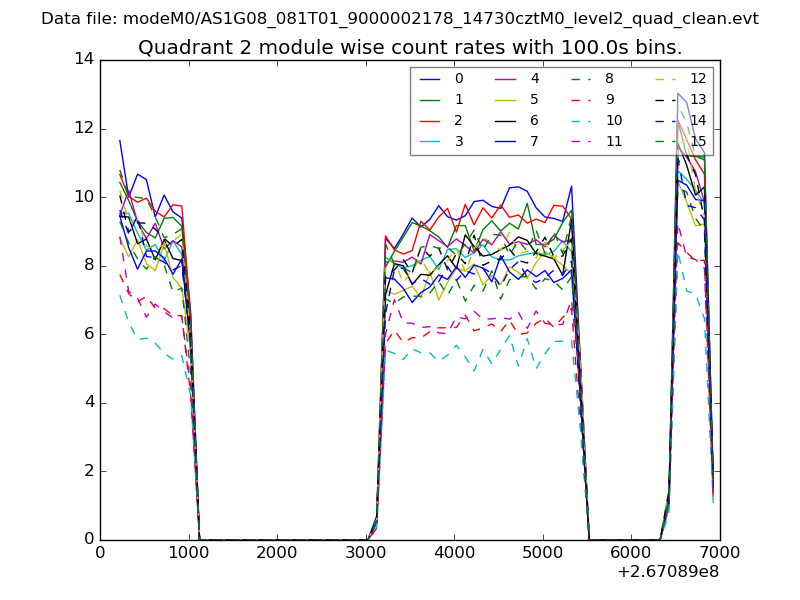
| Module-wise count rates for Quadrant B Data is divided into 100 sec bins |
 |
 |
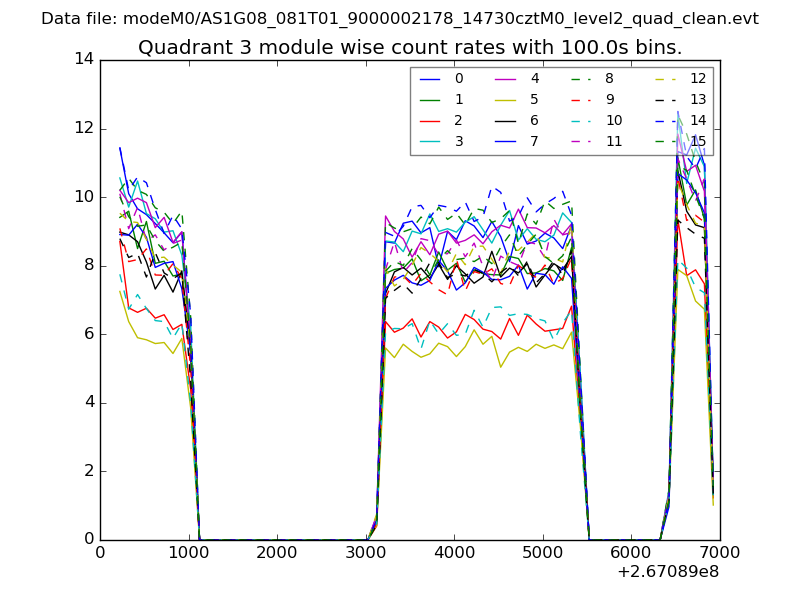
| Module-wise count rates for Quadrant C Data is divided into 100 sec bins |
 |
 |
| Module-wise count rates for Quadrant D Data is divided into 100 sec bins |
 |
 |
| Parameter | Plot |
|---|---|
| CZT HV Monitor | 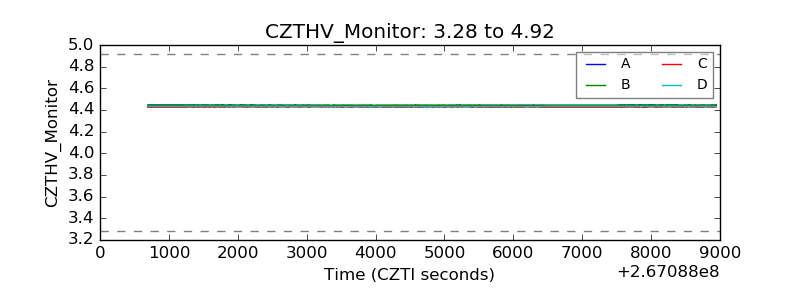 |
| D_VDD | 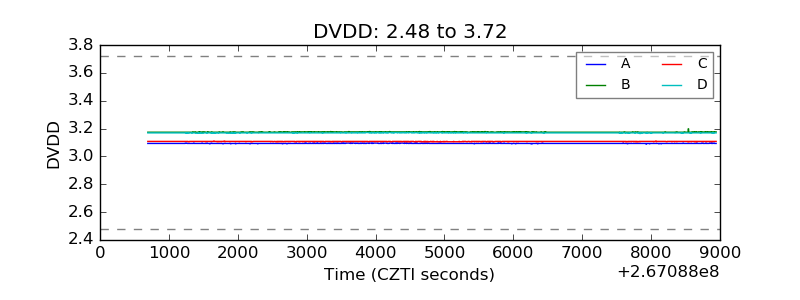 |
| Temperature 1 | 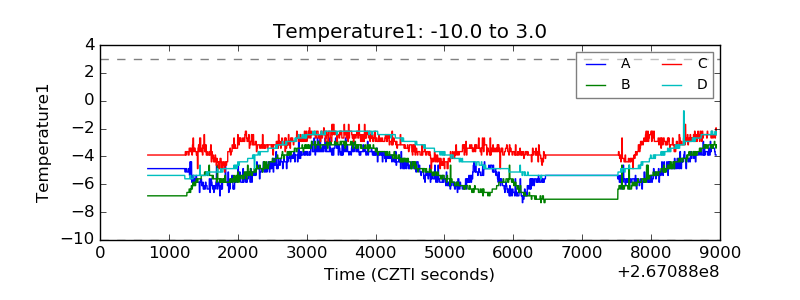 |
| Veto HV Monitor | 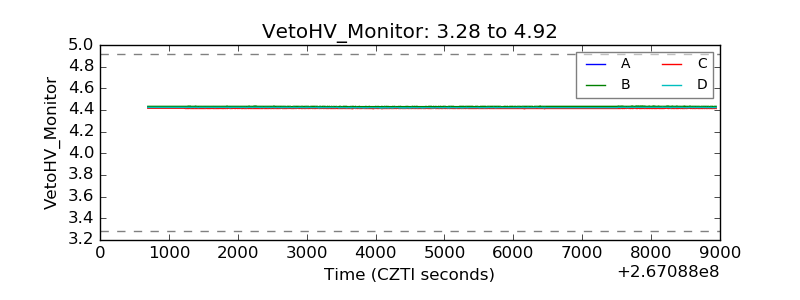 |
| Veto LLD | 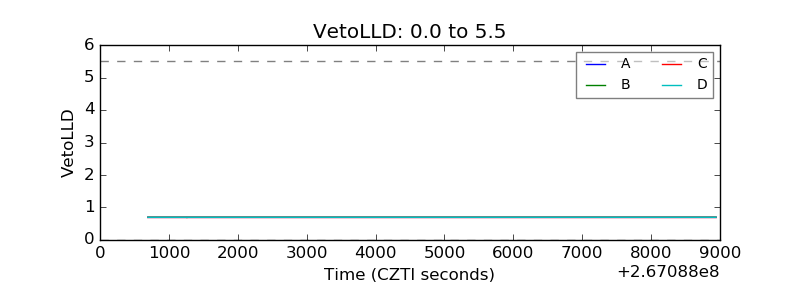 |
| Alpha Counter | 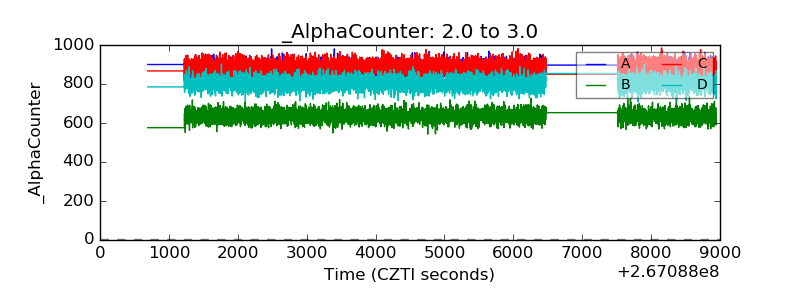 |
| _CPM_Rate | 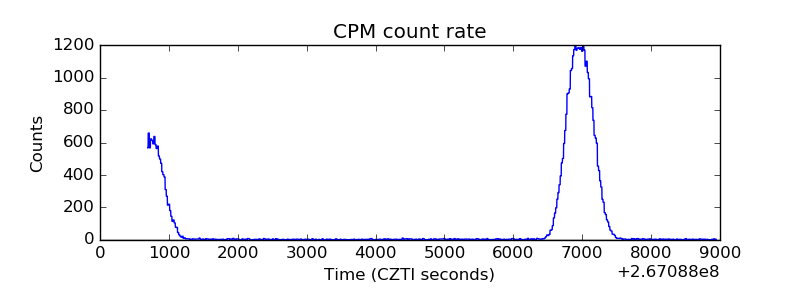 |
| CZT Counter | 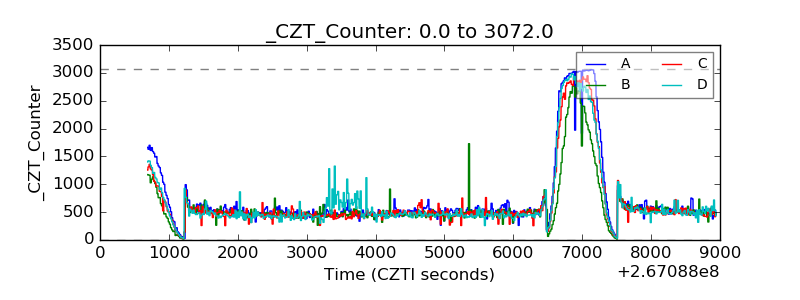 |
| +2.5 Volts monitor |  |
| +5 Volts monitor | 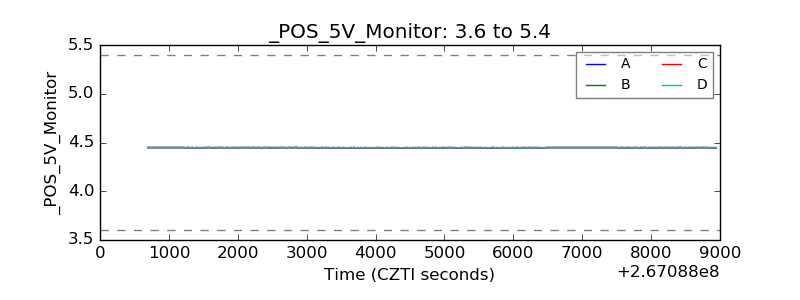 |
| _ROLL_ROT | 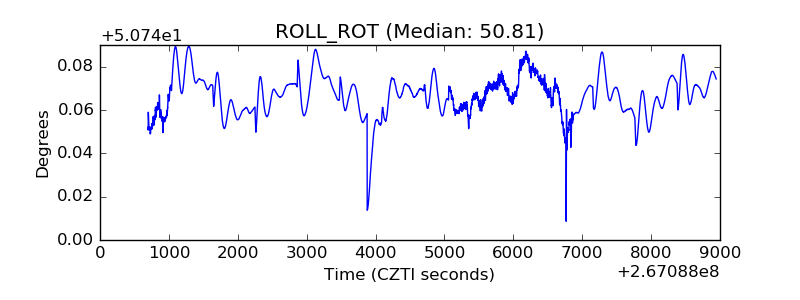 |
| _Roll_DEC | 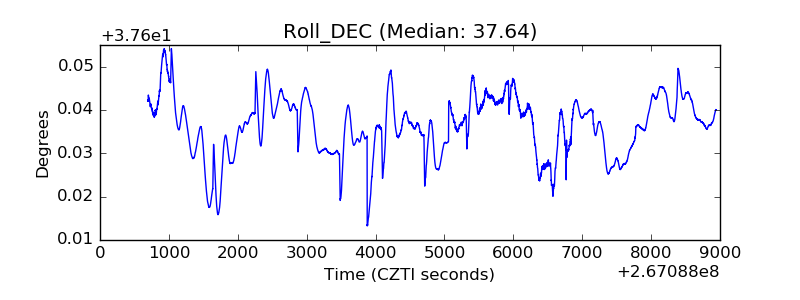 |
| _Roll_RA |  |
| Veto Counter | 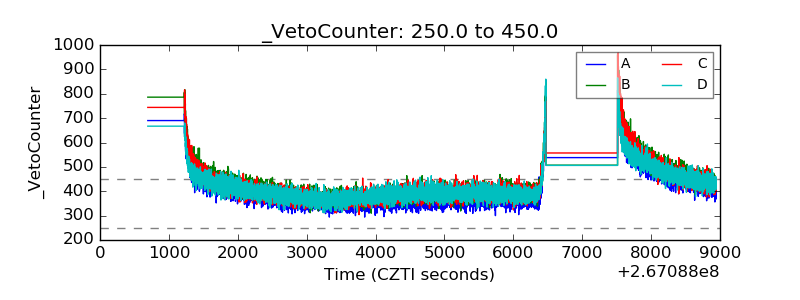 |