| Param | Original file | Final file |
|---|---|---|
| Filename | modeM0/AS1G08_081T01_9000002178_14731cztM0_level2.evt | modeM0/AS1G08_081T01_9000002178_14731cztM0_level2_quad_clean.evt |
| Size (bytes) | 470,208,960 | 69,439,680 |
| Size | 448.4 MB | 66.2 MB |
| Events in quadrant A | 3,584,501 | 419,171 |
| Events in quadrant B | 3,537,303 | 415,473 |
| Events in quadrant C | 3,405,762 | 402,411 |
| Events in quadrant D | 3,265,420 | 406,151 |
| Mode M0 | |||
|---|---|---|---|
| Quadrant | BADHDUFLAG | Total packets | Discarded packets |
| A | 0 | 14677 | 3 |
| B | 0 | 14548 | 2 |
| C | 0 | 13932 | 2 |
| D | 0 | 13786 | 2 |
| Mode SS | |||
|---|---|---|---|
| Quadrant | BADHDUFLAG | Total packets | Discarded packets |
| A | 0 | 134 | 0 |
| B | 0 | 134 | 0 |
| C | 0 | 134 | 0 |
| D | 0 | 134 | 0 |
| Mode M9 | |||
|---|---|---|---|
| Quadrant | BADHDUFLAG | Total packets | Discarded packets |
| A | 0 | 13 | 0 |
| B | 0 | 13 | 0 |
| C | 0 | 13 | 0 |
| D | 0 | 14 | 0 |
| Quadrant | Total seconds | Saturated seconds | Saturation percentage |
|---|---|---|---|
| A | 6586 | 97 | 1.472821% |
| B | 6586 | 93 | 1.412086% |
| C | 6586 | 62 | 0.941391% |
| D | 6586 | 62 | 0.941391% |
Noise dominated data is calculated using 1-second bins in cleaned event files. If a bin has >2000 counts, and if more than 50% of those come from <1% of pixels, then it is considered to be noise-dominated and hence unusable.
| Quadrant | # 1 sec bins | Bins with >0 counts | Bins with >2000 counts | High rate bins dominated by noise | Noise dominated (total time) | Noise dominated (detector-on time) | Marked lightcurve |
|---|---|---|---|---|---|---|---|
| A | 7732 | 6587 | 1 | 1 | 0.01% | 0.02% | 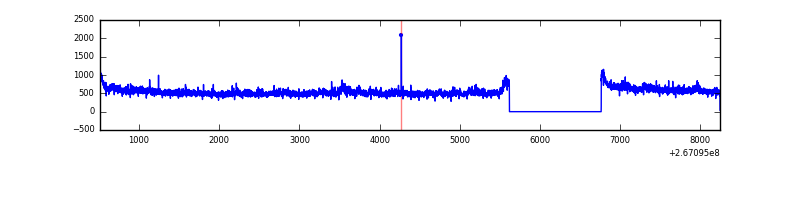 |
| B | 7732 | 6587 | 4 | 4 | 0.05% | 0.06% | 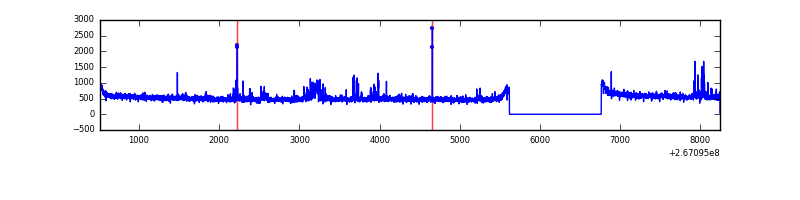 |
| C | 7732 | 6587 | 0 | 0 | 0.00% | 0.00% | 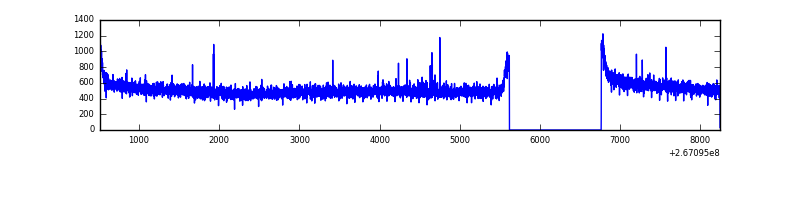 |
| D | 7732 | 6587 | 0 | 0 | 0.00% | 0.00% | 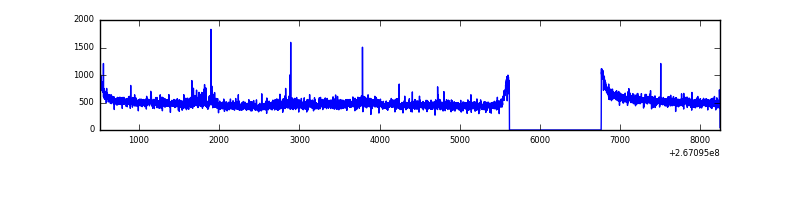 |
Top three noisy pixels from each quadrant. If the there are fewer than three noisy pixels in the level2.evt file, extra rows are filled as -1
| Pixel properties | Quadrant properties | ||||||
|---|---|---|---|---|---|---|---|
| Quadrant | DetID | PixID | Counts | Sigma | Mean | Median | Sigma |
| A | 8 | 15 | 188082 | 1061.07 | 869 | 851 | 176.5 |
| A | 12 | 189 | 47921 | 266.75 | 869 | 851 | 176.5 |
| A | 0 | 226 | 7689 | 38.75 | 869 | 851 | 176.5 |
| B | 0 | 205 | 56912 | 345.22 | 855 | 834 | 162.4 |
| B | 0 | 230 | 51422 | 311.42 | 855 | 834 | 162.4 |
| B | 10 | 249 | 29883 | 178.82 | 855 | 834 | 162.4 |
| C | 3 | 233 | 173190 | 911.71 | 825 | 831 | 189.1 |
| C | 4 | 254 | 9259 | 44.58 | 825 | 831 | 189.1 |
| C | 13 | 61 | 5746 | 26.0 | 825 | 831 | 189.1 |
| D | 12 | 16 | 54340 | 270.75 | 837 | 818 | 197.7 |
| D | 2 | 234 | 21799 | 106.13 | 837 | 818 | 197.7 |
| D | 2 | 152 | 19027 | 92.11 | 837 | 818 | 197.7 |
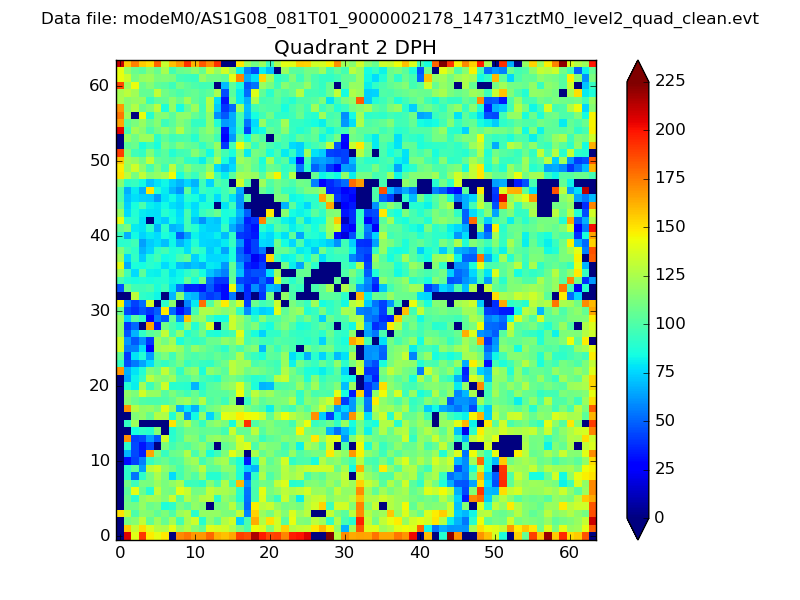
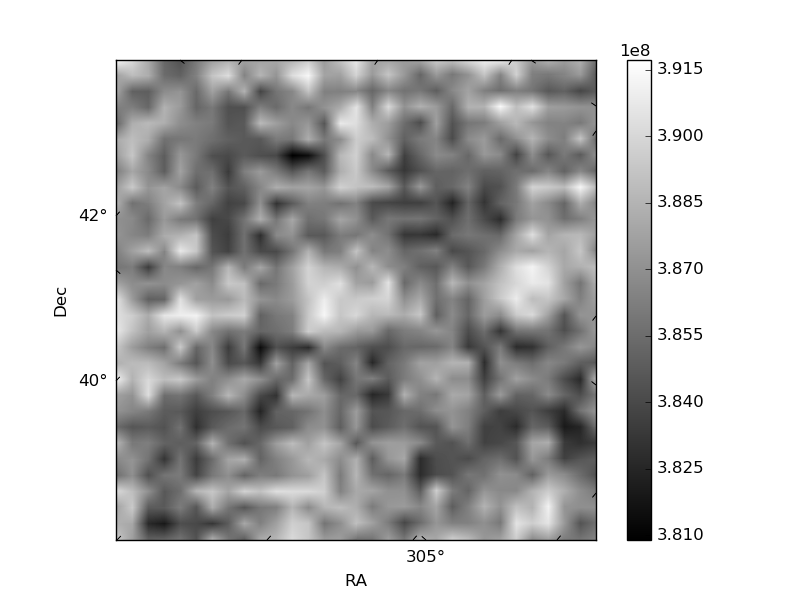
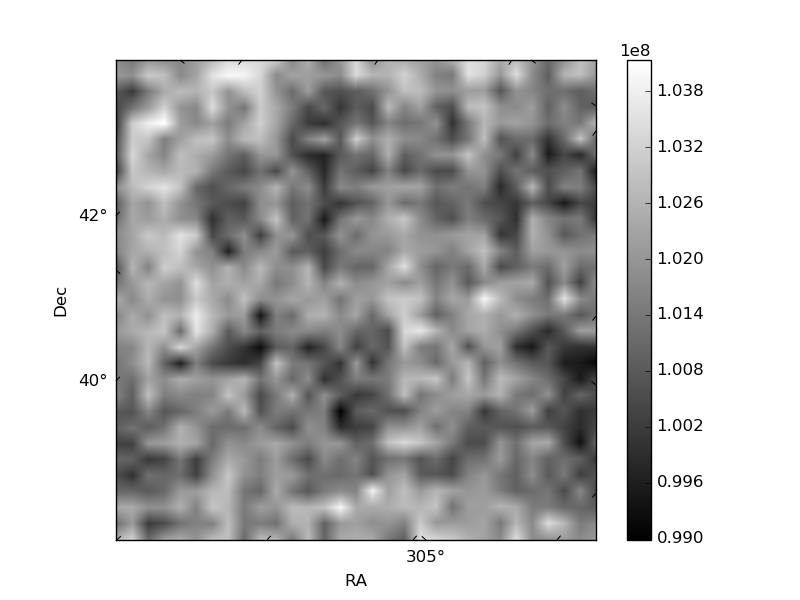
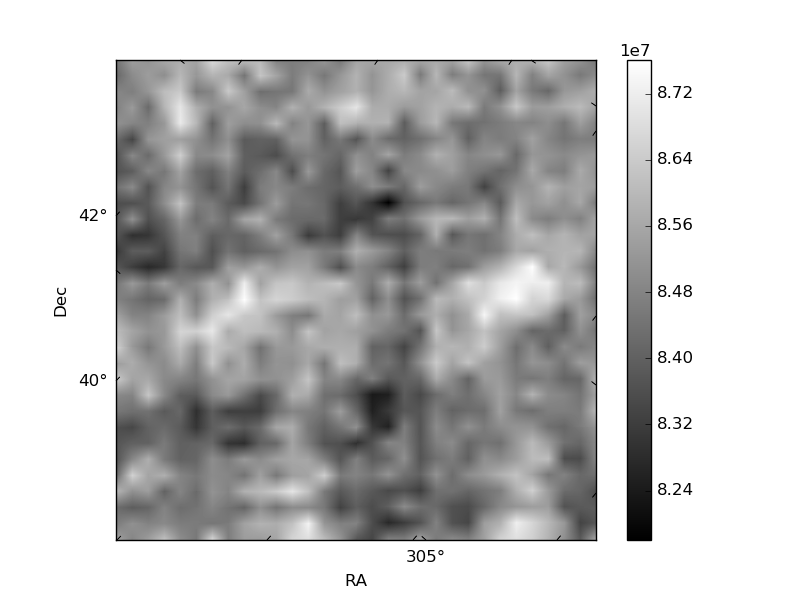
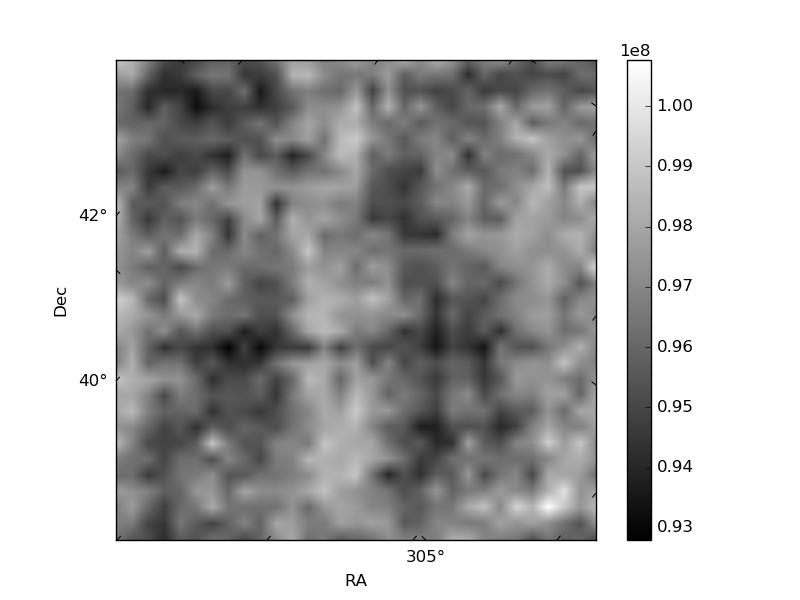
Histogram calculated using DETX and DETY for each event in the final _common_clean file
| Quadrant A | 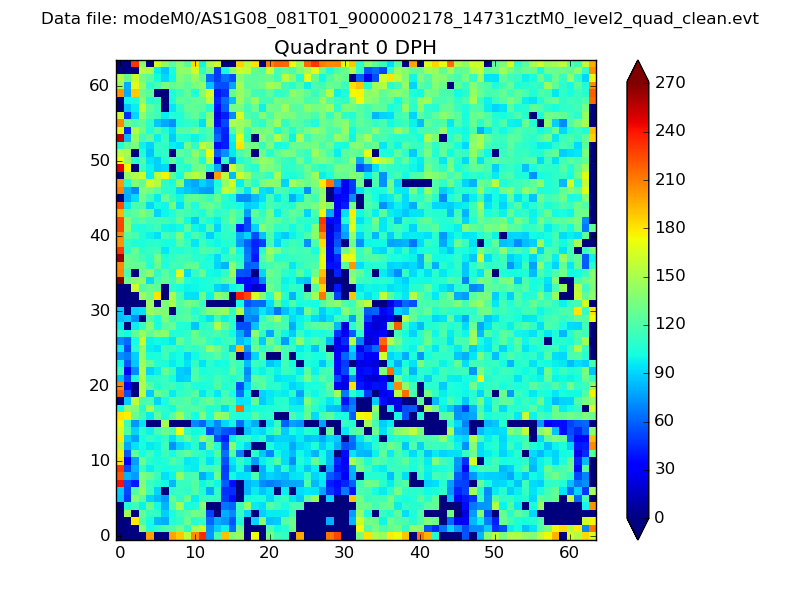 |
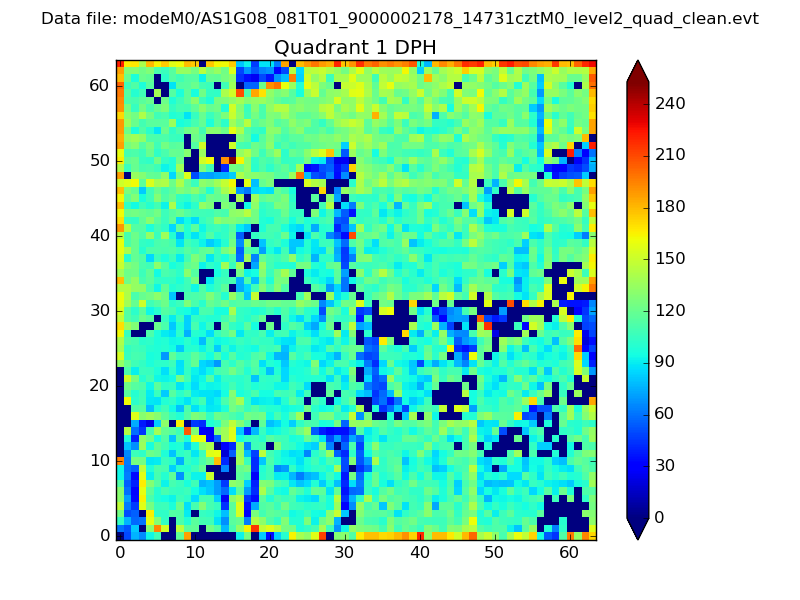 |
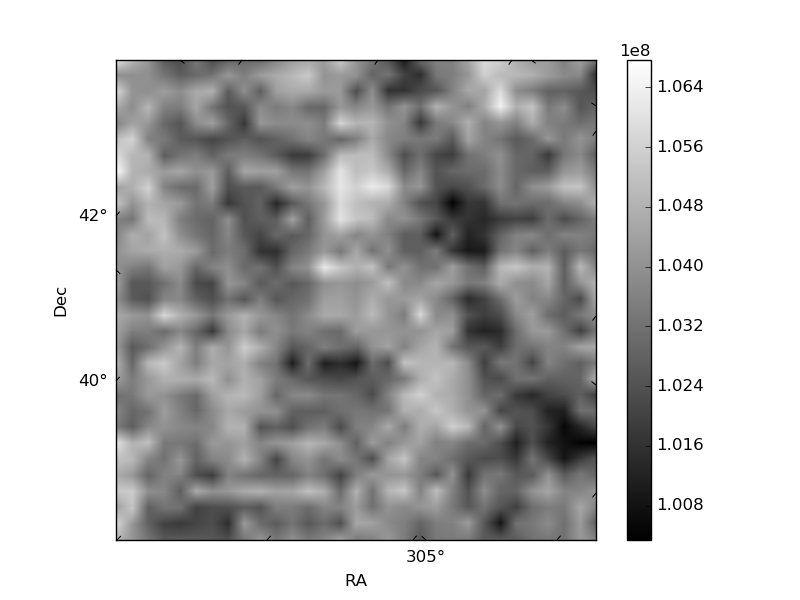
Quadrant B |
|---|---|---|---|
| Quadrant D | 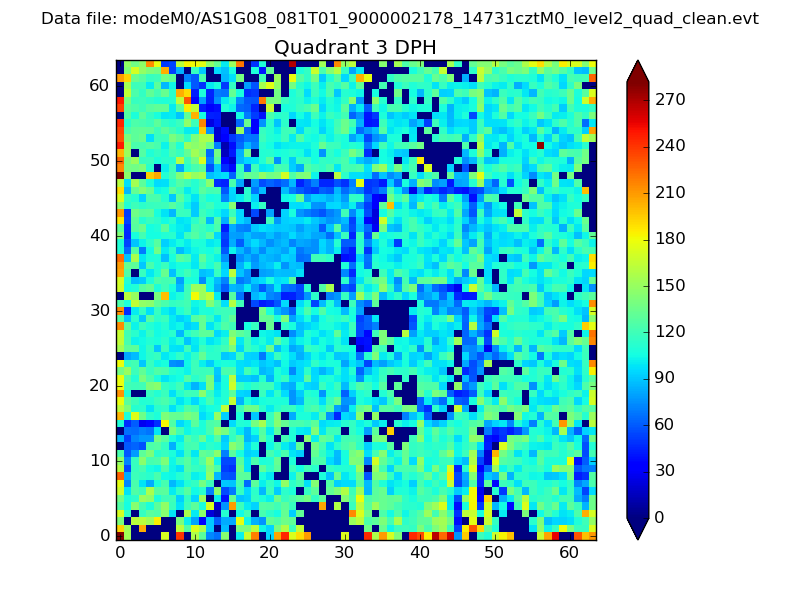 |
 |
Quadrant C |
| Plot type | Count rate plots | Images |
|---|---|---|
| Comparison with Poisson distribution Blue bars denote a histogram of data divided into 1 sec bins. Red curve is a Poisson curve with rate = median count rate of data. |
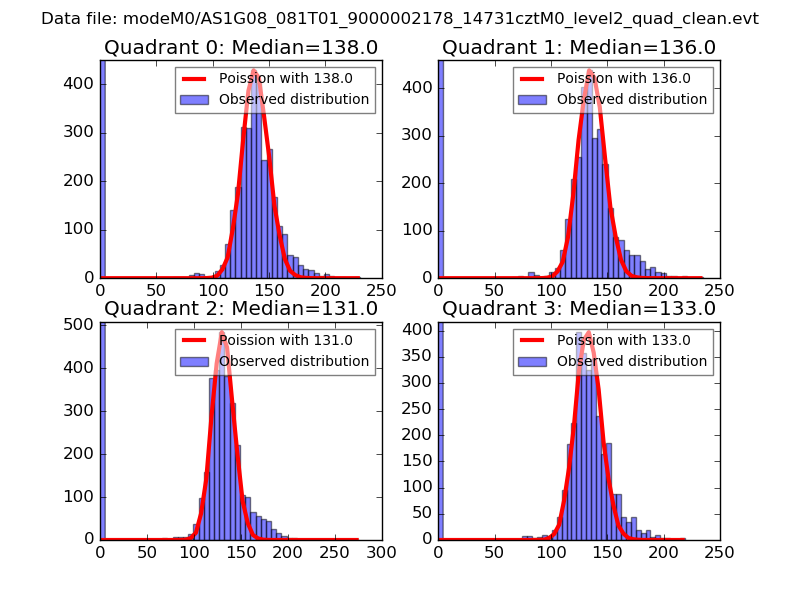 |
 |
| Quadrant-wise count rates Data is divided into 100 sec bins |
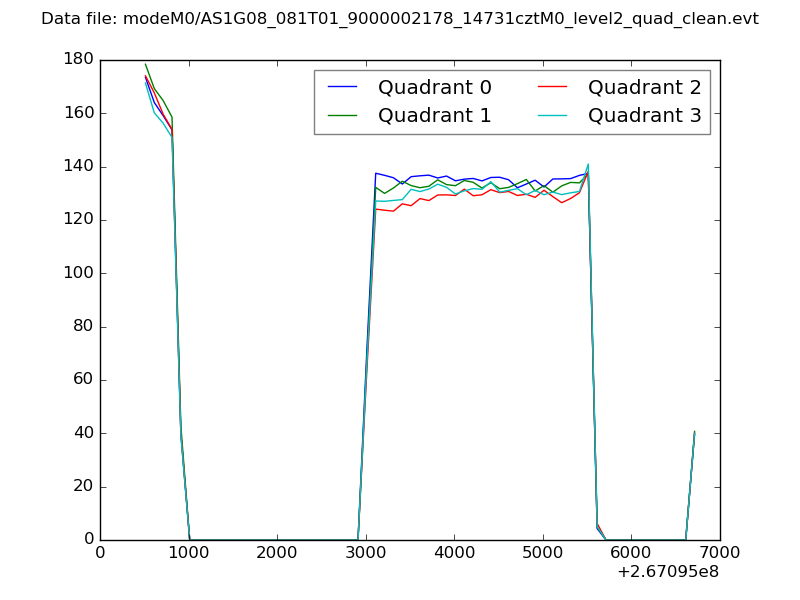 |
|
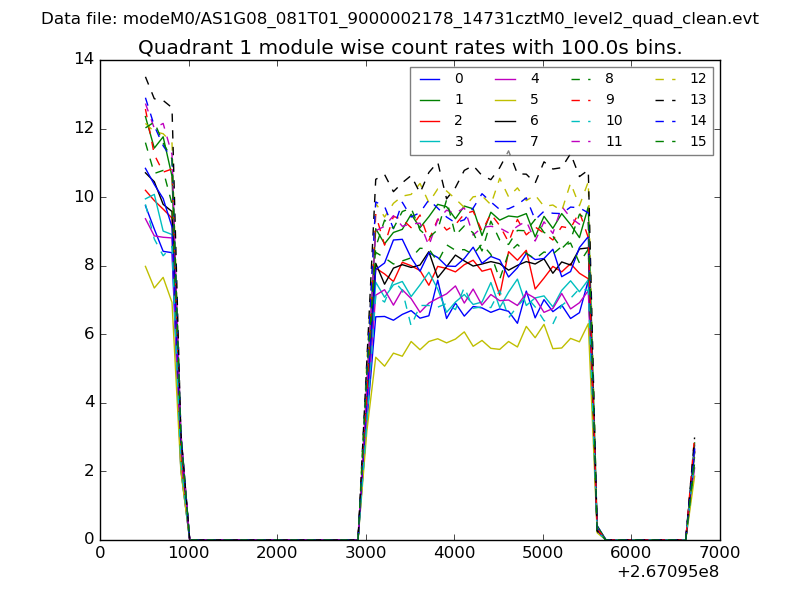
| Module-wise count rates for Quadrant A Data is divided into 100 sec bins |
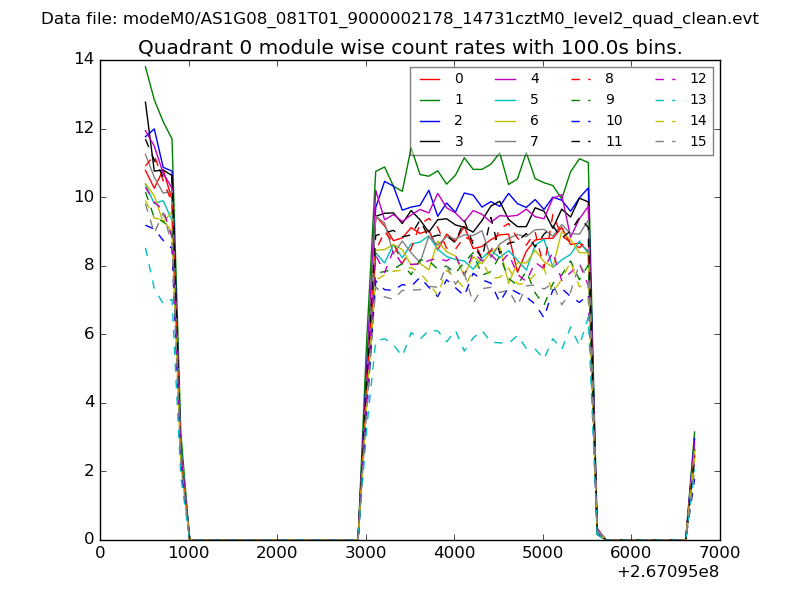 |
 |
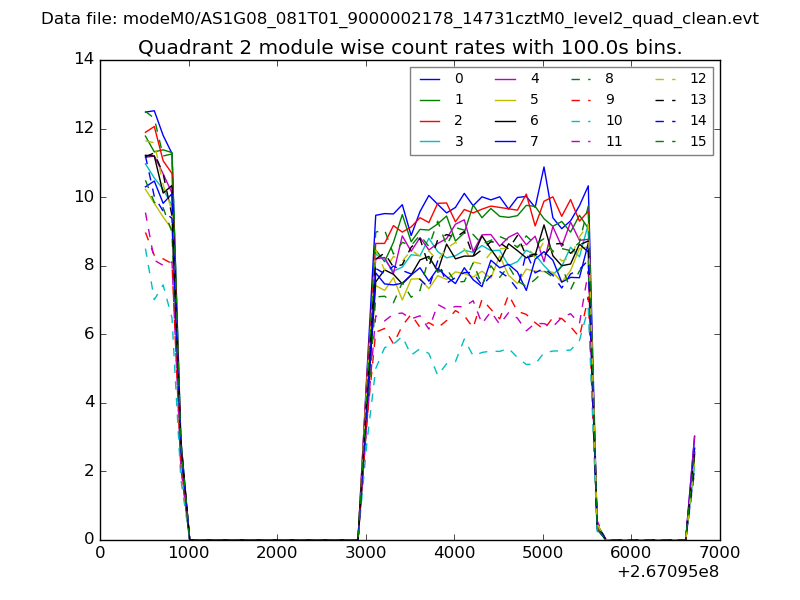
| Module-wise count rates for Quadrant B Data is divided into 100 sec bins |
 |
 |
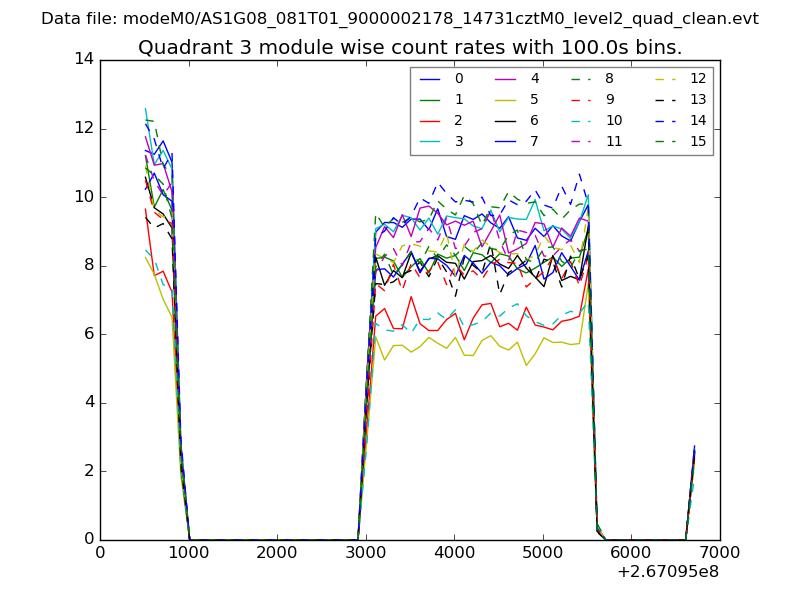
| Module-wise count rates for Quadrant C Data is divided into 100 sec bins |
 |
 |
| Module-wise count rates for Quadrant D Data is divided into 100 sec bins |
 |
 |
| Parameter | Plot |
|---|---|
| CZT HV Monitor | 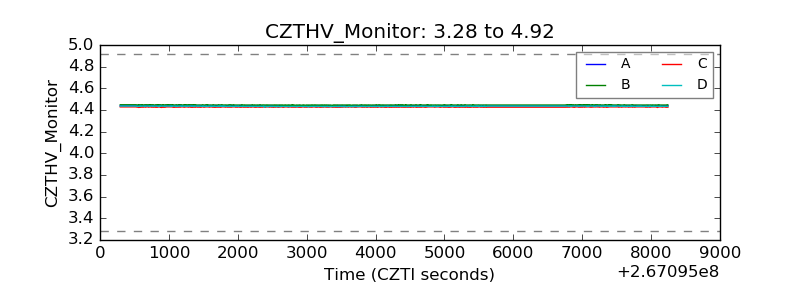 |
| D_VDD | 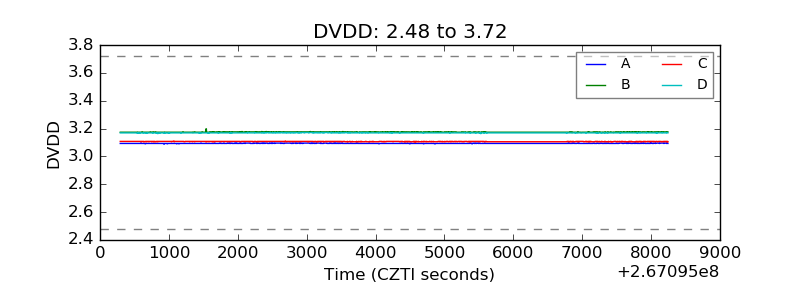 |
| Temperature 1 | 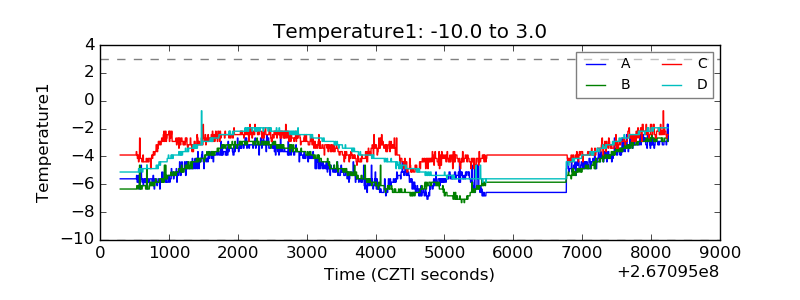 |
| Veto HV Monitor | 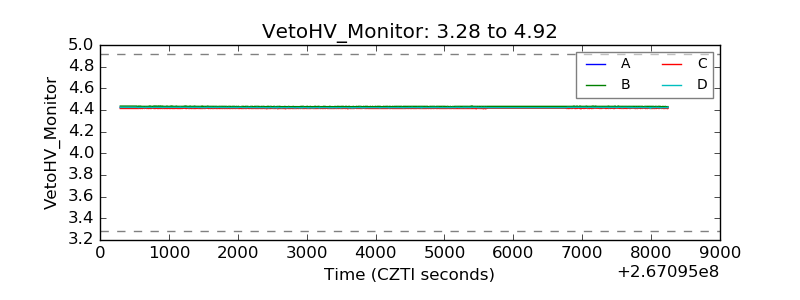 |
| Veto LLD | 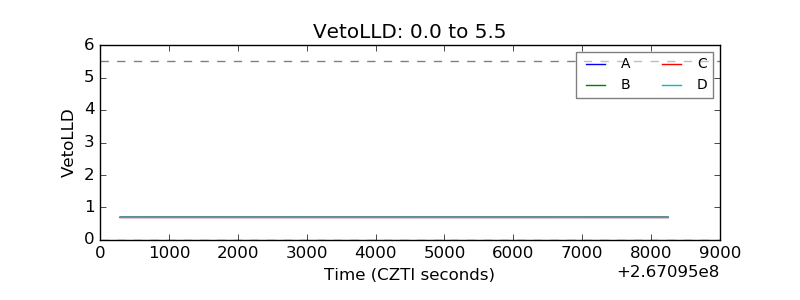 |
| Alpha Counter | 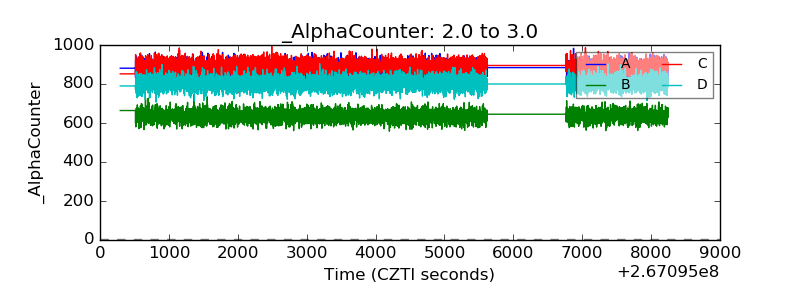 |
| _CPM_Rate | 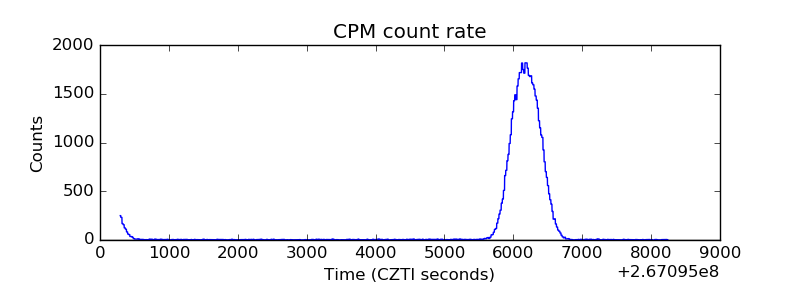 |
| CZT Counter | 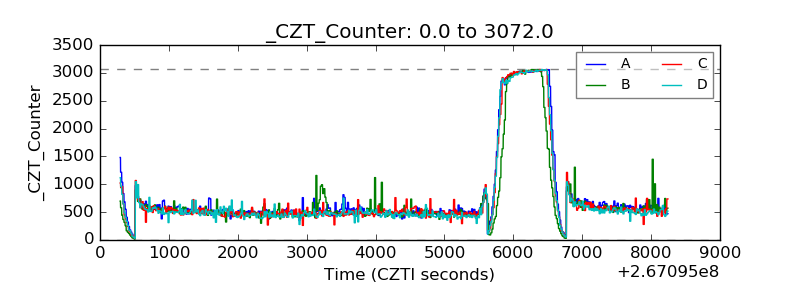 |
| +2.5 Volts monitor |  |
| +5 Volts monitor |  |
| _ROLL_ROT | 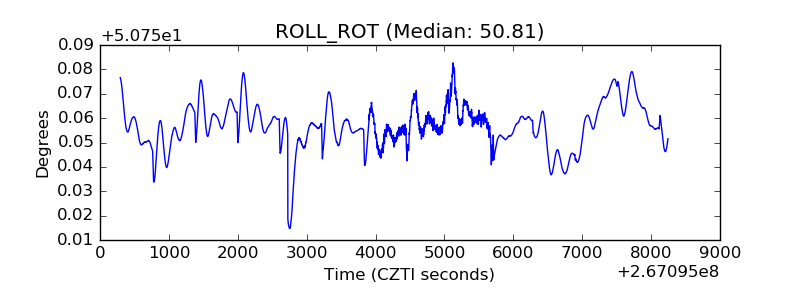 |
| _Roll_DEC | 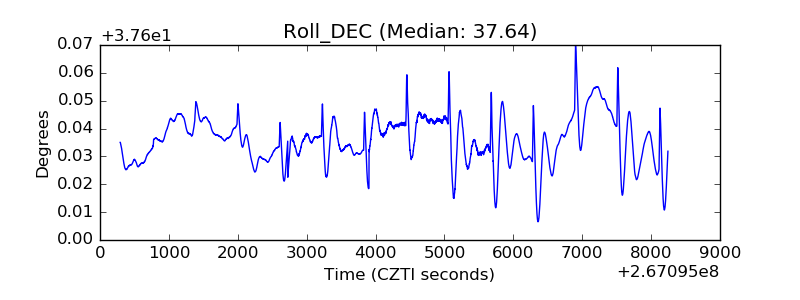 |
| _Roll_RA | 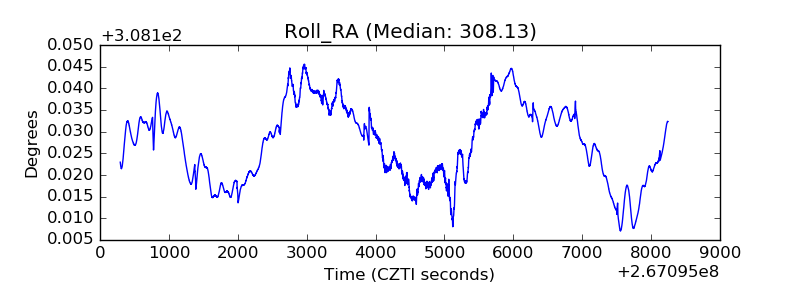 |
| Veto Counter | 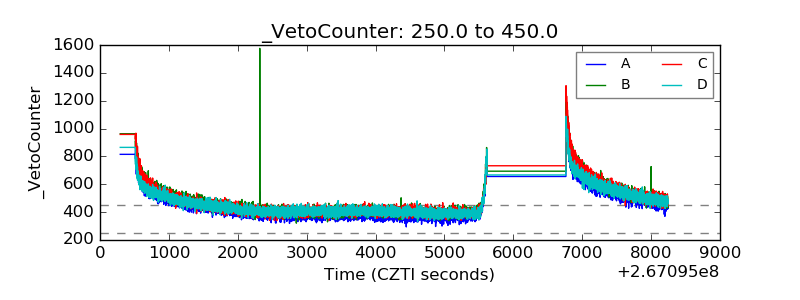 |