| Param | Original file | Final file |
|---|---|---|
| Filename | modeM0/AS1G08_081T01_9000002178_14733cztM0_level2.evt | modeM0/AS1G08_081T01_9000002178_14733cztM0_level2_quad_clean.evt |
| Size (bytes) | 505,428,480 | 67,527,360 |
| Size | 482.0 MB | 64.4 MB |
| Events in quadrant A | 4,254,781 | 407,911 |
| Events in quadrant B | 3,746,970 | 402,738 |
| Events in quadrant C | 3,529,931 | 392,620 |
| Events in quadrant D | 3,343,175 | 396,870 |
| Mode M0 | |||
|---|---|---|---|
| Quadrant | BADHDUFLAG | Total packets | Discarded packets |
| A | 0 | 16909 | 3 |
| B | 0 | 15247 | 2 |
| C | 0 | 14382 | 2 |
| D | 0 | 13919 | 2 |
| Mode SS | |||
|---|---|---|---|
| Quadrant | BADHDUFLAG | Total packets | Discarded packets |
| A | 0 | 128 | 0 |
| B | 0 | 128 | 0 |
| C | 0 | 128 | 0 |
| D | 0 | 128 | 0 |
| Mode M9 | |||
|---|---|---|---|
| Quadrant | BADHDUFLAG | Total packets | Discarded packets |
| A | 0 | 20 | 0 |
| B | 0 | 20 | 0 |
| C | 0 | 20 | 0 |
| D | 0 | 21 | 0 |
| Quadrant | Total seconds | Saturated seconds | Saturation percentage |
|---|---|---|---|
| A | 6375 | 155 | 2.431373% |
| B | 6375 | 122 | 1.913725% |
| C | 6375 | 90 | 1.411765% |
| D | 6375 | 88 | 1.380392% |
Noise dominated data is calculated using 1-second bins in cleaned event files. If a bin has >2000 counts, and if more than 50% of those come from <1% of pixels, then it is considered to be noise-dominated and hence unusable.
| Quadrant | # 1 sec bins | Bins with >0 counts | Bins with >2000 counts | High rate bins dominated by noise | Noise dominated (total time) | Noise dominated (detector-on time) | Marked lightcurve |
|---|---|---|---|---|---|---|---|
| A | 7626 | 6376 | 22 | 22 | 0.29% | 0.35% | 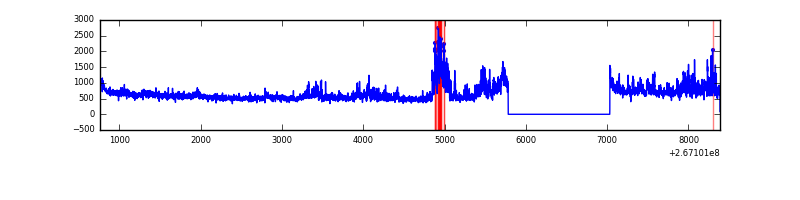 |
| B | 7626 | 6376 | 7 | 7 | 0.09% | 0.11% | 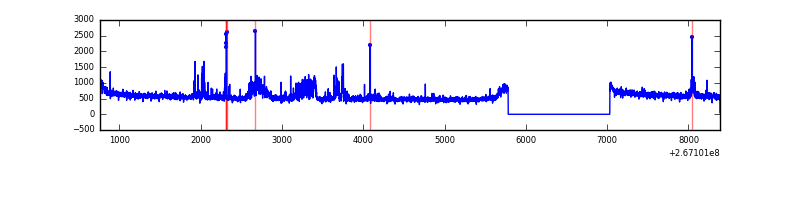 |
| C | 7626 | 6376 | 0 | 0 | 0.00% | 0.00% | 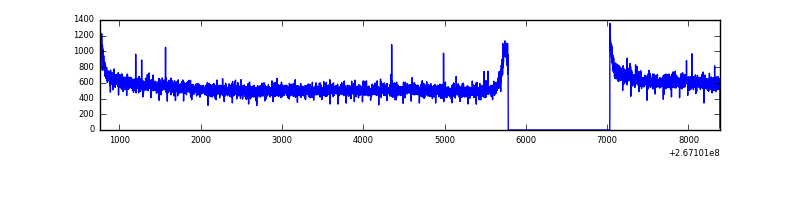 |
| D | 7626 | 6376 | 9 | 9 | 0.12% | 0.14% | 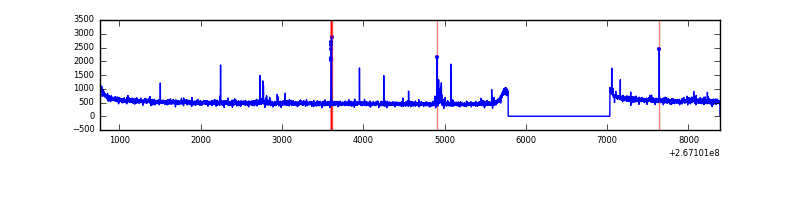 |
Top three noisy pixels from each quadrant. If the there are fewer than three noisy pixels in the level2.evt file, extra rows are filled as -1
| Pixel properties | Quadrant properties | ||||||
|---|---|---|---|---|---|---|---|
| Quadrant | DetID | PixID | Counts | Sigma | Mean | Median | Sigma |
| A | 8 | 15 | 814897 | 4604.95 | 882 | 865 | 176.8 |
| A | 12 | 189 | 42459 | 235.3 | 882 | 865 | 176.8 |
| A | 0 | 226 | 7914 | 39.88 | 882 | 865 | 176.8 |
| B | 0 | 230 | 178699 | 1096.22 | 870 | 852 | 162.2 |
| B | 0 | 205 | 60835 | 369.73 | 870 | 852 | 162.2 |
| B | 10 | 249 | 44336 | 268.03 | 870 | 852 | 162.2 |
| C | 3 | 233 | 229564 | 1190.3 | 844 | 852 | 192.1 |
| C | 13 | 61 | 6073 | 27.17 | 844 | 852 | 192.1 |
| C | 4 | 254 | 4489 | 18.93 | 844 | 852 | 192.1 |
| D | 12 | 16 | 28816 | 133.88 | 852 | 832 | 209.0 |
| D | 2 | 234 | 23737 | 109.58 | 852 | 832 | 209.0 |
| D | 10 | 70 | 20533 | 94.25 | 852 | 832 | 209.0 |
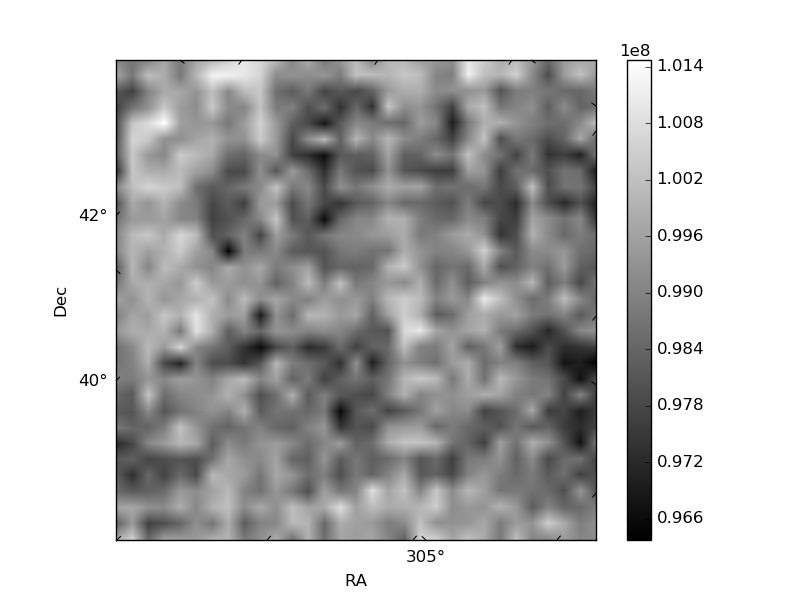
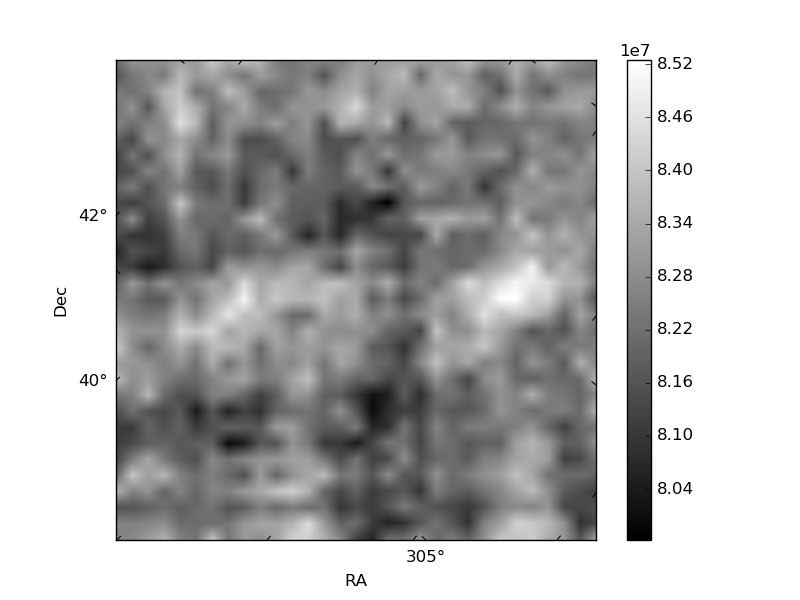
Histogram calculated using DETX and DETY for each event in the final _common_clean file
| Quadrant A | 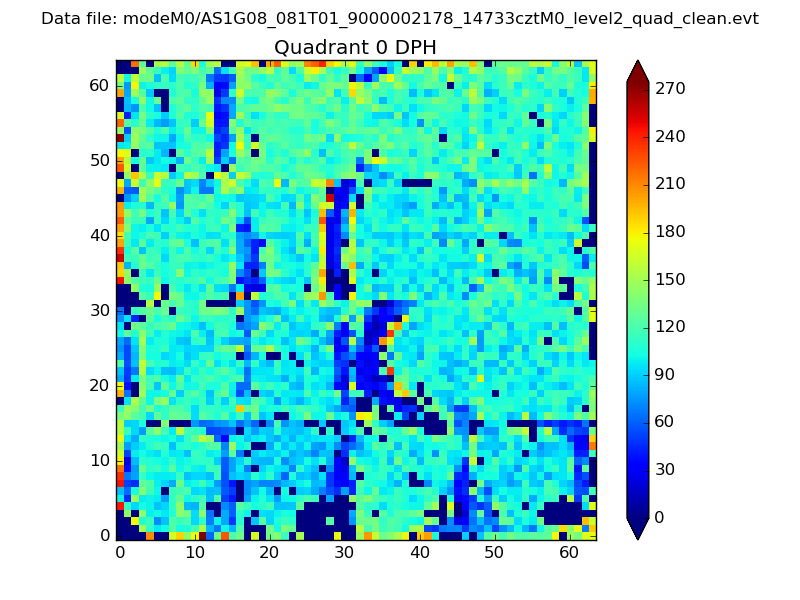 |
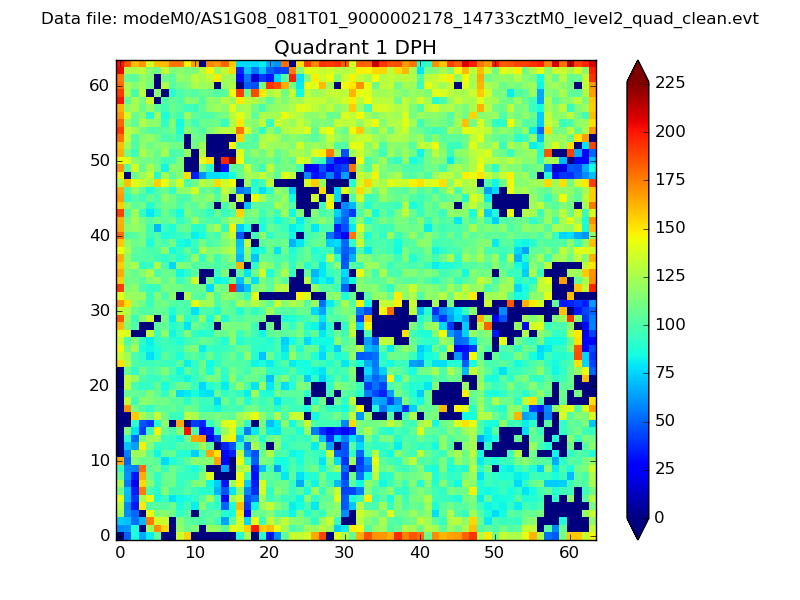 |
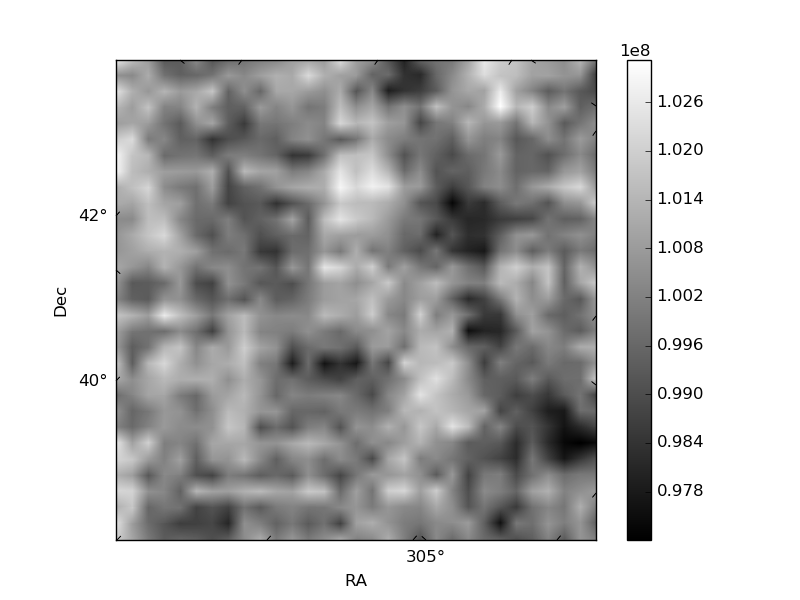
Quadrant B |
|---|---|---|---|
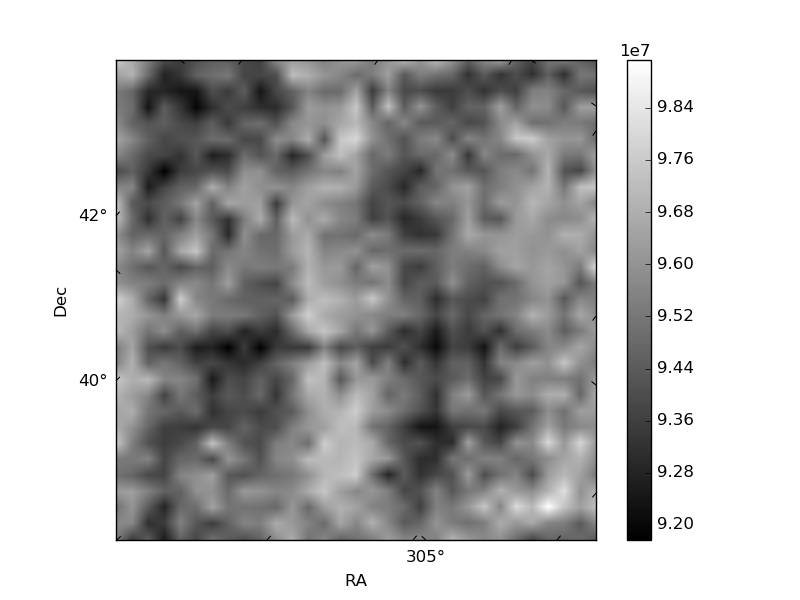
| Quadrant D | 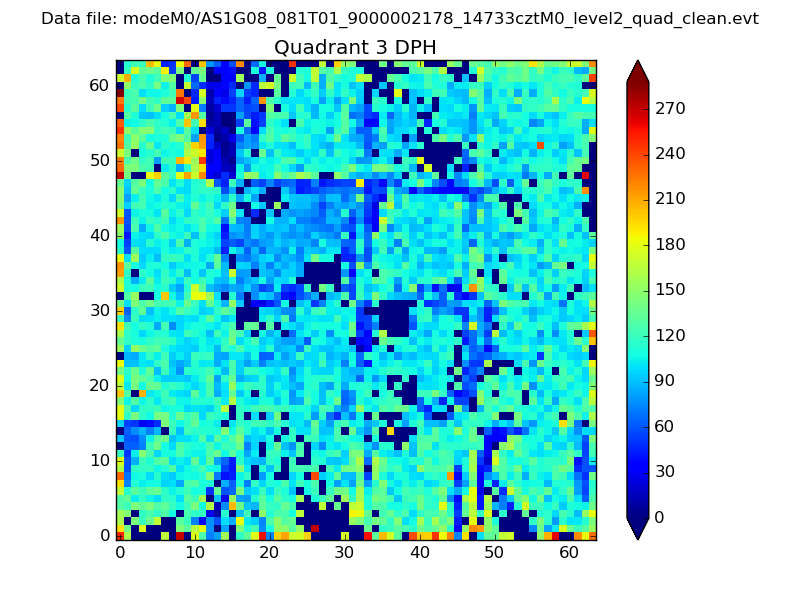 |
 |
Quadrant C |
| Plot type | Count rate plots | Images |
|---|---|---|
| Comparison with Poisson distribution Blue bars denote a histogram of data divided into 1 sec bins. Red curve is a Poisson curve with rate = median count rate of data. |
 |
 |
| Quadrant-wise count rates Data is divided into 100 sec bins |
 |
|
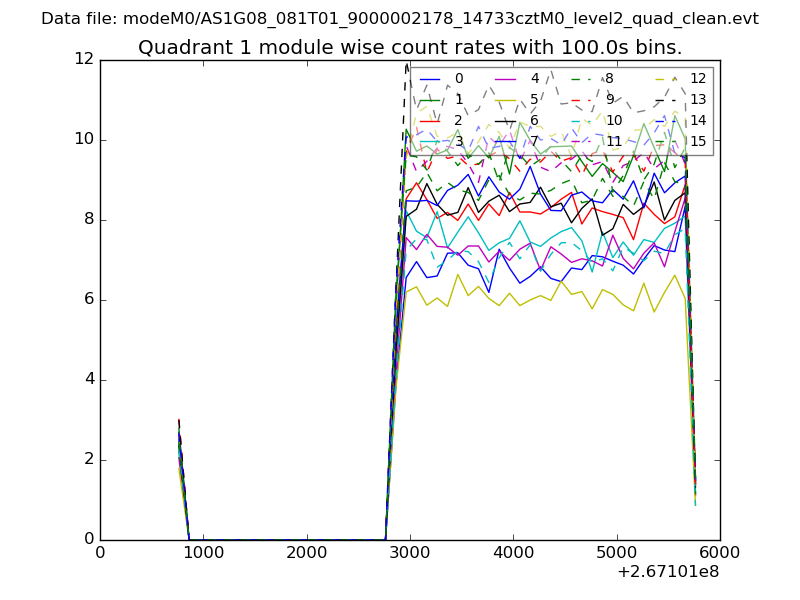
| Module-wise count rates for Quadrant A Data is divided into 100 sec bins |
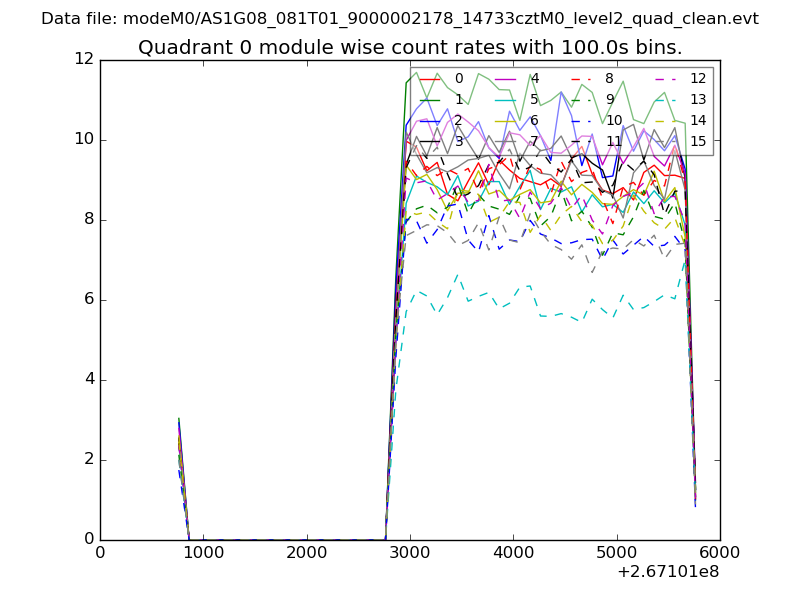 |
 |
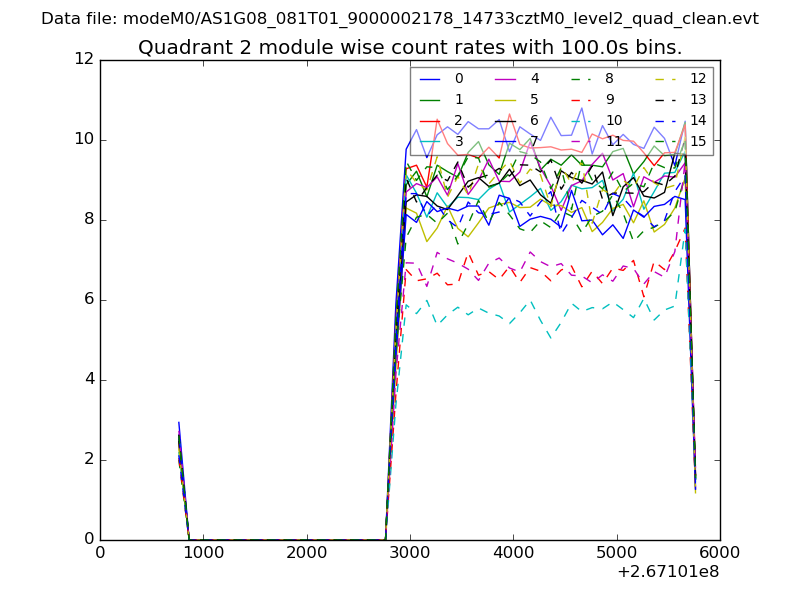
| Module-wise count rates for Quadrant B Data is divided into 100 sec bins |
 |
 |
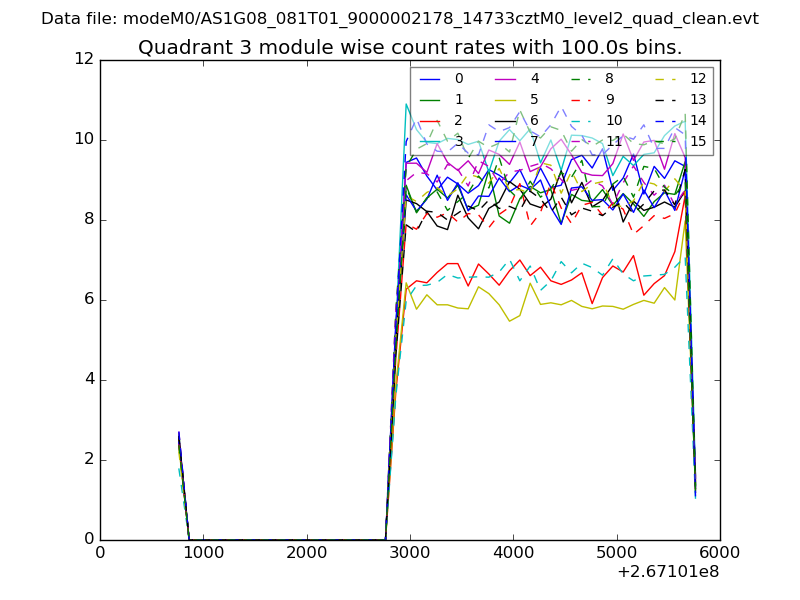
| Module-wise count rates for Quadrant C Data is divided into 100 sec bins |
 |
 |
| Module-wise count rates for Quadrant D Data is divided into 100 sec bins |
 |
 |
| Parameter | Plot |
|---|---|
| CZT HV Monitor | 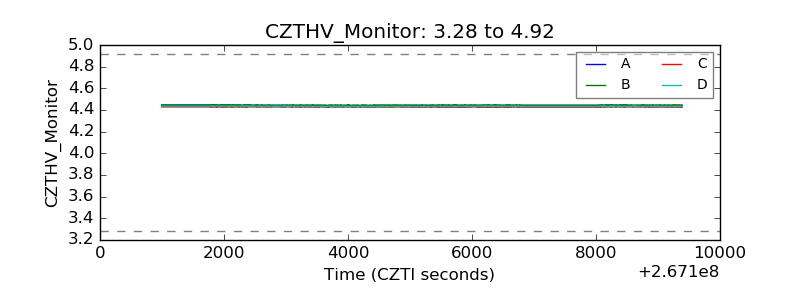 |
| D_VDD | 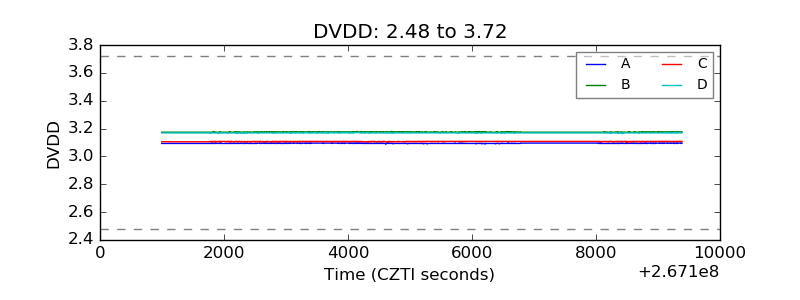 |
| Temperature 1 | 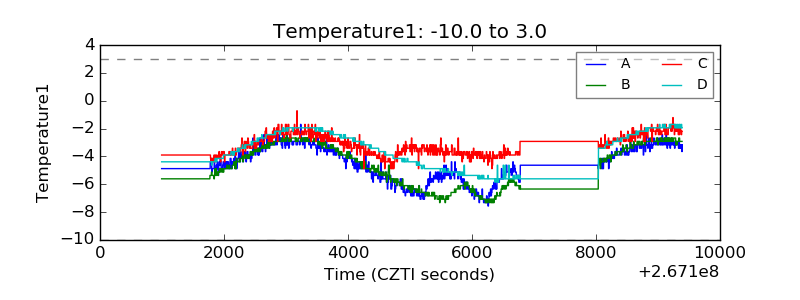 |
| Veto HV Monitor | 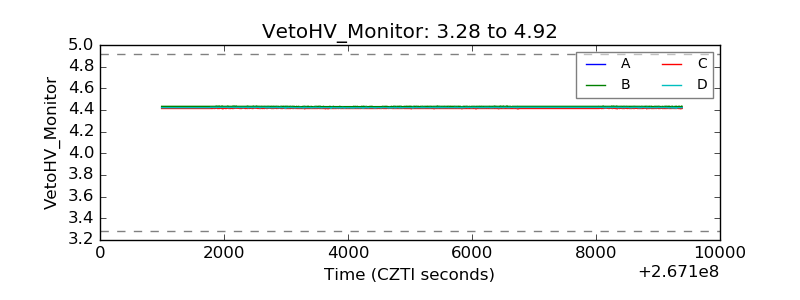 |
| Veto LLD | 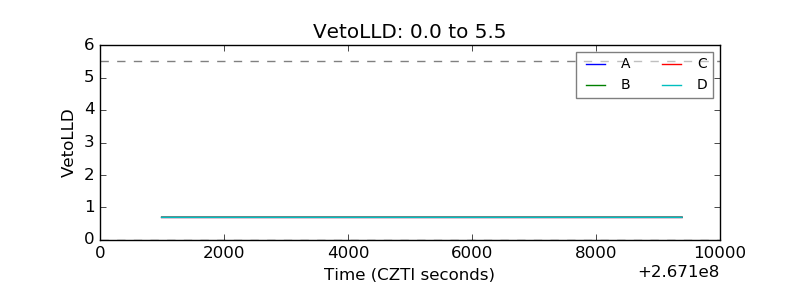 |
| Alpha Counter |  |
| _CPM_Rate | 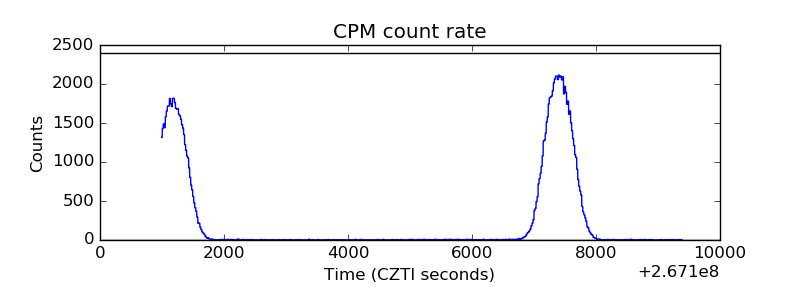 |
| CZT Counter | 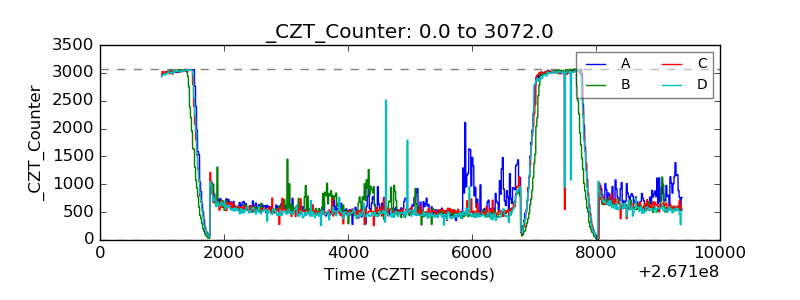 |
| +2.5 Volts monitor |  |
| +5 Volts monitor |  |
| _ROLL_ROT | 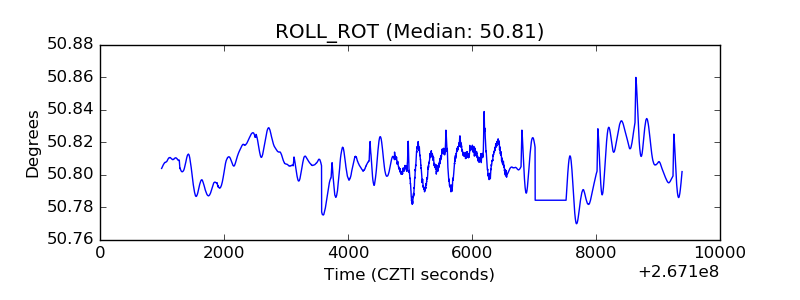 |
| _Roll_DEC | 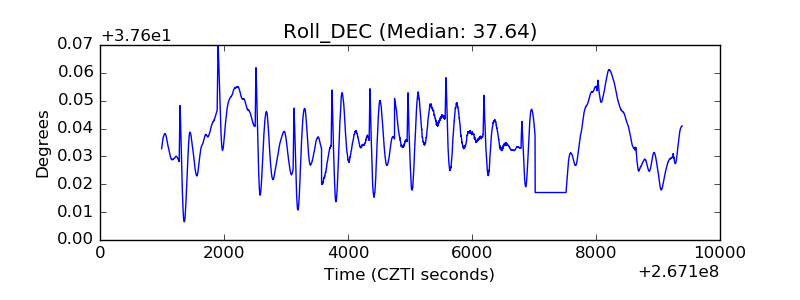 |
| _Roll_RA |  |
| Veto Counter | 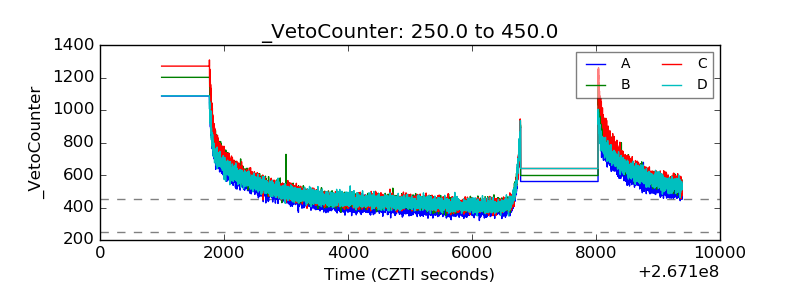 |