| Param | Original file | Final file |
|---|---|---|
| Filename | modeM0/AS1G08_081T01_9000002178_14734cztM0_level2.evt | modeM0/AS1G08_081T01_9000002178_14734cztM0_level2_quad_clean.evt |
| Size (bytes) | 539,784,000 | 76,720,320 |
| Size | 514.8 MB | 73.2 MB |
| Events in quadrant A | 5,151,560 | 473,906 |
| Events in quadrant B | 3,680,030 | 475,861 |
| Events in quadrant C | 3,642,589 | 464,924 |
| Events in quadrant D | 3,445,453 | 467,512 |
| Mode M0 | |||
|---|---|---|---|
| Quadrant | BADHDUFLAG | Total packets | Discarded packets |
| A | 0 | 19913 | 3 |
| B | 0 | 15132 | 2 |
| C | 0 | 14880 | 2 |
| D | 0 | 14258 | 2 |
| Mode SS | |||
|---|---|---|---|
| Quadrant | BADHDUFLAG | Total packets | Discarded packets |
| A | 0 | 128 | 0 |
| B | 0 | 128 | 0 |
| C | 0 | 128 | 0 |
| D | 0 | 128 | 0 |
| Mode M9 | |||
|---|---|---|---|
| Quadrant | BADHDUFLAG | Total packets | Discarded packets |
| A | 0 | 17 | 0 |
| B | 0 | 17 | 0 |
| C | 0 | 17 | 0 |
| D | 0 | 18 | 0 |
| Quadrant | Total seconds | Saturated seconds | Saturation percentage |
|---|---|---|---|
| A | 6318 | 250 | 3.956948% |
| B | 6318 | 141 | 2.231719% |
| C | 6318 | 97 | 1.535296% |
| D | 6318 | 107 | 1.693574% |
Noise dominated data is calculated using 1-second bins in cleaned event files. If a bin has >2000 counts, and if more than 50% of those come from <1% of pixels, then it is considered to be noise-dominated and hence unusable.
| Quadrant | # 1 sec bins | Bins with >0 counts | Bins with >2000 counts | High rate bins dominated by noise | Noise dominated (total time) | Noise dominated (detector-on time) | Marked lightcurve |
|---|---|---|---|---|---|---|---|
| A | 7624 | 6319 | 7 | 7 | 0.09% | 0.11% | 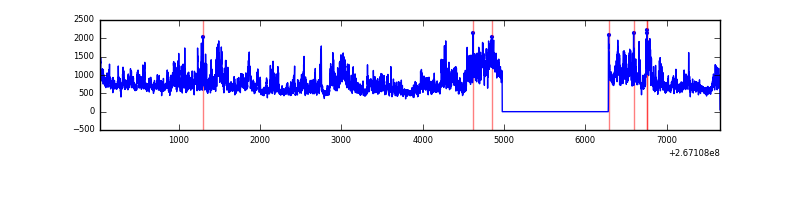 |
| B | 7624 | 6319 | 5 | 5 | 0.07% | 0.08% | 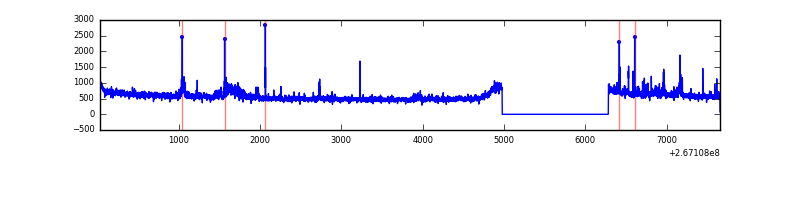 |
| C | 7624 | 6319 | 0 | 0 | 0.00% | 0.00% | 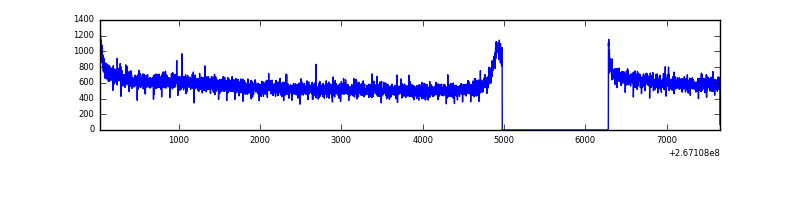 |
| D | 7624 | 6319 | 4 | 4 | 0.05% | 0.06% | 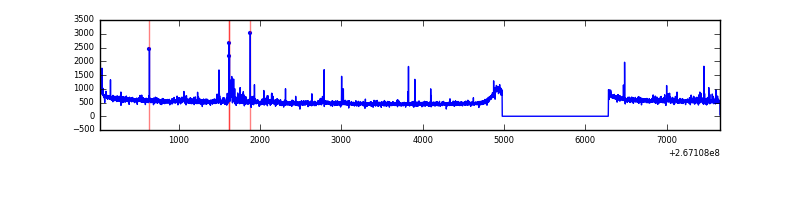 |
Top three noisy pixels from each quadrant. If the there are fewer than three noisy pixels in the level2.evt file, extra rows are filled as -1
| Pixel properties | Quadrant properties | ||||||
|---|---|---|---|---|---|---|---|
| Quadrant | DetID | PixID | Counts | Sigma | Mean | Median | Sigma |
| A | 8 | 15 | 1660046 | 9377.82 | 888 | 872 | 176.9 |
| A | 12 | 189 | 71299 | 398.06 | 888 | 872 | 176.9 |
| A | 0 | 226 | 7919 | 39.83 | 888 | 872 | 176.9 |
| B | 0 | 230 | 87709 | 530.48 | 881 | 863 | 163.7 |
| B | 0 | 205 | 46208 | 276.98 | 881 | 863 | 163.7 |
| B | 0 | 189 | 36825 | 219.67 | 881 | 863 | 163.7 |
| C | 3 | 233 | 287014 | 1463.06 | 860 | 870 | 195.6 |
| C | 13 | 61 | 6209 | 27.3 | 860 | 870 | 195.6 |
| C | 8 | 222 | 2537 | 8.52 | 860 | 870 | 195.6 |
| D | 12 | 16 | 80134 | 359.9 | 867 | 849 | 220.3 |
| D | 13 | 172 | 42438 | 188.79 | 867 | 849 | 220.3 |
| D | 2 | 234 | 23511 | 102.87 | 867 | 849 | 220.3 |
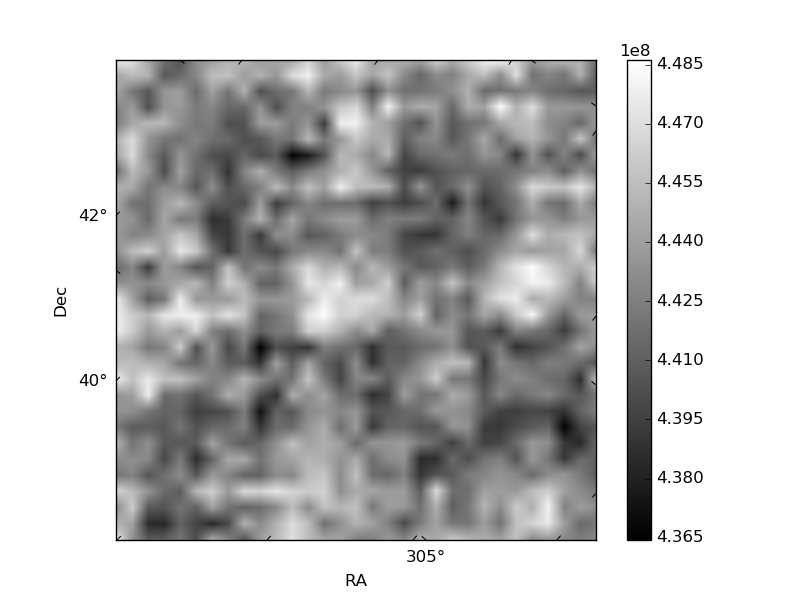
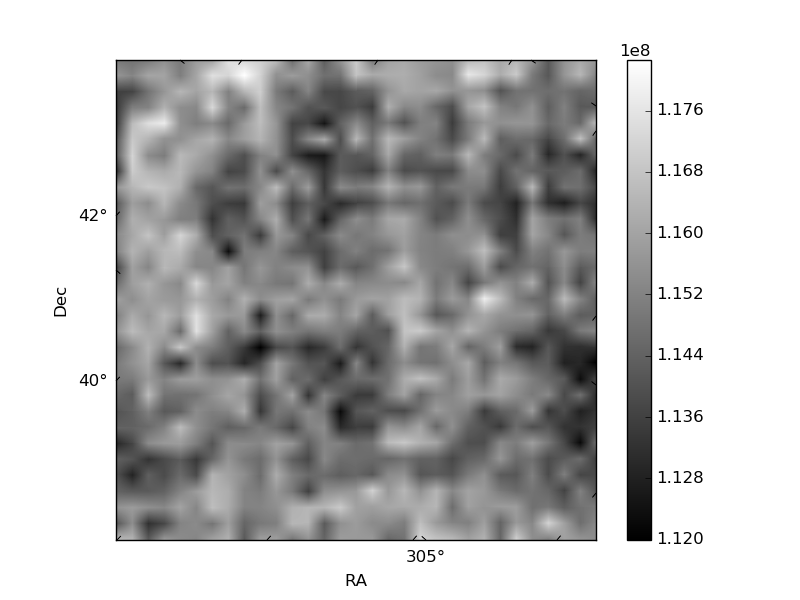
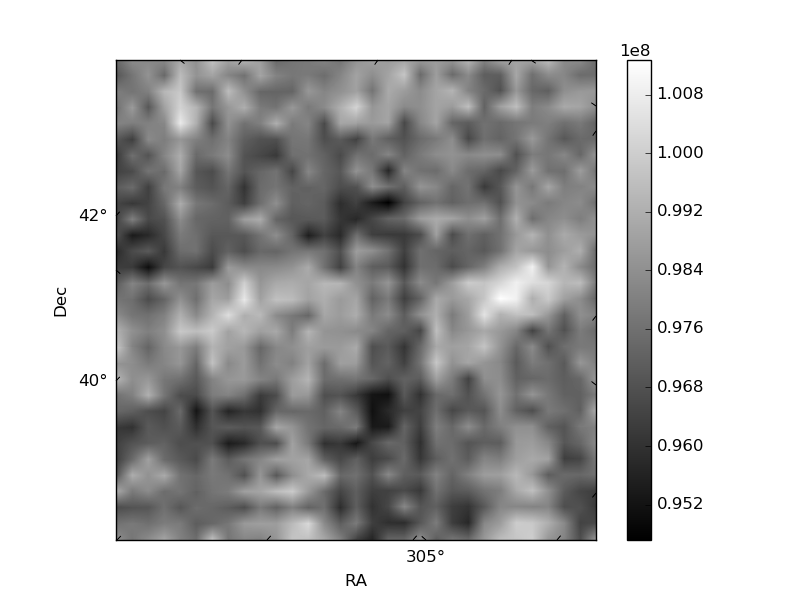
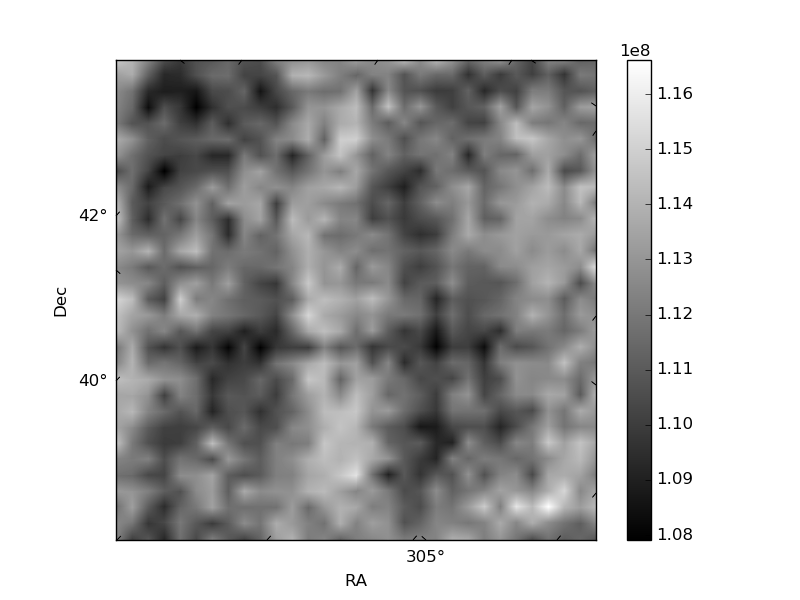
Histogram calculated using DETX and DETY for each event in the final _common_clean file
| Quadrant A | 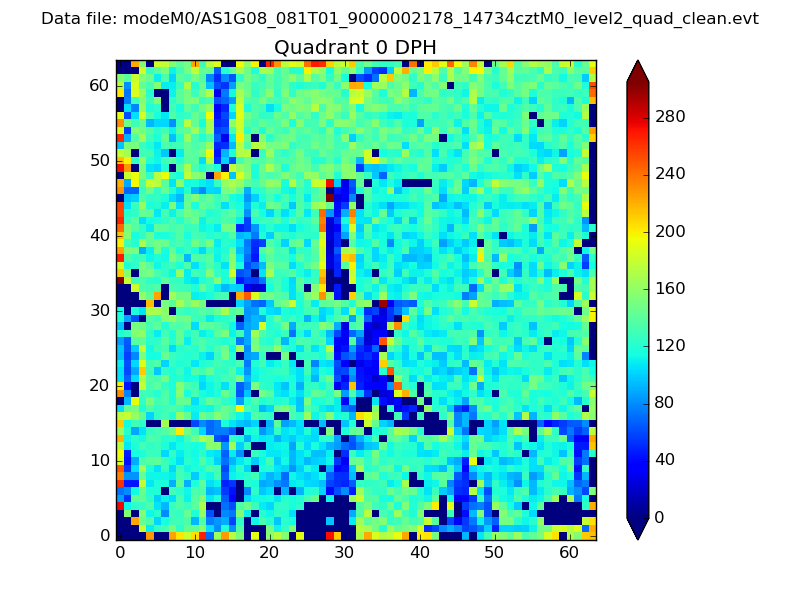 |
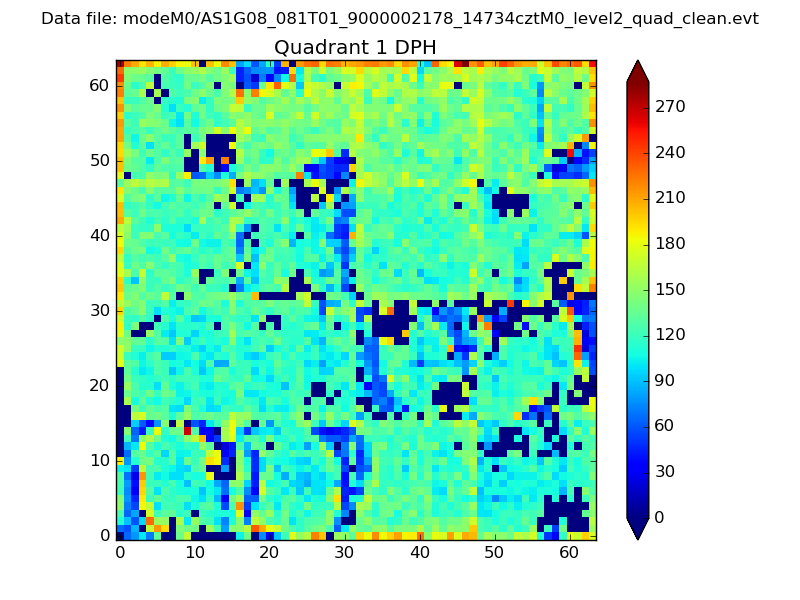 |
Quadrant B |
|---|---|---|---|
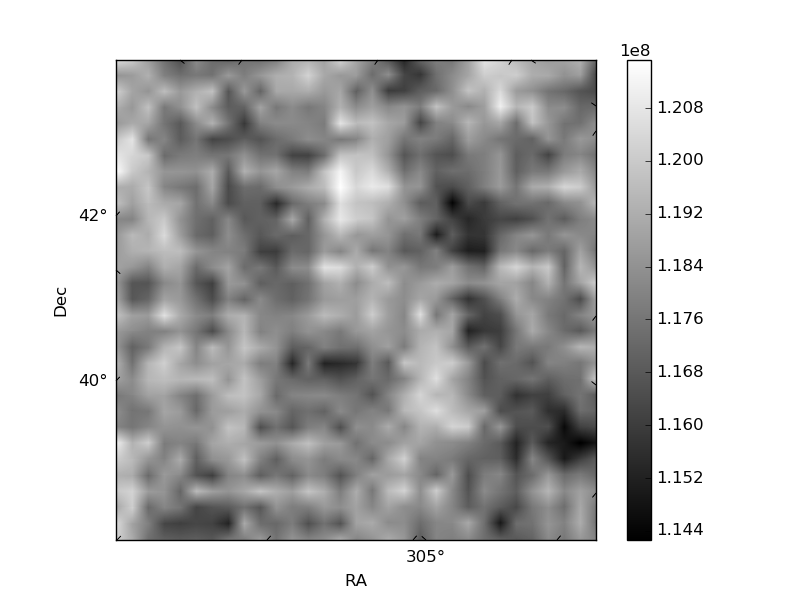
| Quadrant D | 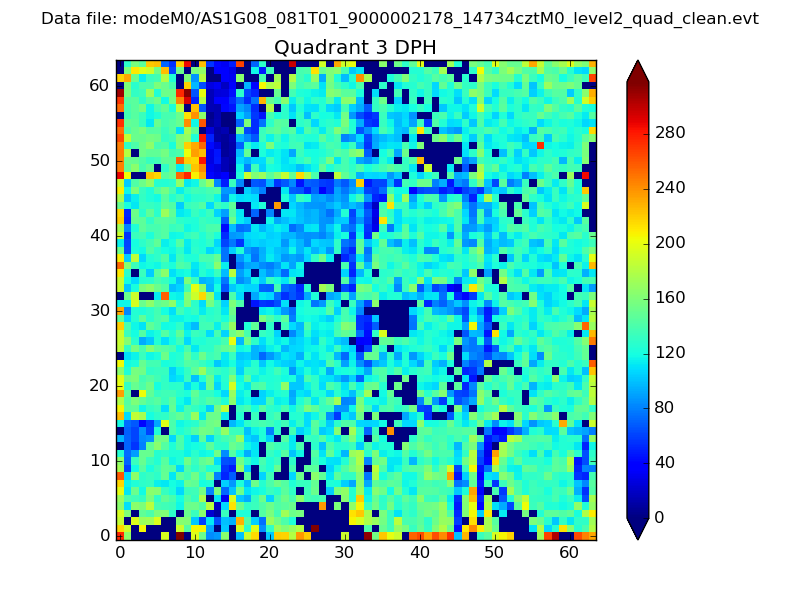 |
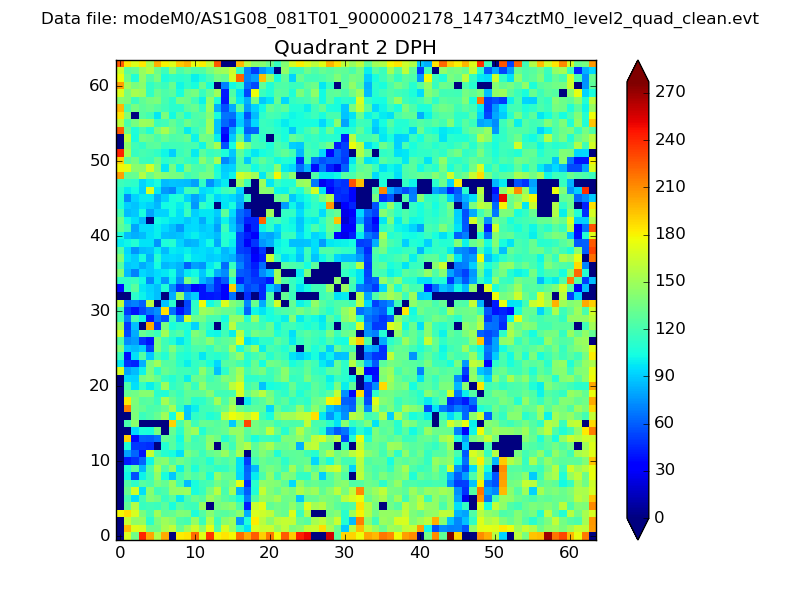 |
Quadrant C |
| Plot type | Count rate plots | Images |
|---|---|---|
| Comparison with Poisson distribution Blue bars denote a histogram of data divided into 1 sec bins. Red curve is a Poisson curve with rate = median count rate of data. |
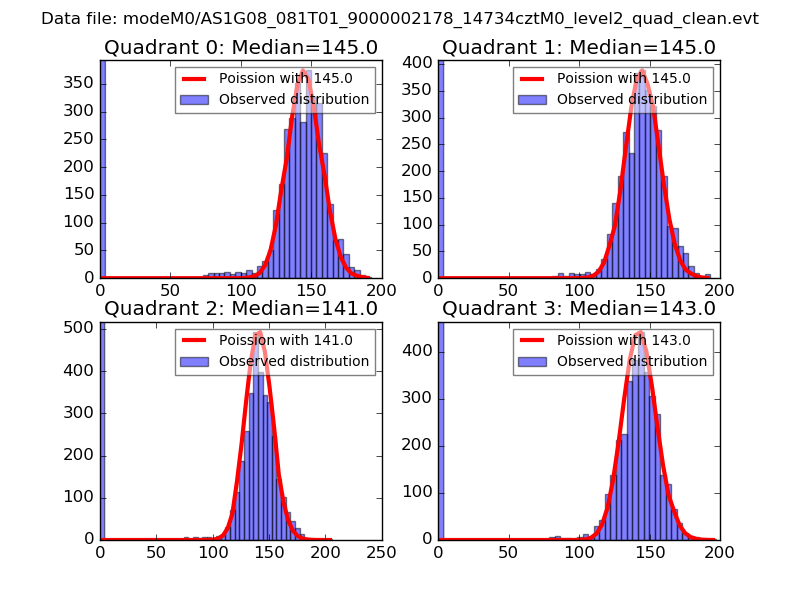 |
 |
| Quadrant-wise count rates Data is divided into 100 sec bins |
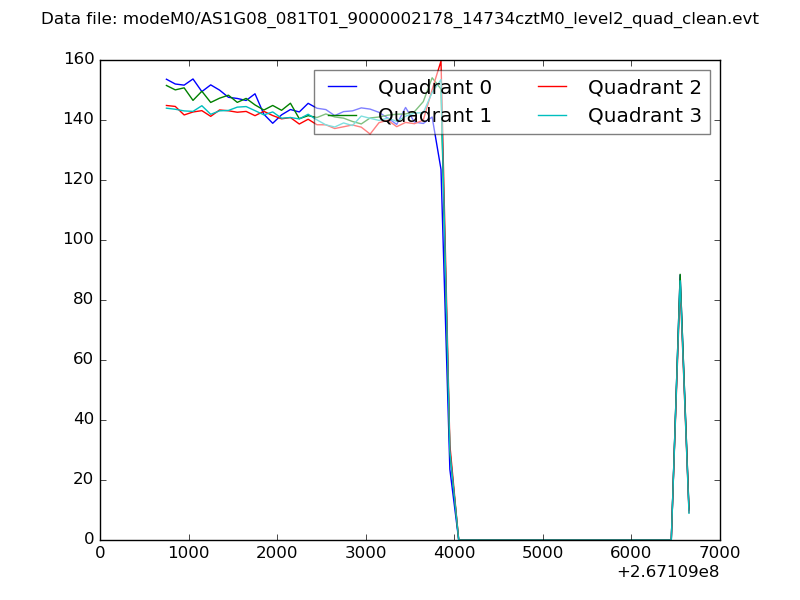 |
|
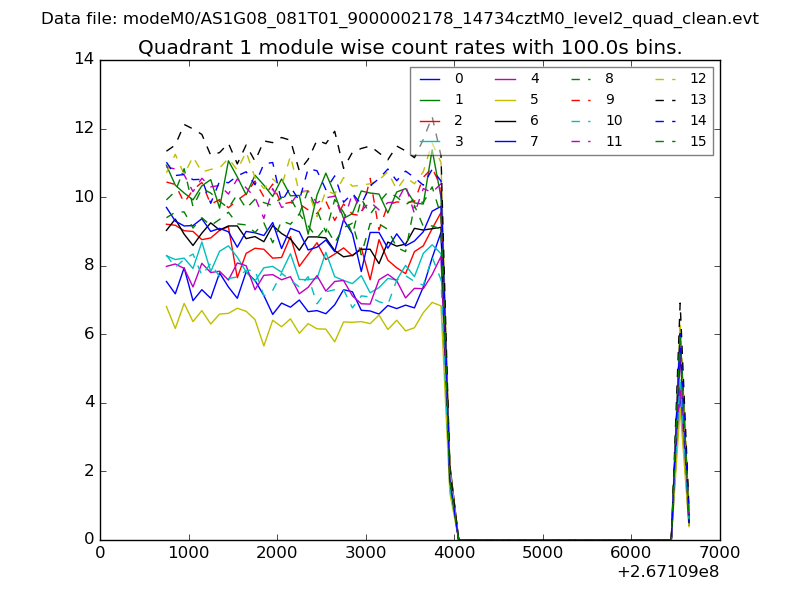
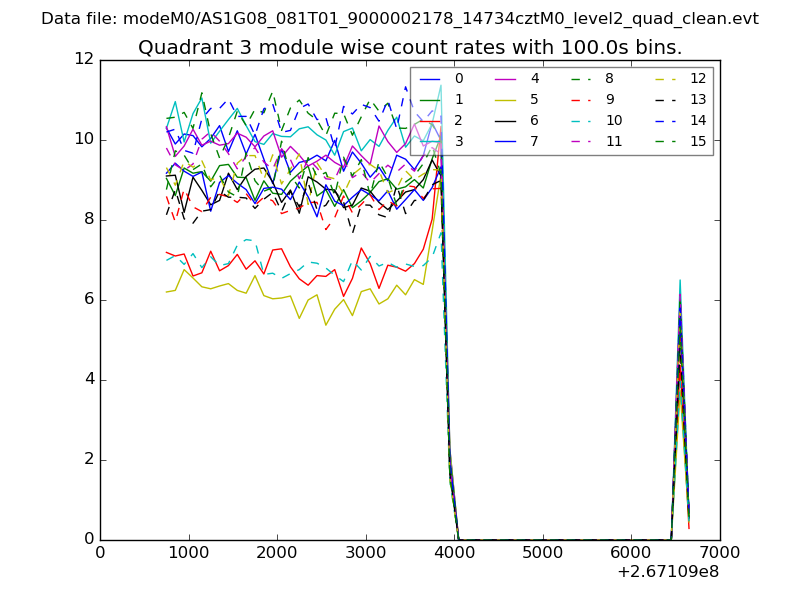
| Module-wise count rates for Quadrant A Data is divided into 100 sec bins |
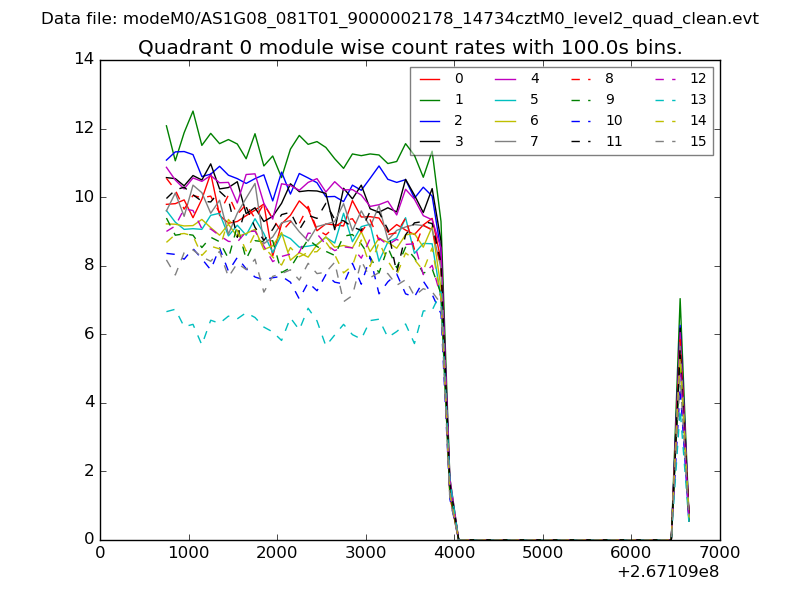 |
 |
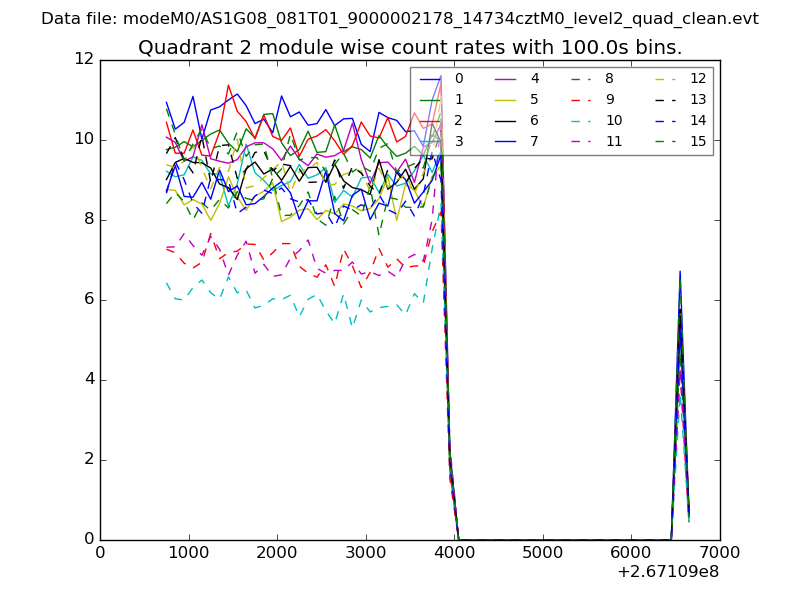
| Module-wise count rates for Quadrant B Data is divided into 100 sec bins |
 |
 |
| Module-wise count rates for Quadrant C Data is divided into 100 sec bins |
 |
 |
| Module-wise count rates for Quadrant D Data is divided into 100 sec bins |
 |
 |
| Parameter | Plot |
|---|---|
| CZT HV Monitor | 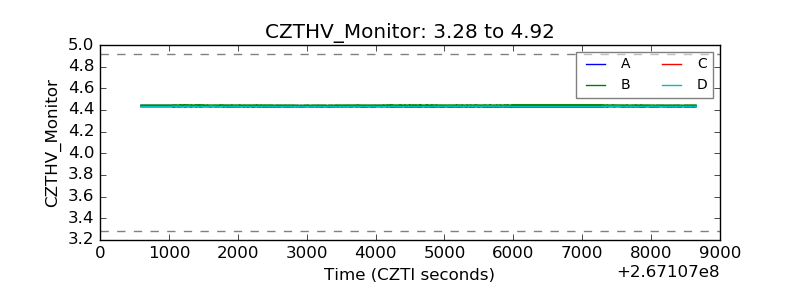 |
| D_VDD | 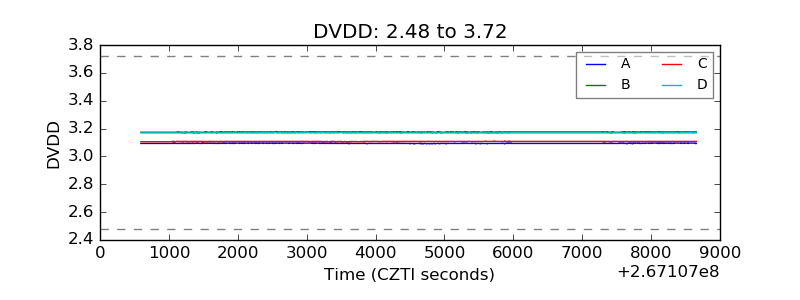 |
| Temperature 1 | 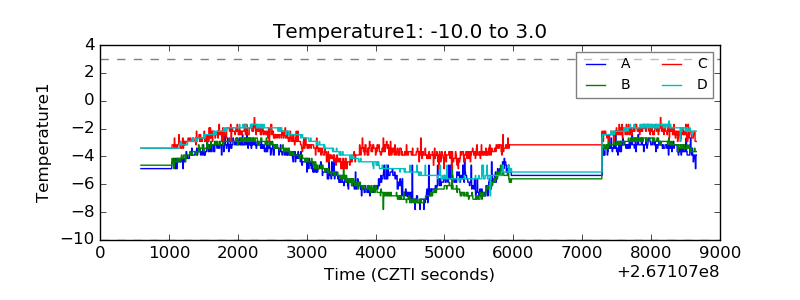 |
| Veto HV Monitor | 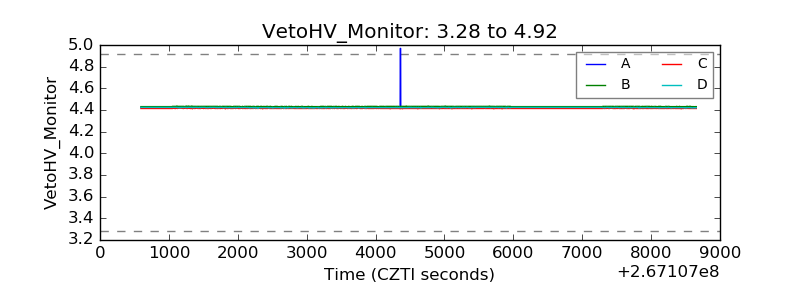 |
| Veto LLD | 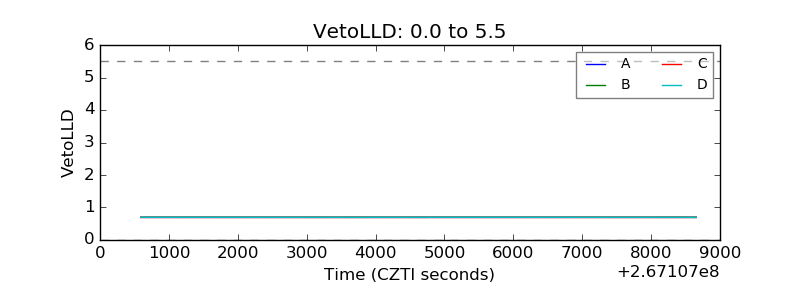 |
| Alpha Counter | 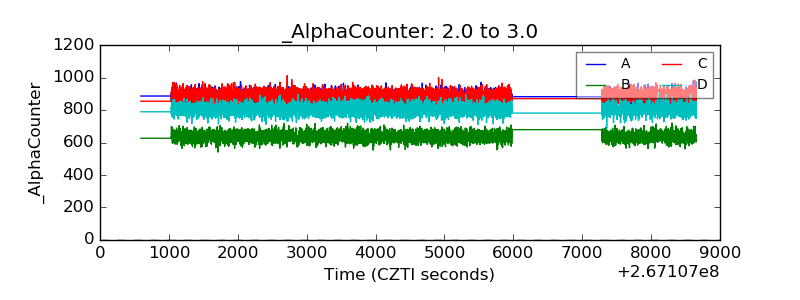 |
| _CPM_Rate | 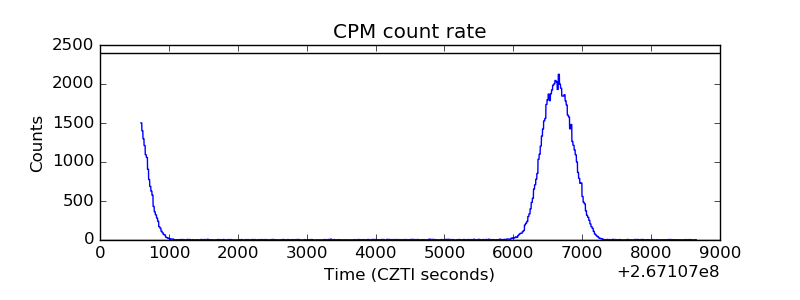 |
| CZT Counter | 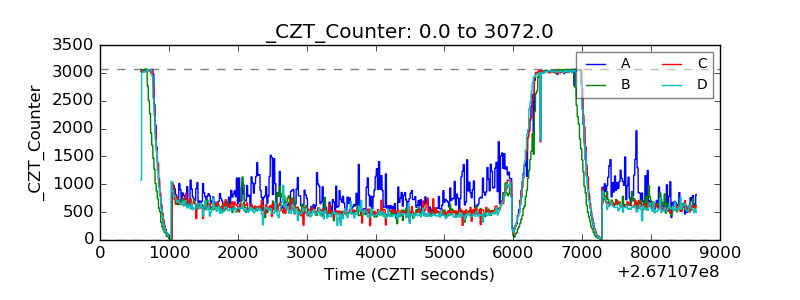 |
| +2.5 Volts monitor |  |
| +5 Volts monitor |  |
| _ROLL_ROT | 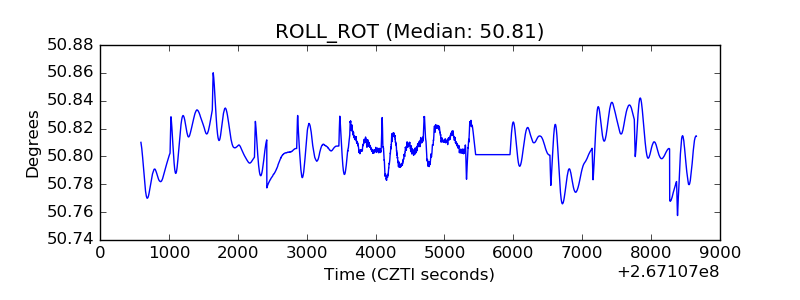 |
| _Roll_DEC | 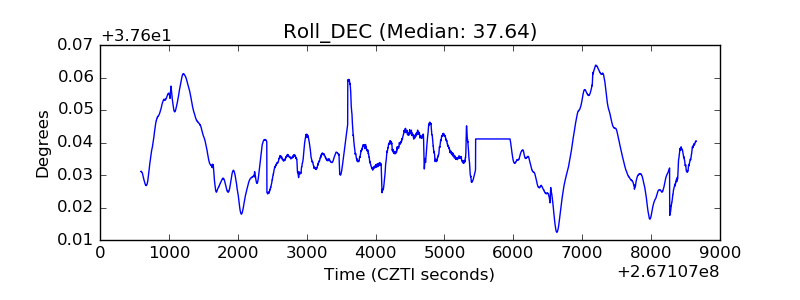 |
| _Roll_RA | 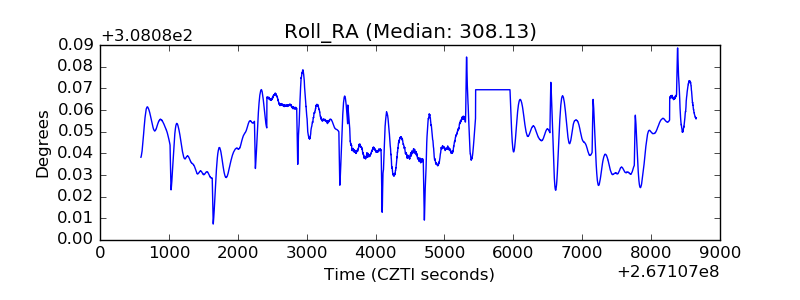 |
| Veto Counter | 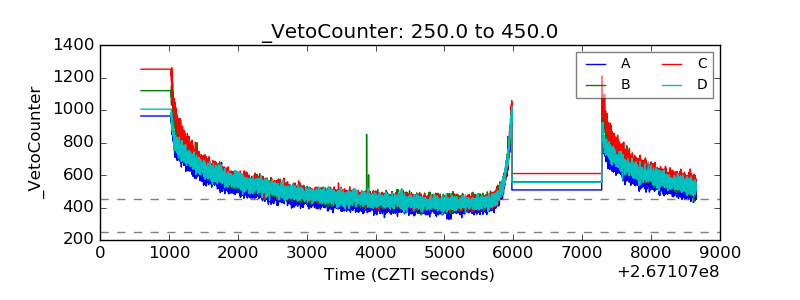 |