| Param | Original file | Final file |
|---|---|---|
| Filename | modeM0/AS1G08_081T01_9000002178_14735cztM0_level2.evt | modeM0/AS1G08_081T01_9000002178_14735cztM0_level2_quad_clean.evt |
| Size (bytes) | 515,341,440 | 90,864,000 |
| Size | 491.5 MB | 86.7 MB |
| Events in quadrant A | 4,741,611 | 586,415 |
| Events in quadrant B | 3,562,549 | 586,024 |
| Events in quadrant C | 3,562,145 | 572,966 |
| Events in quadrant D | 3,320,430 | 573,271 |
| Mode M0 | |||
|---|---|---|---|
| Quadrant | BADHDUFLAG | Total packets | Discarded packets |
| A | 0 | 18320 | 3 |
| B | 0 | 14689 | 2 |
| C | 0 | 14553 | 2 |
| D | 0 | 13796 | 2 |
| Mode SS | |||
|---|---|---|---|
| Quadrant | BADHDUFLAG | Total packets | Discarded packets |
| A | 0 | 128 | 0 |
| B | 0 | 128 | 0 |
| C | 0 | 128 | 0 |
| D | 0 | 128 | 0 |
| Mode M9 | |||
|---|---|---|---|
| Quadrant | BADHDUFLAG | Total packets | Discarded packets |
| A | 0 | 27 | 0 |
| B | 0 | 27 | 0 |
| C | 0 | 27 | 0 |
| D | 0 | 27 | 0 |
| Quadrant | Total seconds | Saturated seconds | Saturation percentage |
|---|---|---|---|
| A | 6204 | 290 | 4.674404% |
| B | 6204 | 148 | 2.385558% |
| C | 6204 | 96 | 1.547389% |
| D | 6204 | 117 | 1.885880% |
Noise dominated data is calculated using 1-second bins in cleaned event files. If a bin has >2000 counts, and if more than 50% of those come from <1% of pixels, then it is considered to be noise-dominated and hence unusable.
| Quadrant | # 1 sec bins | Bins with >0 counts | Bins with >2000 counts | High rate bins dominated by noise | Noise dominated (total time) | Noise dominated (detector-on time) | Marked lightcurve |
|---|---|---|---|---|---|---|---|
| A | 8865 | 6205 | 27 | 27 | 0.30% | 0.44% | 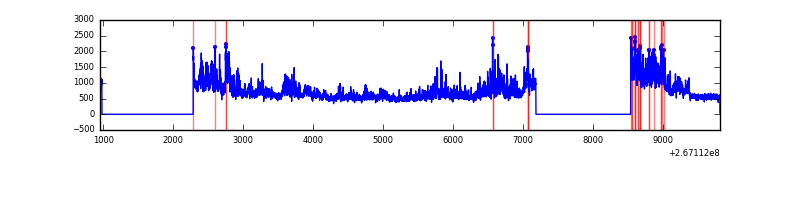 |
| B | 8865 | 6205 | 10 | 10 | 0.11% | 0.16% | 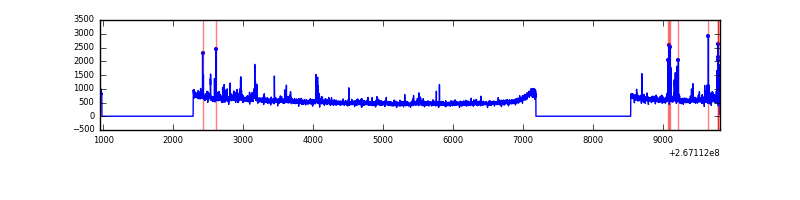 |
| C | 8865 | 6205 | 0 | 0 | 0.00% | 0.00% | 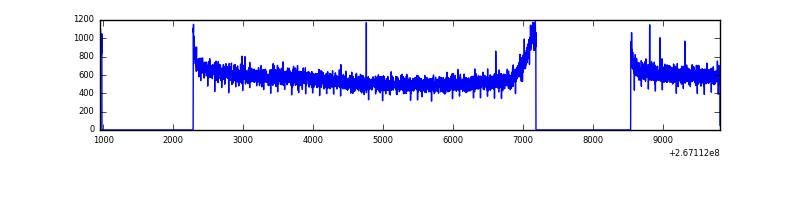 |
| D | 8865 | 6205 | 13 | 13 | 0.15% | 0.21% | 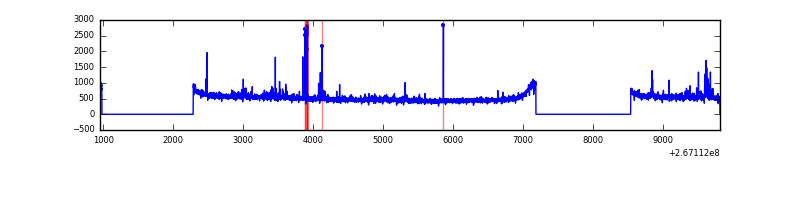 |
Top three noisy pixels from each quadrant. If the there are fewer than three noisy pixels in the level2.evt file, extra rows are filled as -1
| Pixel properties | Quadrant properties | ||||||
|---|---|---|---|---|---|---|---|
| Quadrant | DetID | PixID | Counts | Sigma | Mean | Median | Sigma |
| A | 8 | 15 | 1417222 | 8363.7 | 853 | 837 | 169.3 |
| A | 12 | 189 | 34450 | 198.48 | 853 | 837 | 169.3 |
| A | 3 | 1 | 7821 | 41.24 | 853 | 837 | 169.3 |
| B | 0 | 197 | 95125 | 590.91 | 851 | 833 | 159.6 |
| B | 0 | 205 | 49900 | 307.49 | 851 | 833 | 159.6 |
| B | 0 | 189 | 43747 | 268.93 | 851 | 833 | 159.6 |
| C | 3 | 233 | 289381 | 1517.46 | 836 | 844 | 190.1 |
| C | 14 | 220 | 7807 | 36.62 | 836 | 844 | 190.1 |
| C | 13 | 61 | 6180 | 28.06 | 836 | 844 | 190.1 |
| D | 13 | 172 | 78666 | 359.93 | 840 | 821 | 216.3 |
| D | 12 | 16 | 44967 | 204.12 | 840 | 821 | 216.3 |
| D | 2 | 234 | 21418 | 95.23 | 840 | 821 | 216.3 |
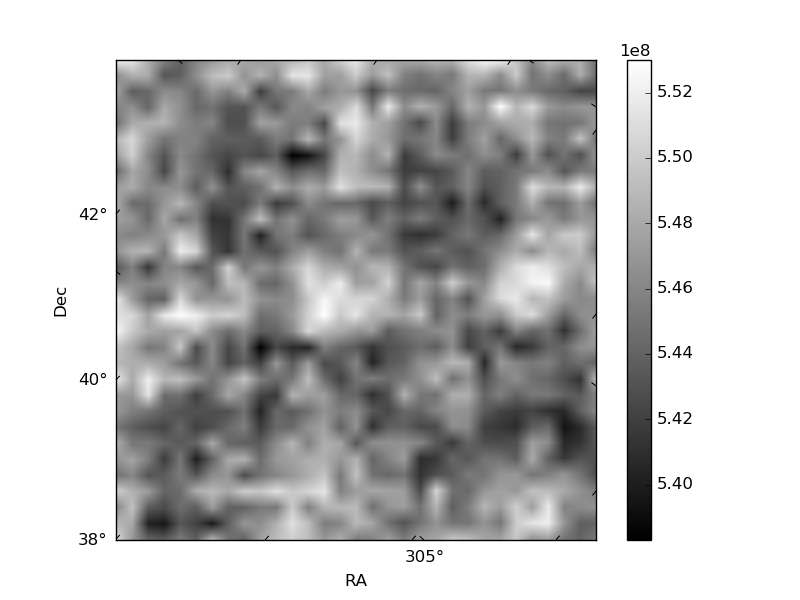
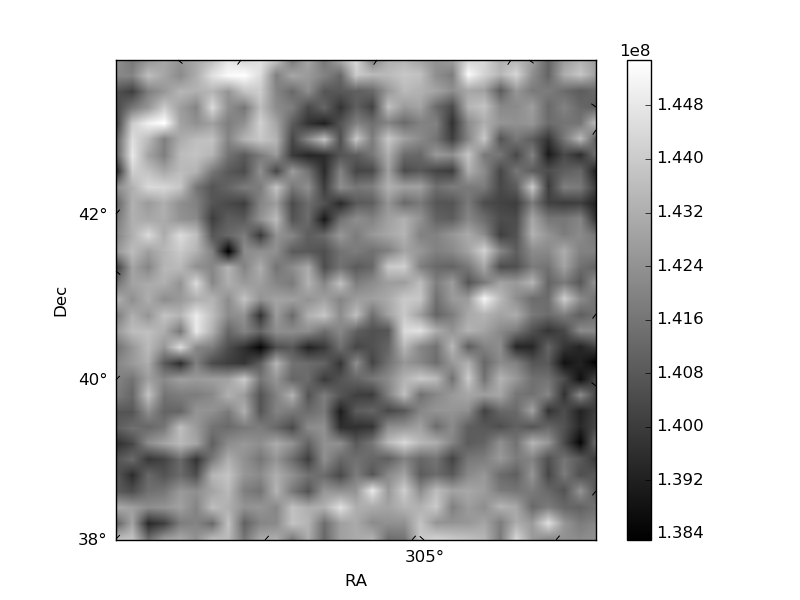
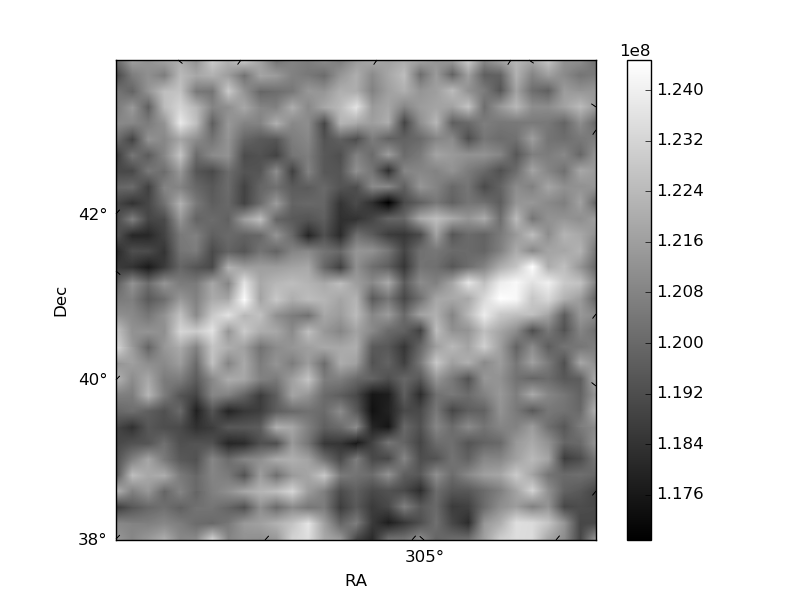
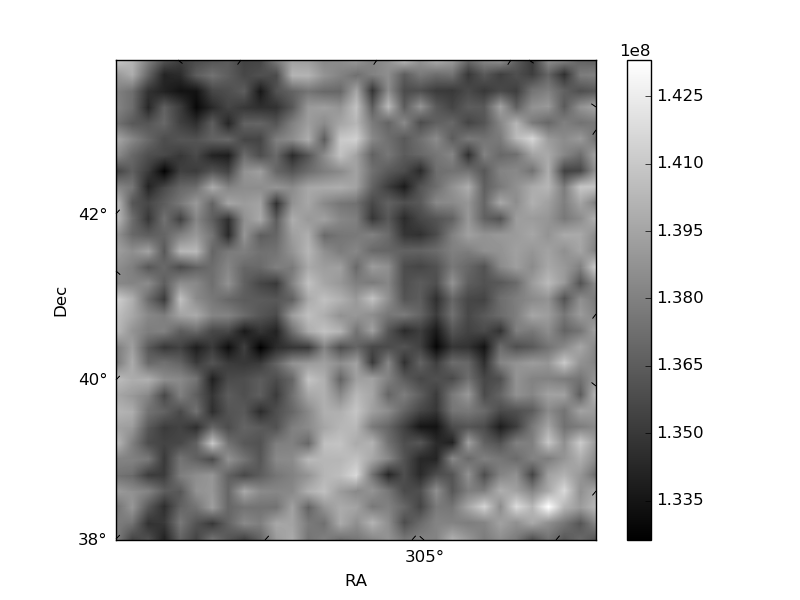
Histogram calculated using DETX and DETY for each event in the final _common_clean file
| Quadrant A | 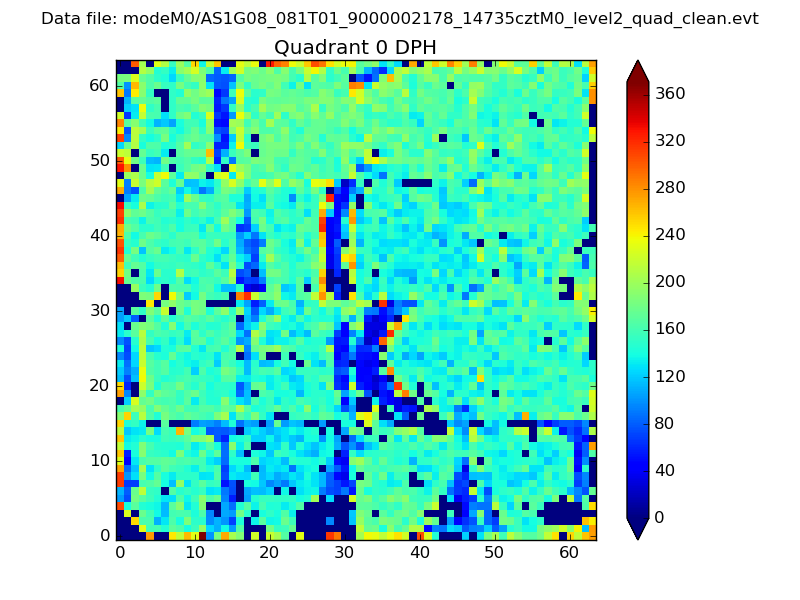 |
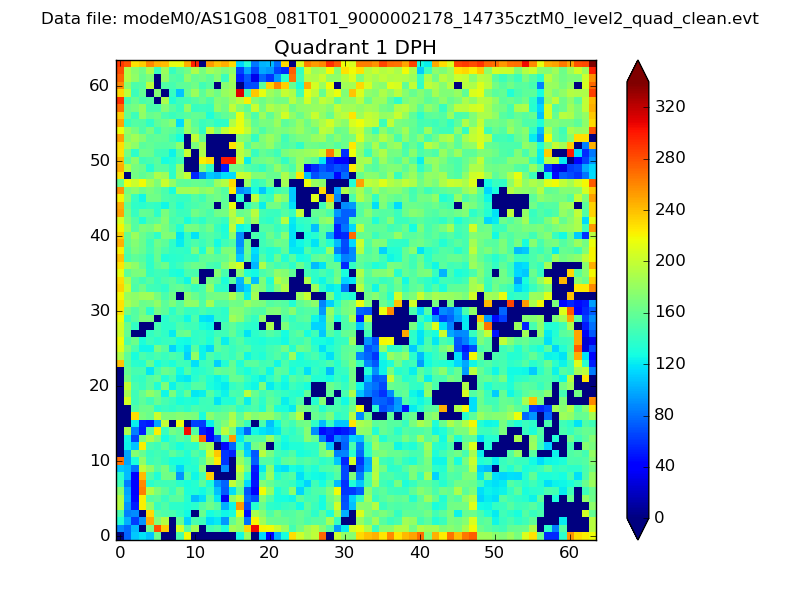 |
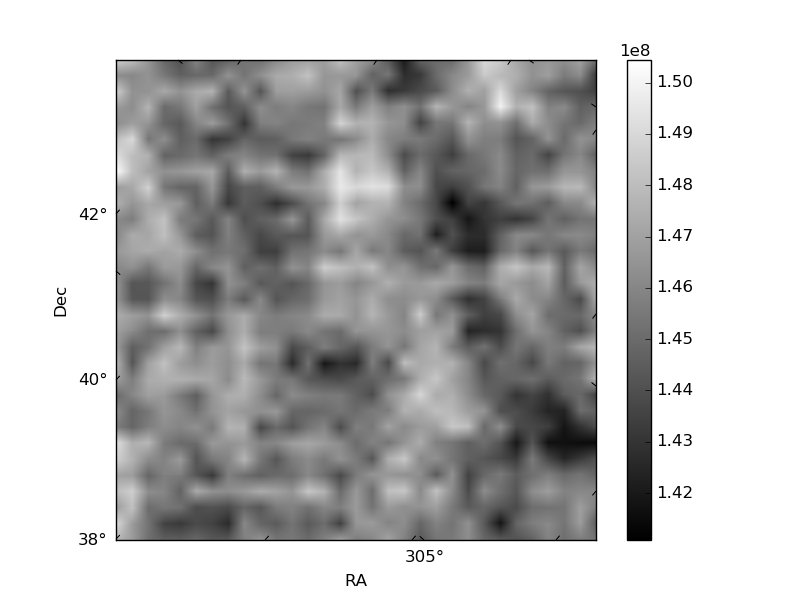
Quadrant B |
|---|---|---|---|
| Quadrant D | 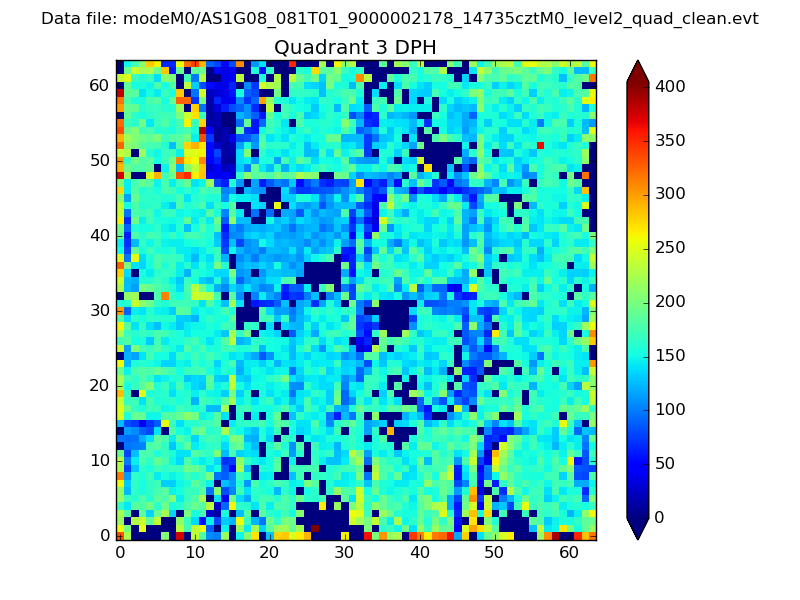 |
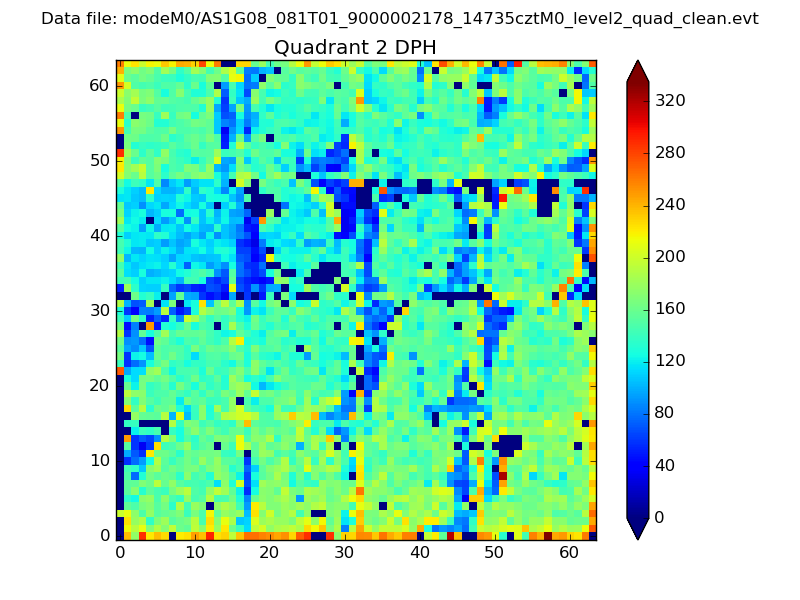 |
Quadrant C |
| Plot type | Count rate plots | Images |
|---|---|---|
| Comparison with Poisson distribution Blue bars denote a histogram of data divided into 1 sec bins. Red curve is a Poisson curve with rate = median count rate of data. |
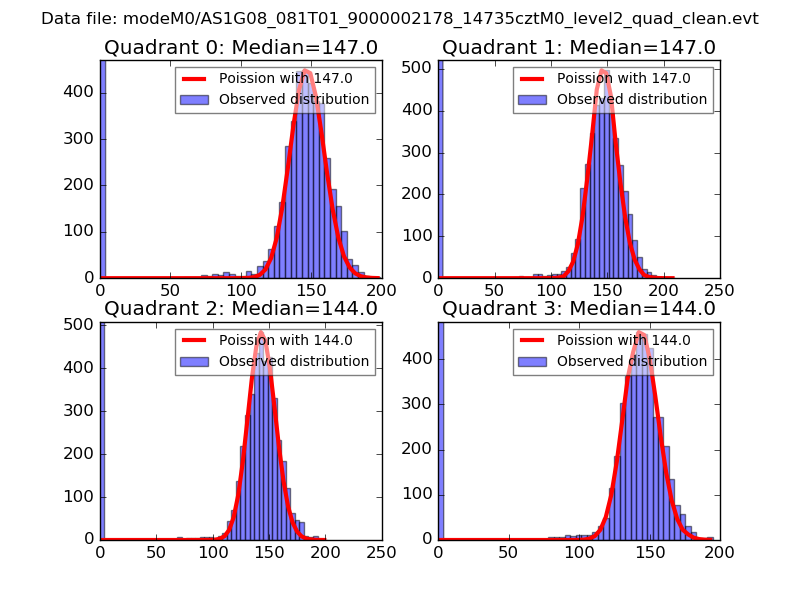 |
 |
| Quadrant-wise count rates Data is divided into 100 sec bins |
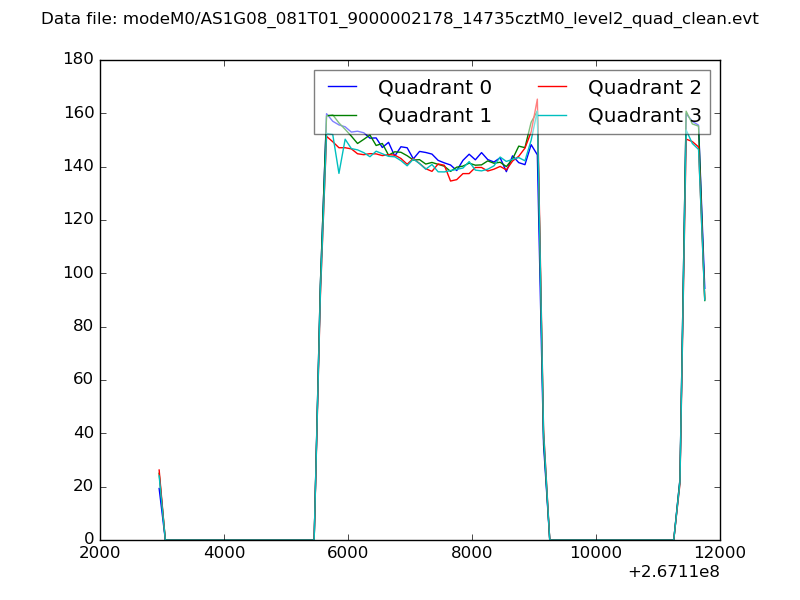 |
|
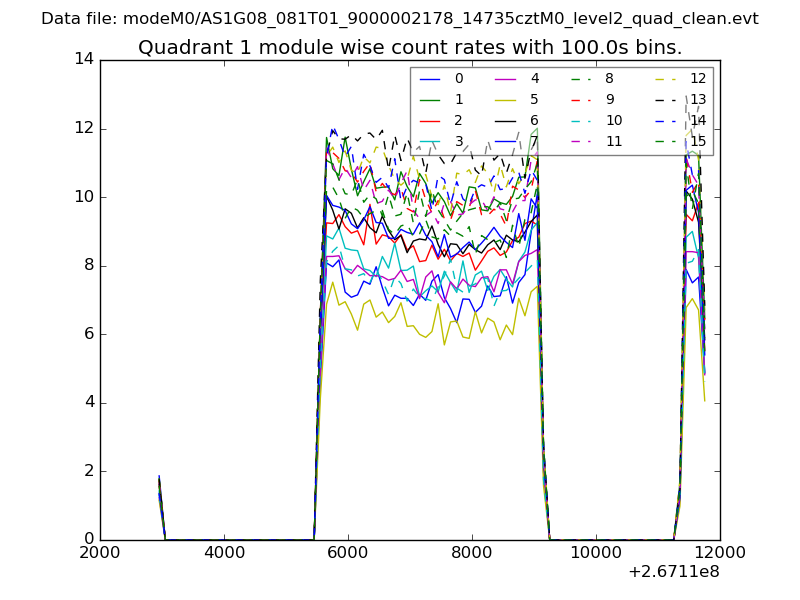
| Module-wise count rates for Quadrant A Data is divided into 100 sec bins |
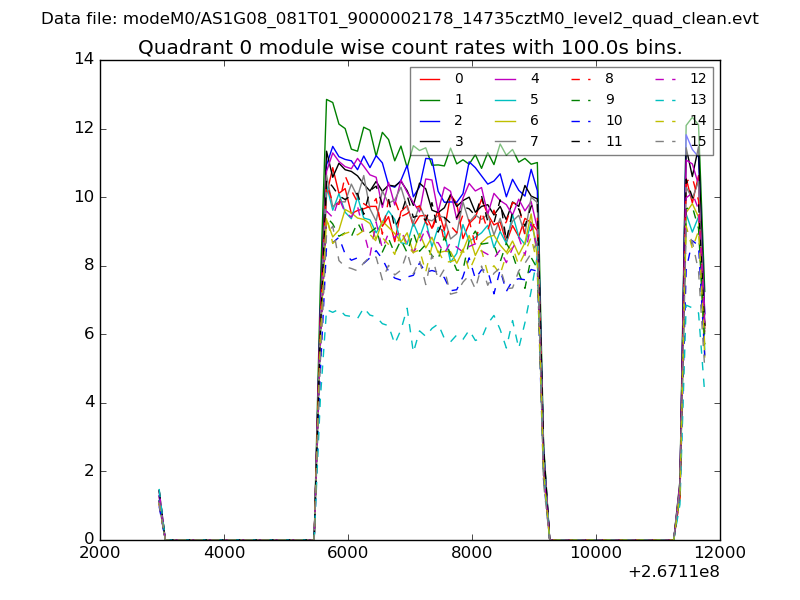 |
 |
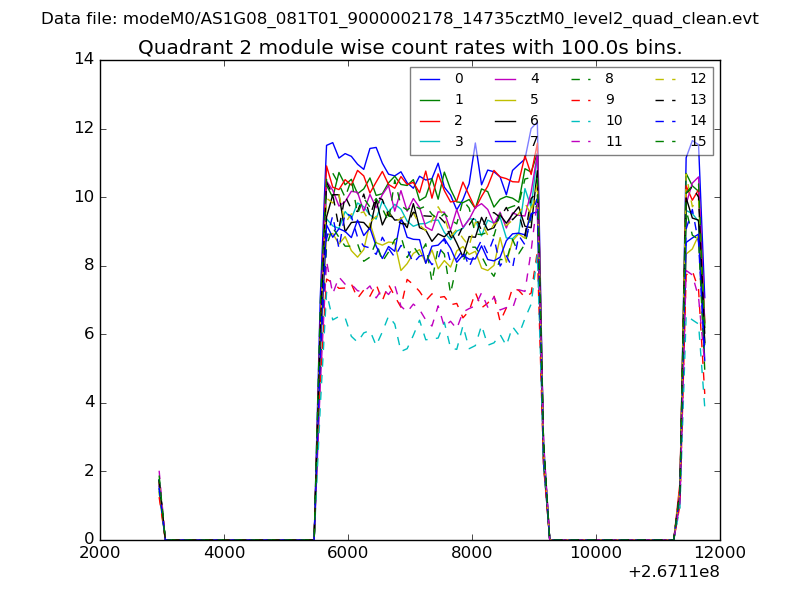
| Module-wise count rates for Quadrant B Data is divided into 100 sec bins |
 |
 |
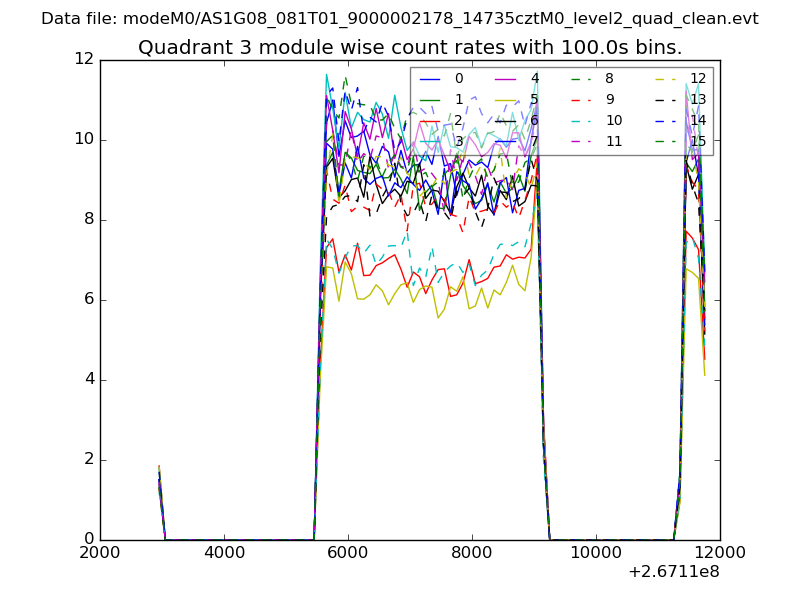
| Module-wise count rates for Quadrant C Data is divided into 100 sec bins |
 |
 |
| Module-wise count rates for Quadrant D Data is divided into 100 sec bins |
 |
 |
| Parameter | Plot |
|---|---|
| CZT HV Monitor | 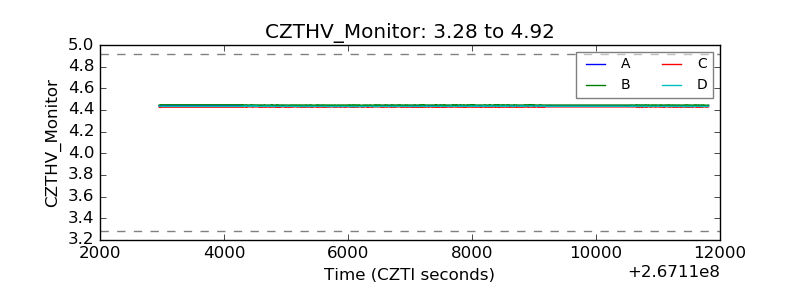 |
| D_VDD | 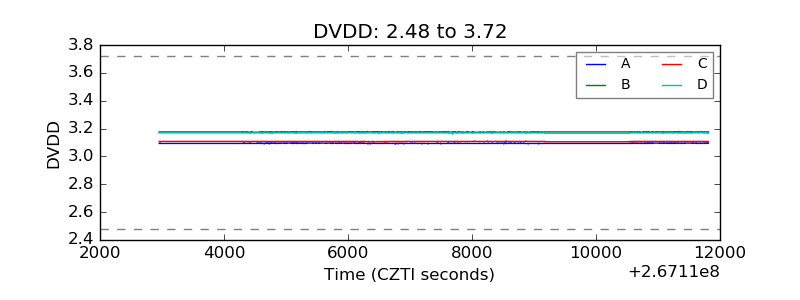 |
| Temperature 1 | 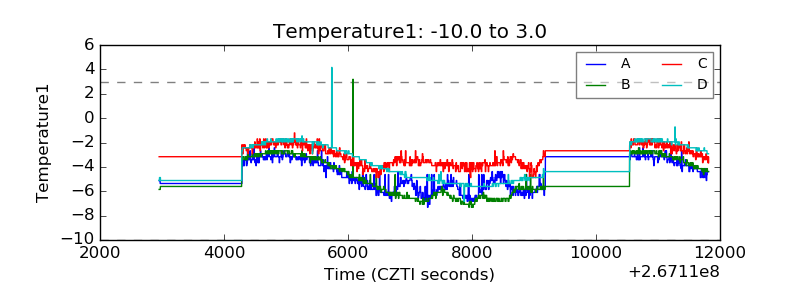 |
| Veto HV Monitor | 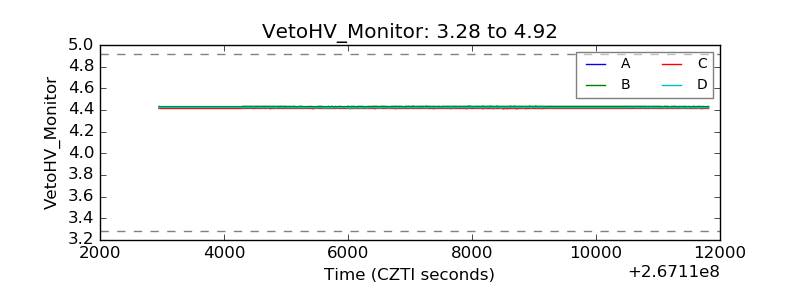 |
| Veto LLD | 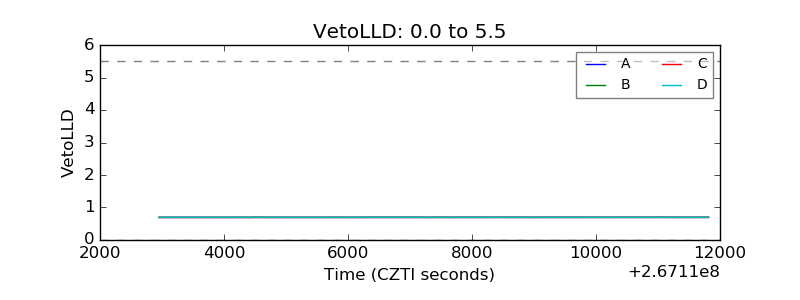 |
| Alpha Counter | 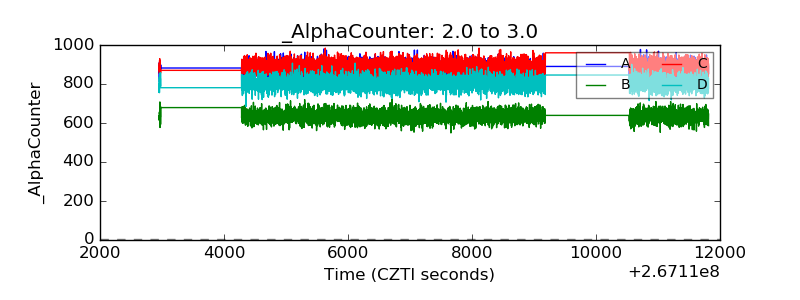 |
| _CPM_Rate | 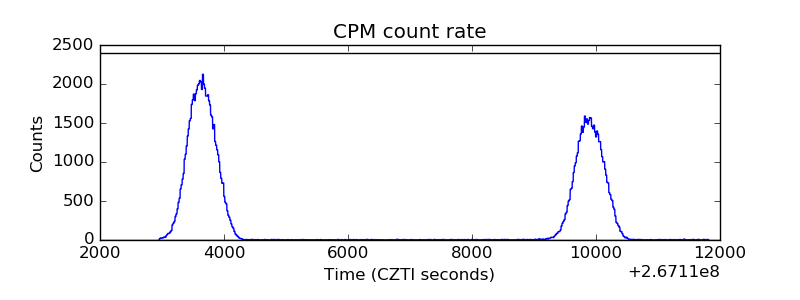 |
| CZT Counter | 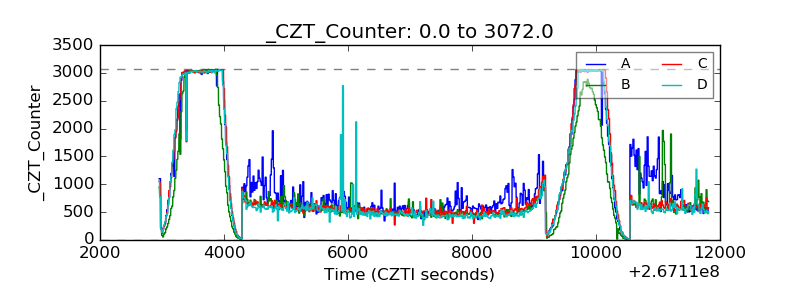 |
| +2.5 Volts monitor | 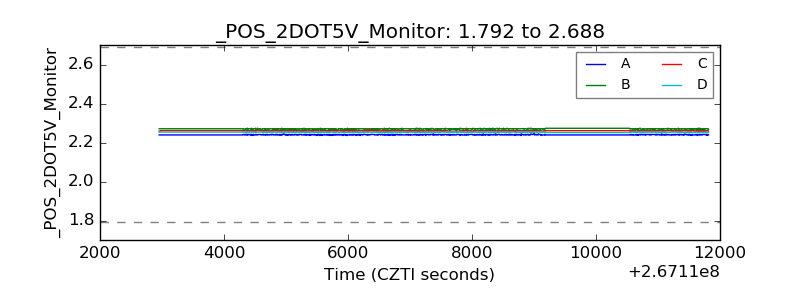 |
| +5 Volts monitor |  |
| _ROLL_ROT | 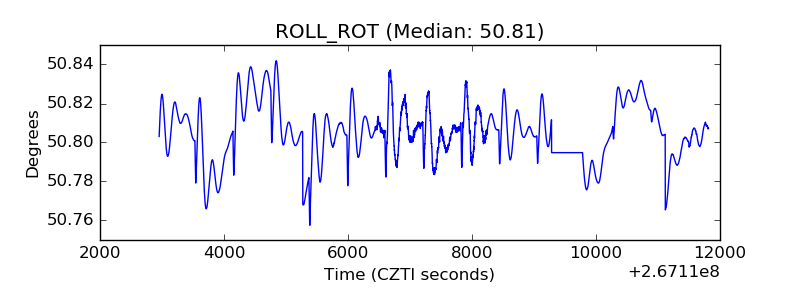 |
| _Roll_DEC | 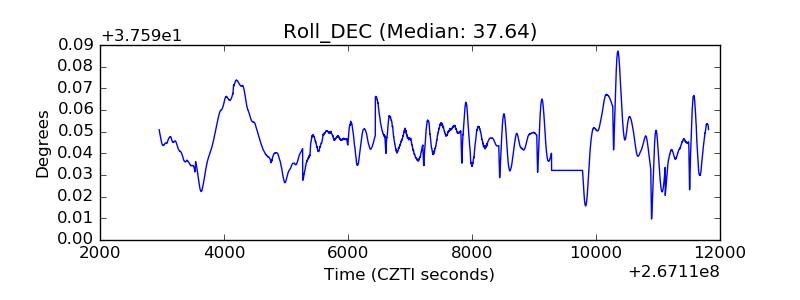 |
| _Roll_RA | 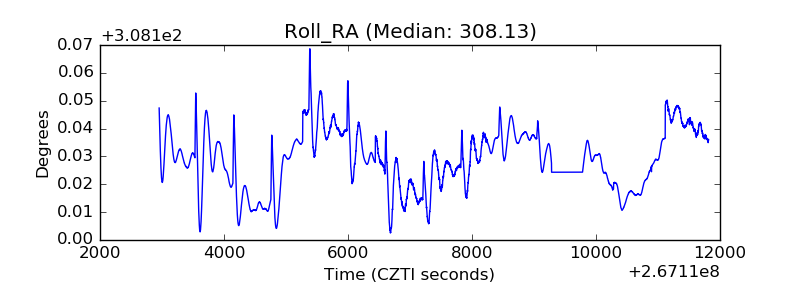 |
| Veto Counter | 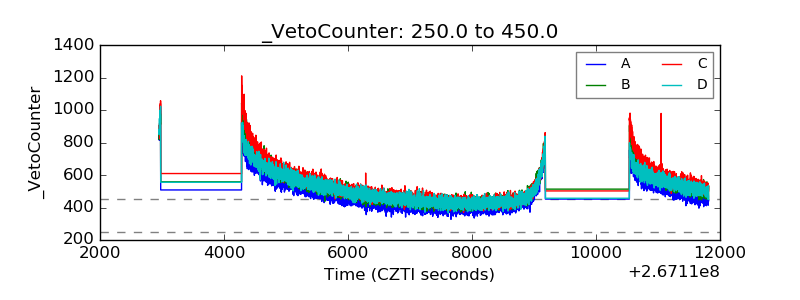 |