| Param | Original file | Final file |
|---|---|---|
| Filename | modeM0/AS1G08_081T01_9000002178_14736cztM0_level2.evt | modeM0/AS1G08_081T01_9000002178_14736cztM0_level2_quad_clean.evt |
| Size (bytes) | 488,148,480 | 100,249,920 |
| Size | 465.5 MB | 95.6 MB |
| Events in quadrant A | 3,888,085 | 658,131 |
| Events in quadrant B | 3,472,382 | 651,982 |
| Events in quadrant C | 3,578,541 | 638,353 |
| Events in quadrant D | 3,409,237 | 640,090 |
| Mode M0 | |||
|---|---|---|---|
| Quadrant | BADHDUFLAG | Total packets | Discarded packets |
| A | 0 | 15572 | 3 |
| B | 0 | 14440 | 2 |
| C | 0 | 14521 | 2 |
| D | 0 | 14408 | 2 |
| Mode SS | |||
|---|---|---|---|
| Quadrant | BADHDUFLAG | Total packets | Discarded packets |
| A | 0 | 130 | 0 |
| B | 0 | 130 | 0 |
| C | 0 | 130 | 0 |
| D | 0 | 130 | 0 |
| Mode M9 | |||
|---|---|---|---|
| Quadrant | BADHDUFLAG | Total packets | Discarded packets |
| A | 0 | 19 | 0 |
| B | 0 | 19 | 0 |
| C | 0 | 19 | 0 |
| D | 0 | 20 | 0 |
| Quadrant | Total seconds | Saturated seconds | Saturation percentage |
|---|---|---|---|
| A | 6416 | 201 | 3.132793% |
| B | 6416 | 131 | 2.041771% |
| C | 6416 | 98 | 1.527431% |
| D | 6416 | 89 | 1.387157% |
Noise dominated data is calculated using 1-second bins in cleaned event files. If a bin has >2000 counts, and if more than 50% of those come from <1% of pixels, then it is considered to be noise-dominated and hence unusable.
| Quadrant | # 1 sec bins | Bins with >0 counts | Bins with >2000 counts | High rate bins dominated by noise | Noise dominated (total time) | Noise dominated (detector-on time) | Marked lightcurve |
|---|---|---|---|---|---|---|---|
| A | 7622 | 6417 | 18 | 18 | 0.24% | 0.28% | 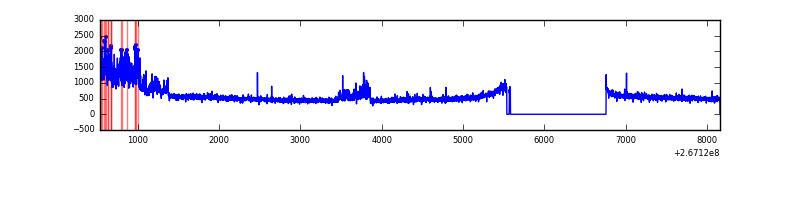 |
| B | 7622 | 6417 | 8 | 8 | 0.10% | 0.12% | 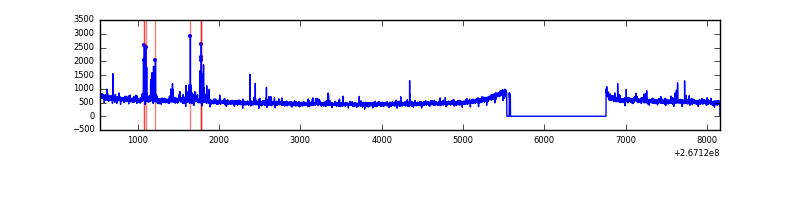 |
| C | 7622 | 6417 | 1 | 1 | 0.01% | 0.02% | 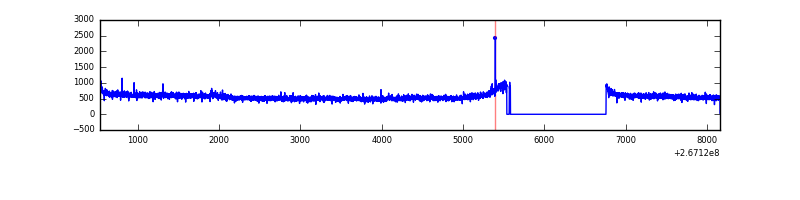 |
| D | 7622 | 6417 | 1 | 1 | 0.01% | 0.02% | 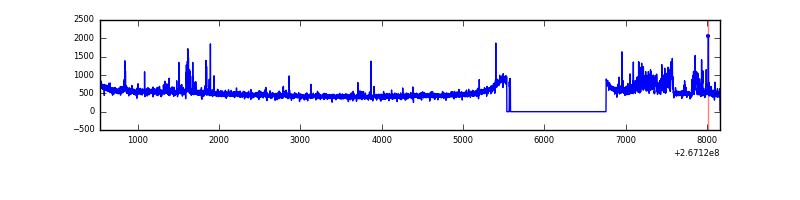 |
Top three noisy pixels from each quadrant. If the there are fewer than three noisy pixels in the level2.evt file, extra rows are filled as -1
| Pixel properties | Quadrant properties | ||||||
|---|---|---|---|---|---|---|---|
| Quadrant | DetID | PixID | Counts | Sigma | Mean | Median | Sigma |
| A | 8 | 15 | 614401 | 3647.27 | 845 | 828 | 168.2 |
| A | 12 | 189 | 16471 | 92.99 | 845 | 828 | 168.2 |
| A | 3 | 1 | 8480 | 45.49 | 845 | 828 | 168.2 |
| B | 0 | 197 | 93504 | 580.58 | 841 | 822 | 159.6 |
| B | 0 | 229 | 30453 | 185.61 | 841 | 822 | 159.6 |
| B | 0 | 205 | 25122 | 152.22 | 841 | 822 | 159.6 |
| C | 3 | 233 | 322549 | 1693.57 | 830 | 836 | 190.0 |
| C | 14 | 220 | 9681 | 46.56 | 830 | 836 | 190.0 |
| C | 6 | 96 | 8006 | 37.74 | 830 | 836 | 190.0 |
| D | 12 | 16 | 197523 | 982.25 | 833 | 814 | 200.3 |
| D | 13 | 172 | 46099 | 226.13 | 833 | 814 | 200.3 |
| D | 2 | 234 | 21085 | 101.22 | 833 | 814 | 200.3 |
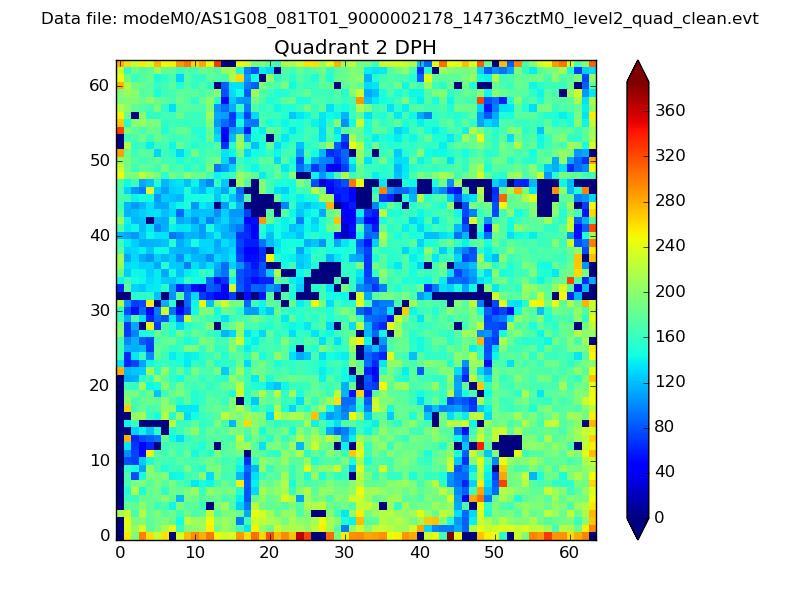
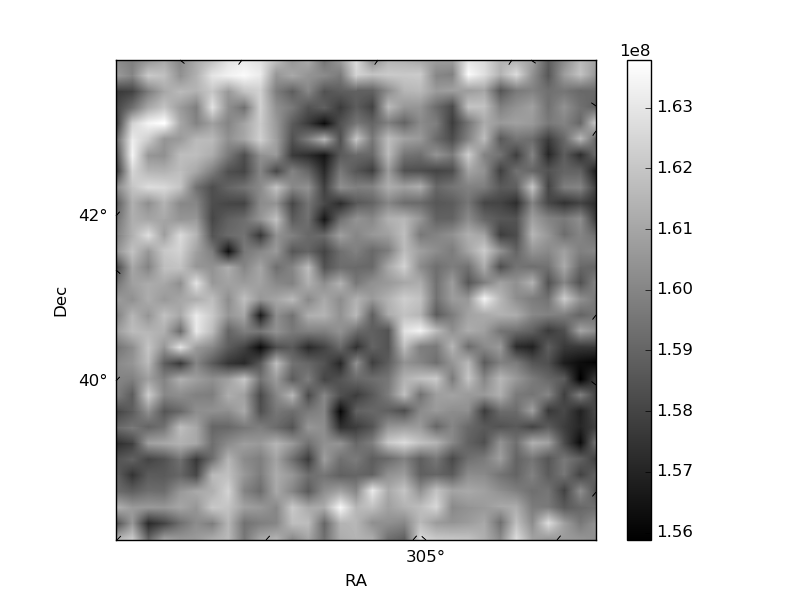
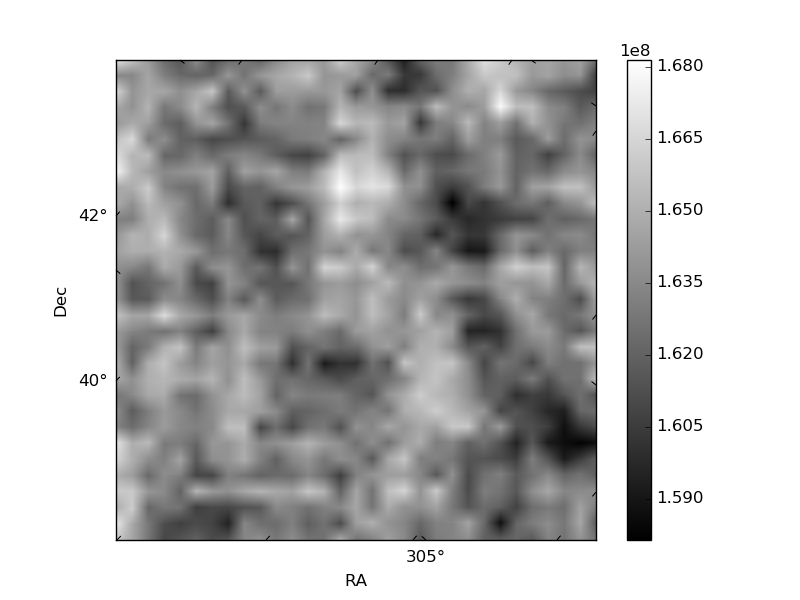
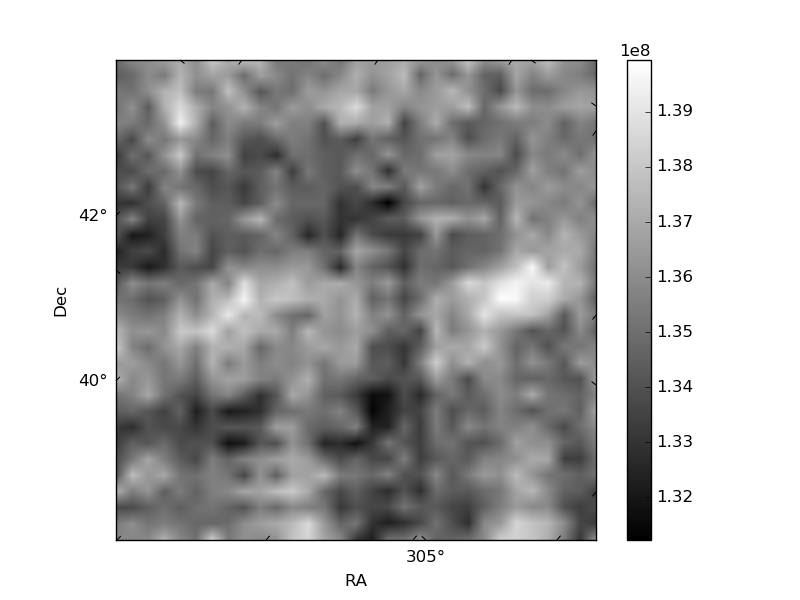
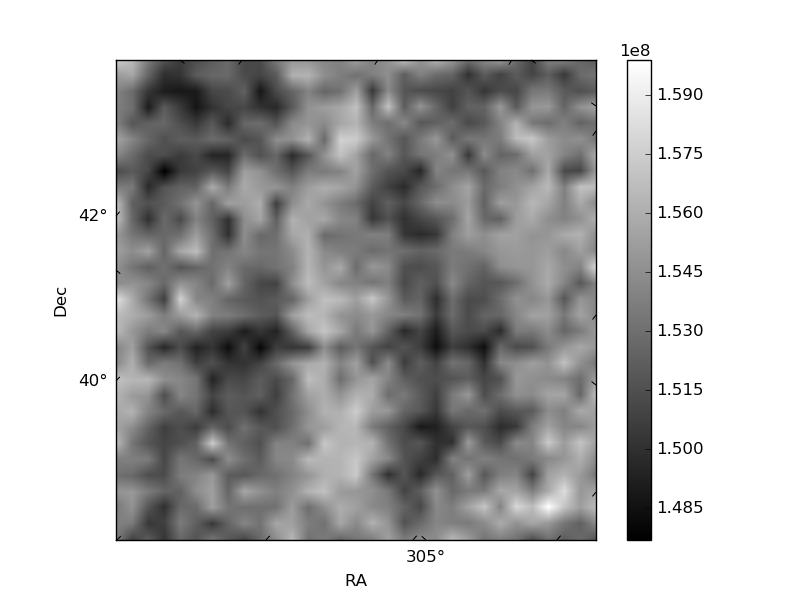
Histogram calculated using DETX and DETY for each event in the final _common_clean file
| Quadrant A | 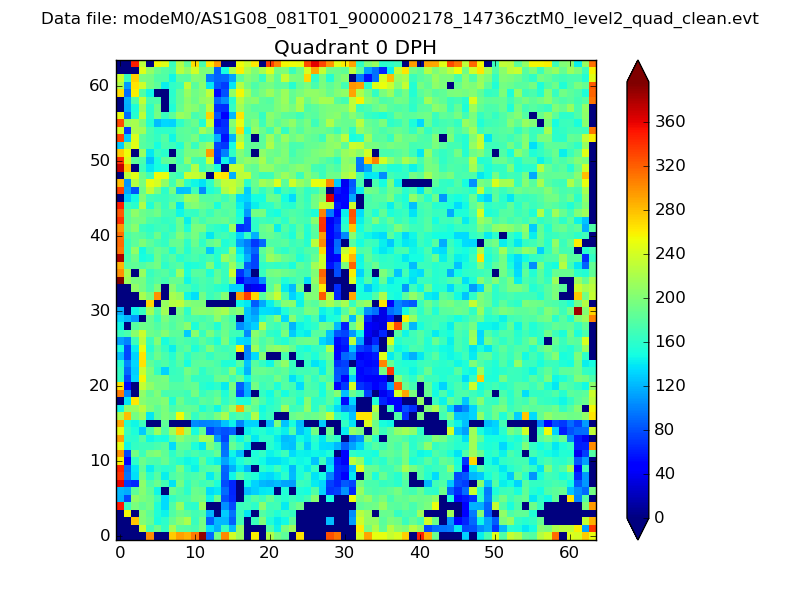 |
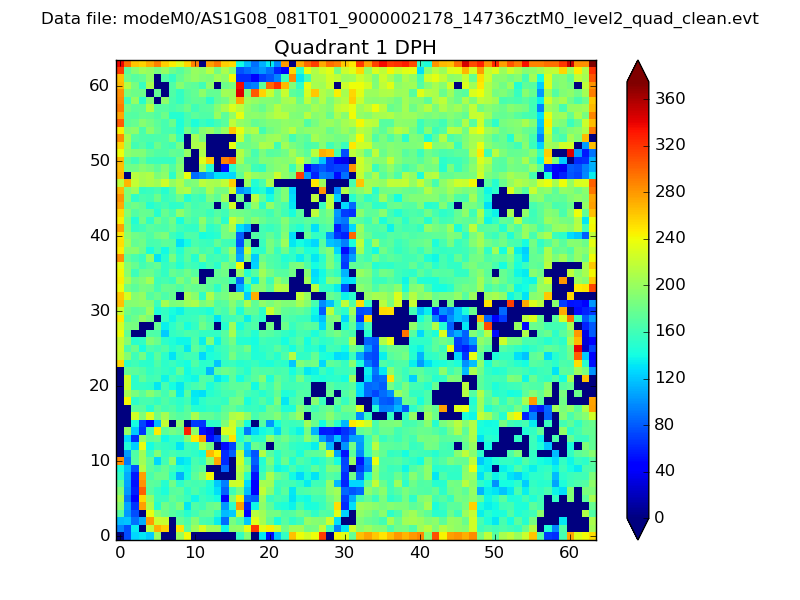 |
Quadrant B |
|---|---|---|---|
| Quadrant D | 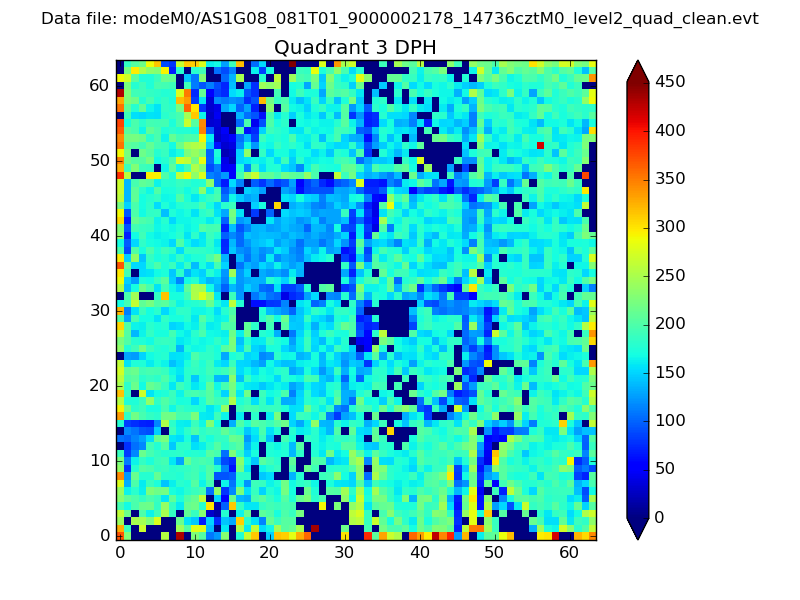 |
 |
Quadrant C |
| Plot type | Count rate plots | Images |
|---|---|---|
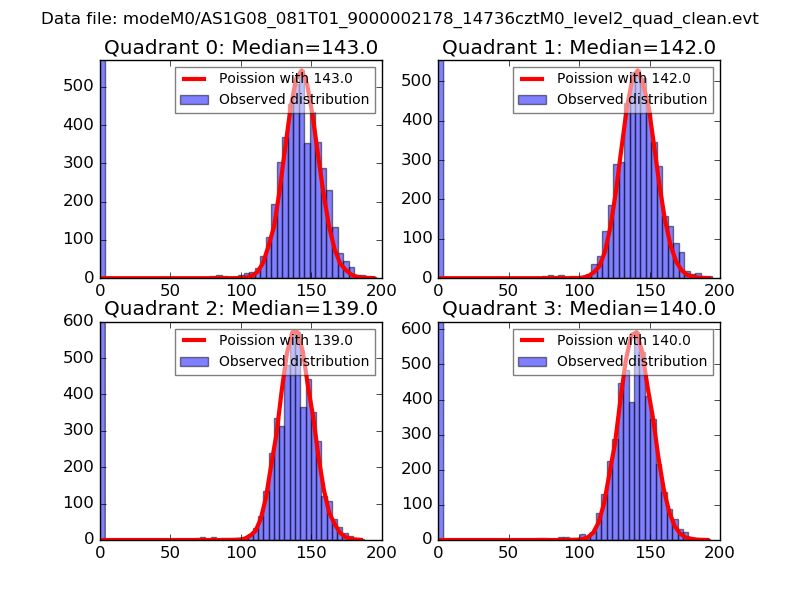
| Comparison with Poisson distribution Blue bars denote a histogram of data divided into 1 sec bins. Red curve is a Poisson curve with rate = median count rate of data. |
 |
 |
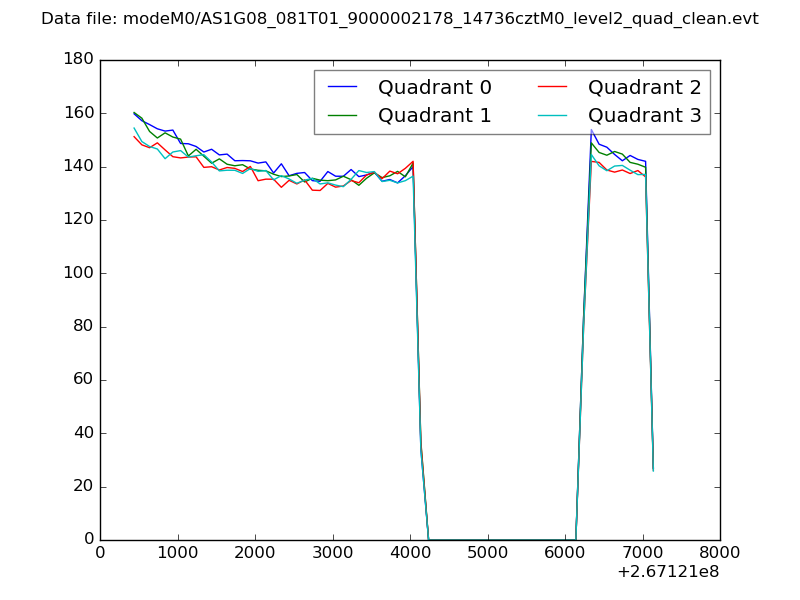
| Quadrant-wise count rates Data is divided into 100 sec bins |
 |
|
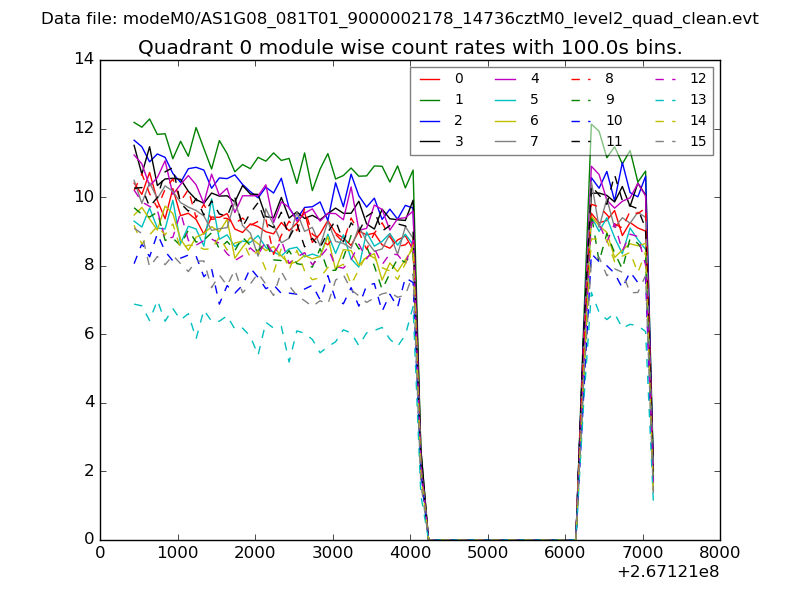
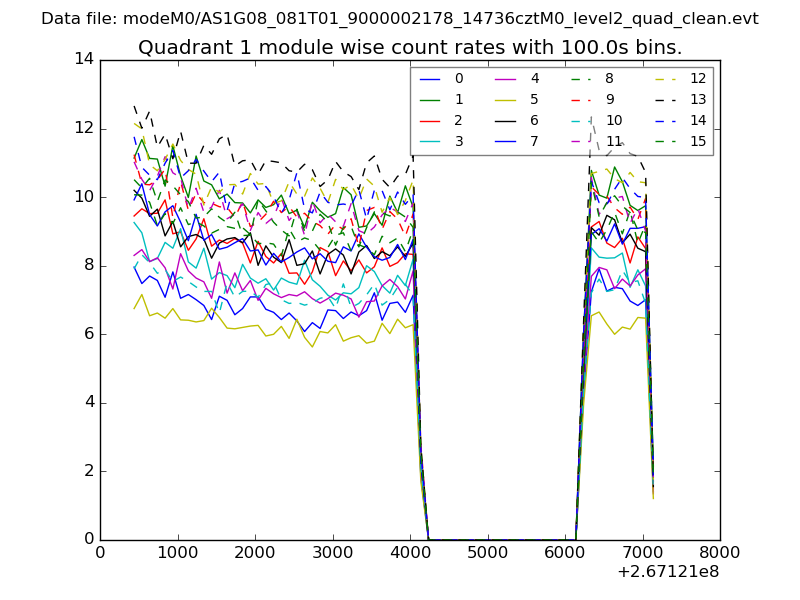
| Module-wise count rates for Quadrant A Data is divided into 100 sec bins |
 |
 |
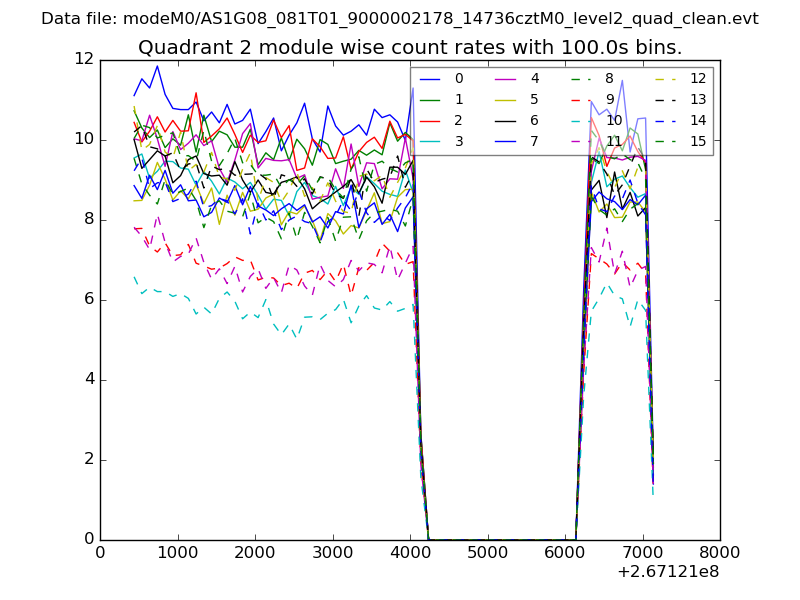
| Module-wise count rates for Quadrant B Data is divided into 100 sec bins |
 |
 |
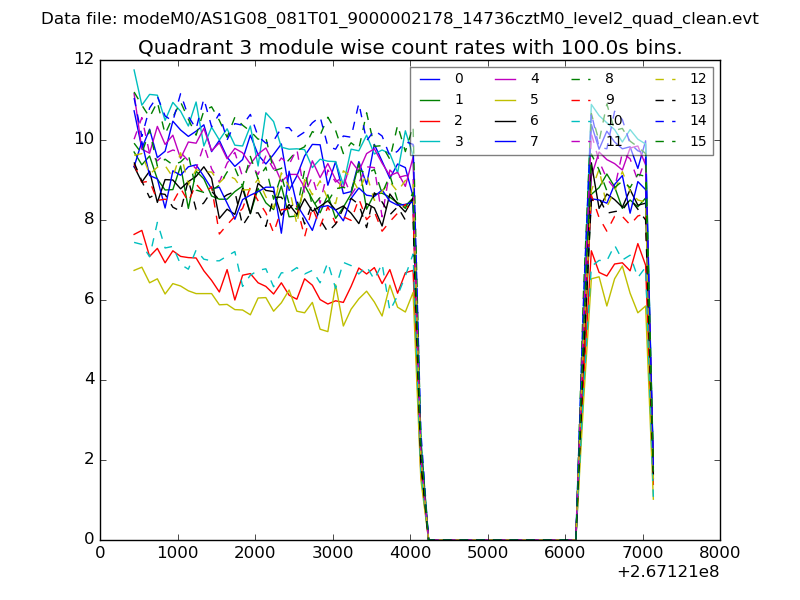
| Module-wise count rates for Quadrant C Data is divided into 100 sec bins |
 |
 |
| Module-wise count rates for Quadrant D Data is divided into 100 sec bins |
 |
 |
| Parameter | Plot |
|---|---|
| CZT HV Monitor | 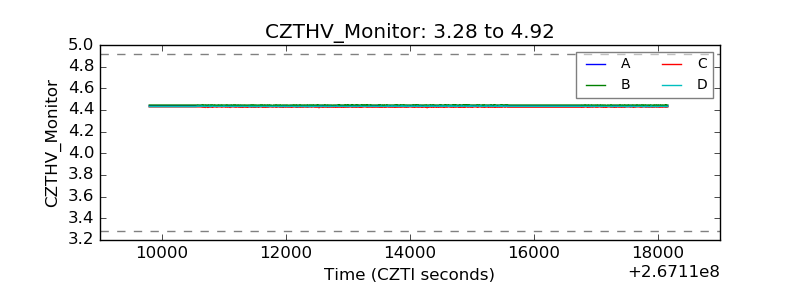 |
| D_VDD | 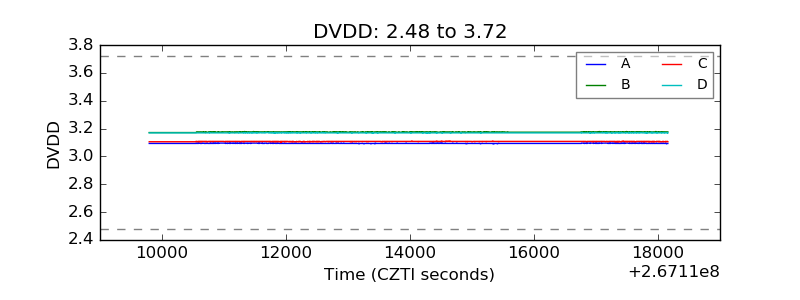 |
| Temperature 1 | 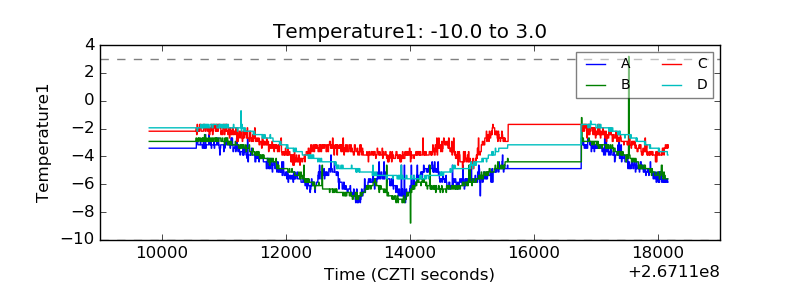 |
| Veto HV Monitor | 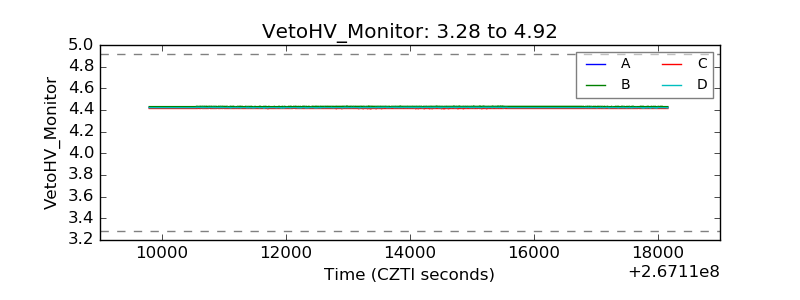 |
| Veto LLD | 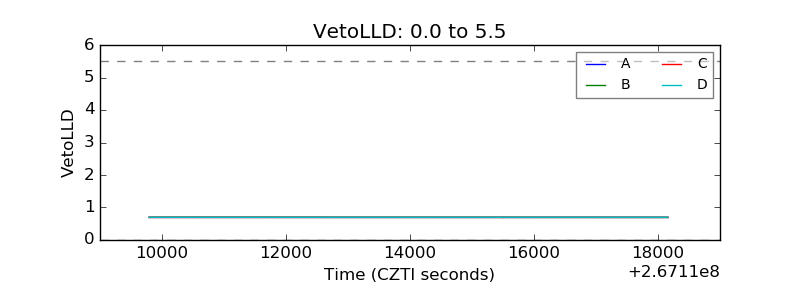 |
| Alpha Counter | 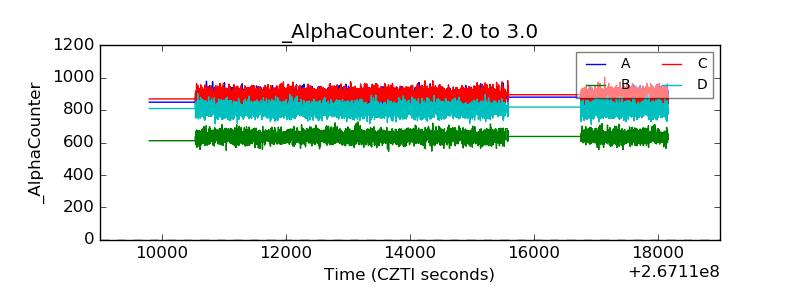 |
| _CPM_Rate | 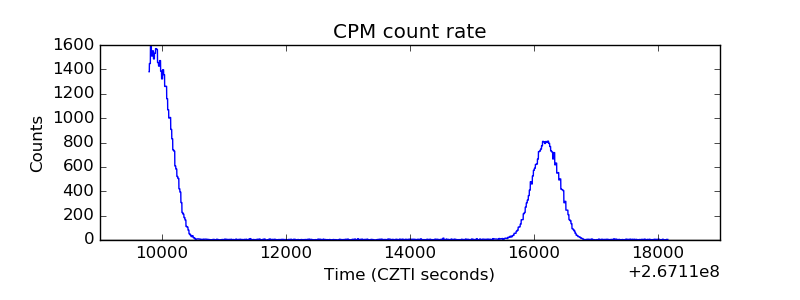 |
| CZT Counter |  |
| +2.5 Volts monitor |  |
| +5 Volts monitor |  |
| _ROLL_ROT | 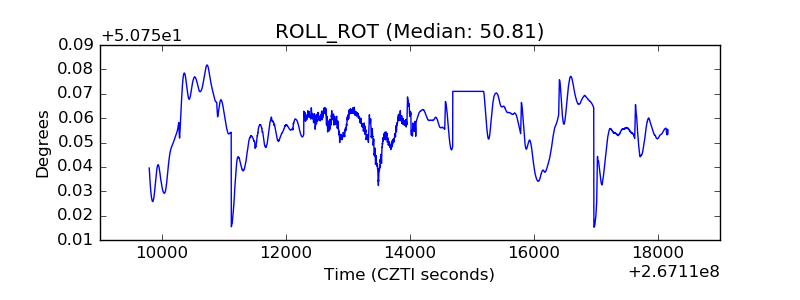 |
| _Roll_DEC | 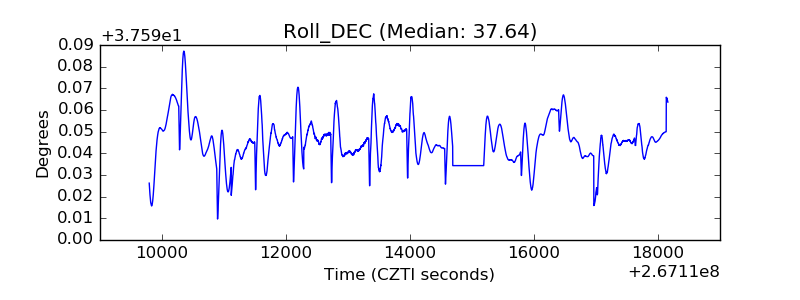 |
| _Roll_RA |  |
| Veto Counter | 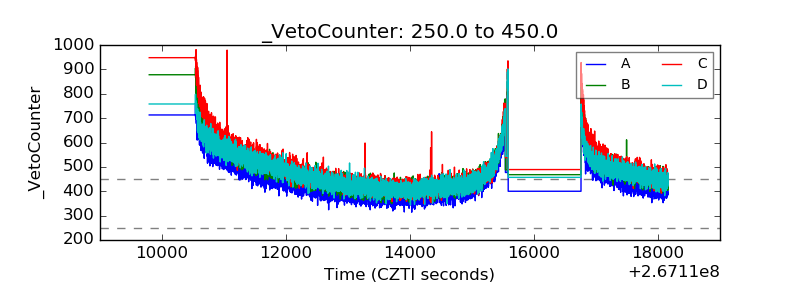 |