| Param | Original file | Final file |
|---|---|---|
| Filename | modeM0/AS1G08_081T01_9000002178_14738cztM0_level2.evt | modeM0/AS1G08_081T01_9000002178_14738cztM0_level2_quad_clean.evt |
| Size (bytes) | 596,079,360 | 105,641,280 |
| Size | 568.5 MB | 100.7 MB |
| Events in quadrant A | 5,029,128 | 664,774 |
| Events in quadrant B | 4,227,600 | 664,422 |
| Events in quadrant C | 4,426,220 | 650,128 |
| Events in quadrant D | 3,815,347 | 652,156 |
| Mode M0 | |||
|---|---|---|---|
| Quadrant | BADHDUFLAG | Total packets | Discarded packets |
| A | 0 | 20504 | 3 |
| B | 0 | 17909 | 2 |
| C | 0 | 18096 | 2 |
| D | 0 | 16974 | 2 |
| Mode SS | |||
|---|---|---|---|
| Quadrant | BADHDUFLAG | Total packets | Discarded packets |
| A | 0 | 168 | 0 |
| B | 0 | 168 | 0 |
| C | 0 | 168 | 0 |
| D | 0 | 168 | 0 |
| Mode M9 | |||
|---|---|---|---|
| Quadrant | BADHDUFLAG | Total packets | Discarded packets |
| A | 0 | 14 | 0 |
| B | 0 | 14 | 0 |
| C | 0 | 14 | 0 |
| D | 0 | 14 | 0 |
| Quadrant | Total seconds | Saturated seconds | Saturation percentage |
|---|---|---|---|
| A | 8168 | 174 | 2.130264% |
| B | 8168 | 148 | 1.811949% |
| C | 8168 | 77 | 0.942703% |
| D | 8168 | 41 | 0.501959% |
Noise dominated data is calculated using 1-second bins in cleaned event files. If a bin has >2000 counts, and if more than 50% of those come from <1% of pixels, then it is considered to be noise-dominated and hence unusable.
| Quadrant | # 1 sec bins | Bins with >0 counts | Bins with >2000 counts | High rate bins dominated by noise | Noise dominated (total time) | Noise dominated (detector-on time) | Marked lightcurve |
|---|---|---|---|---|---|---|---|
| A | 9594 | 8170 | 36 | 36 | 0.38% | 0.44% | 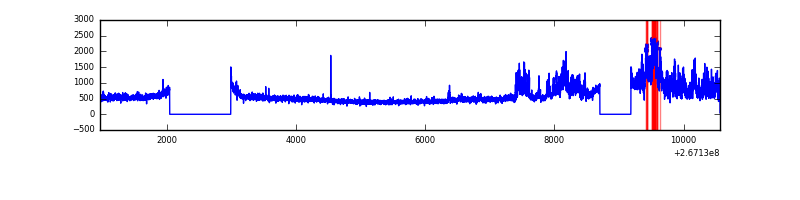 |
| B | 9594 | 8170 | 15 | 15 | 0.16% | 0.18% | 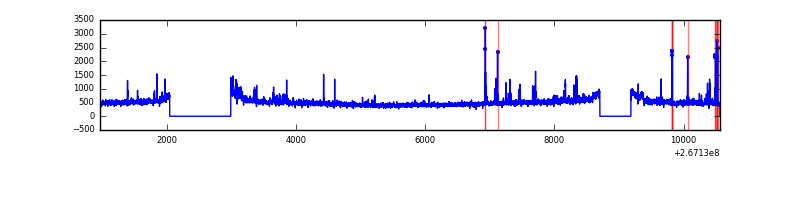 |
| C | 9594 | 8170 | 3 | 3 | 0.03% | 0.04% | 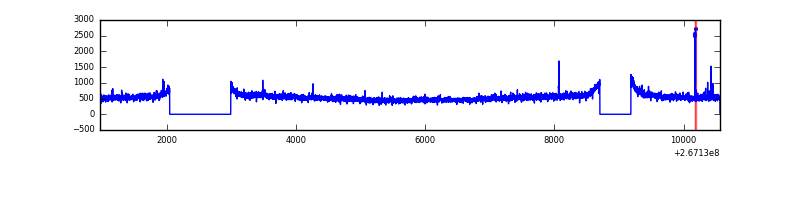 |
| D | 9594 | 8170 | 6 | 6 | 0.06% | 0.07% | 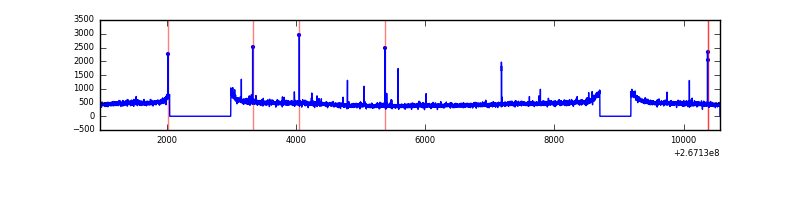 |
Top three noisy pixels from each quadrant. If the there are fewer than three noisy pixels in the level2.evt file, extra rows are filled as -1
| Pixel properties | Quadrant properties | ||||||
|---|---|---|---|---|---|---|---|
| Quadrant | DetID | PixID | Counts | Sigma | Mean | Median | Sigma |
| A | 8 | 15 | 1109405 | 5384.0 | 1012 | 990 | 205.9 |
| A | 12 | 189 | 23312 | 108.43 | 1012 | 990 | 205.9 |
| A | 0 | 226 | 8848 | 38.17 | 1012 | 990 | 205.9 |
| B | 0 | 189 | 129192 | 660.46 | 1009 | 984 | 194.1 |
| B | 10 | 16 | 85730 | 436.57 | 1009 | 984 | 194.1 |
| B | 0 | 229 | 27636 | 137.3 | 1009 | 984 | 194.1 |
| C | 3 | 233 | 538226 | 2356.69 | 985 | 990 | 228.0 |
| C | 6 | 96 | 28605 | 121.14 | 985 | 990 | 228.0 |
| C | 0 | 207 | 8551 | 33.17 | 985 | 990 | 228.0 |
| D | 2 | 234 | 29311 | 120.23 | 986 | 962 | 235.8 |
| D | 12 | 16 | 22698 | 92.19 | 986 | 962 | 235.8 |
| D | 2 | 120 | 19834 | 80.04 | 986 | 962 | 235.8 |
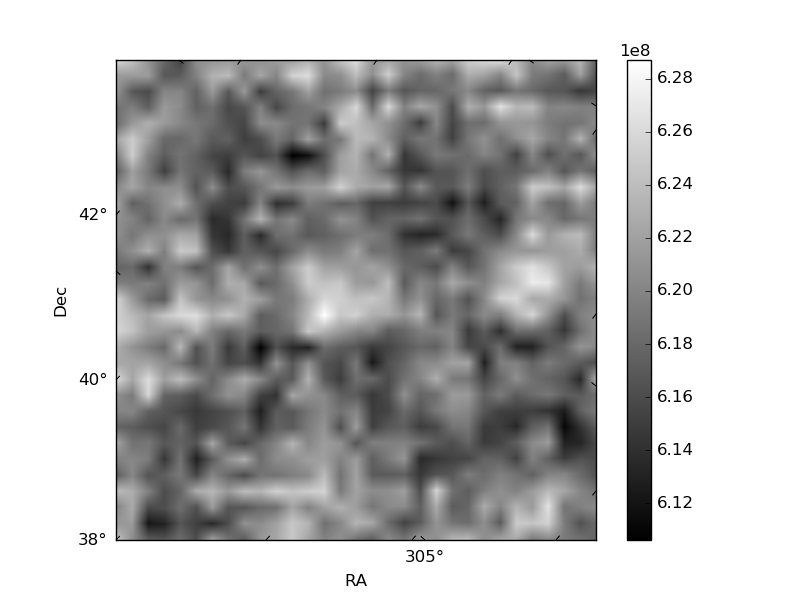
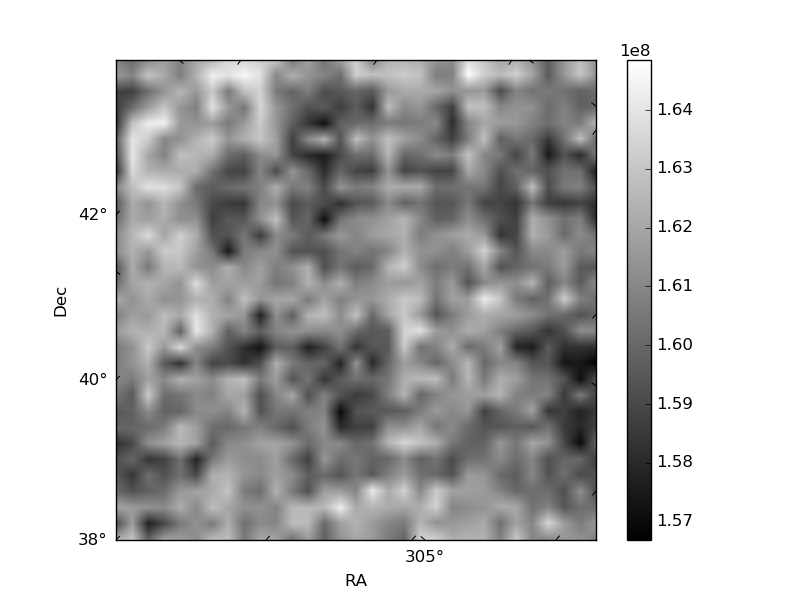
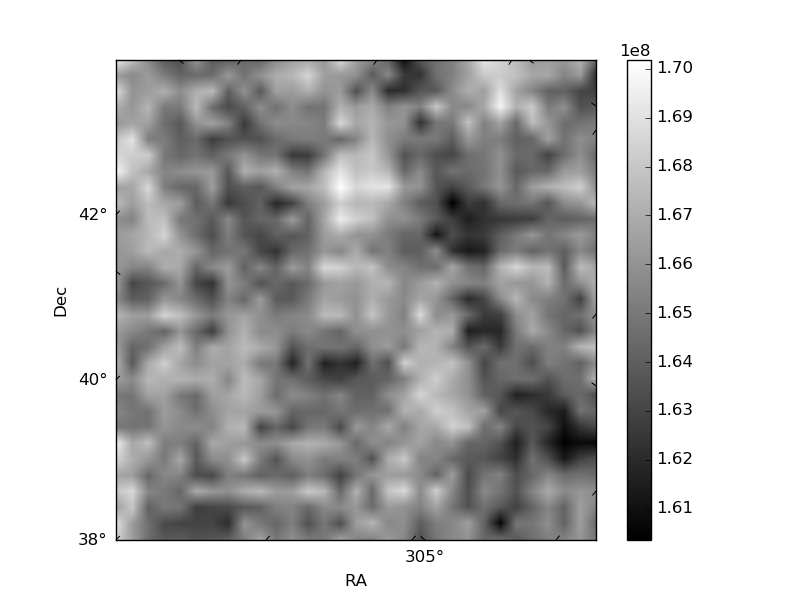
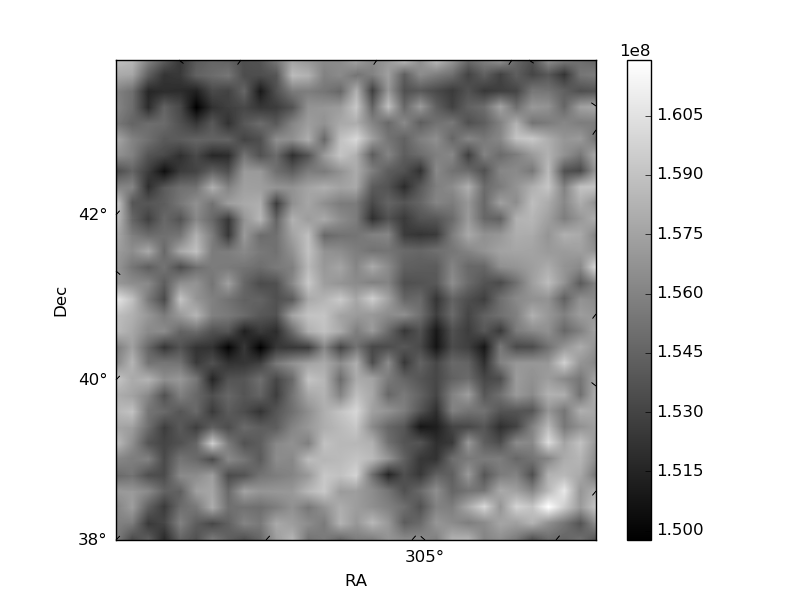
Histogram calculated using DETX and DETY for each event in the final _common_clean file
| Quadrant A | 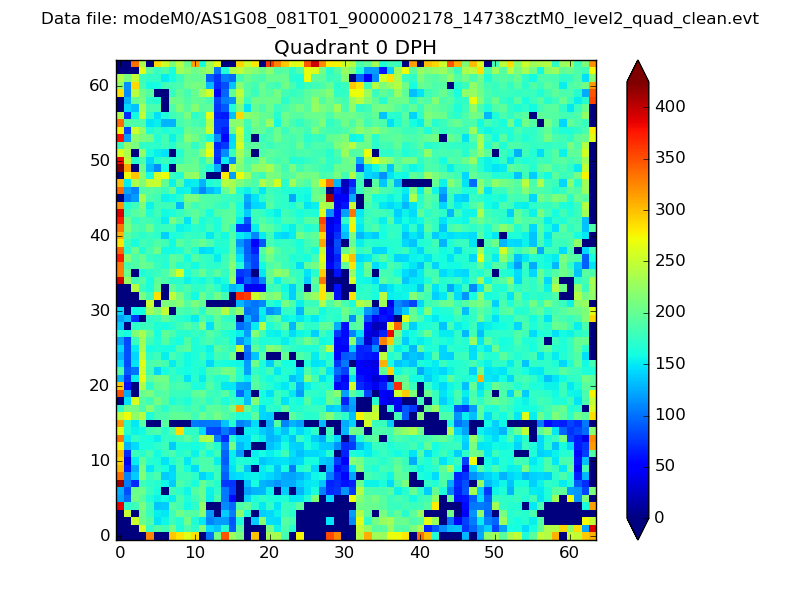 |
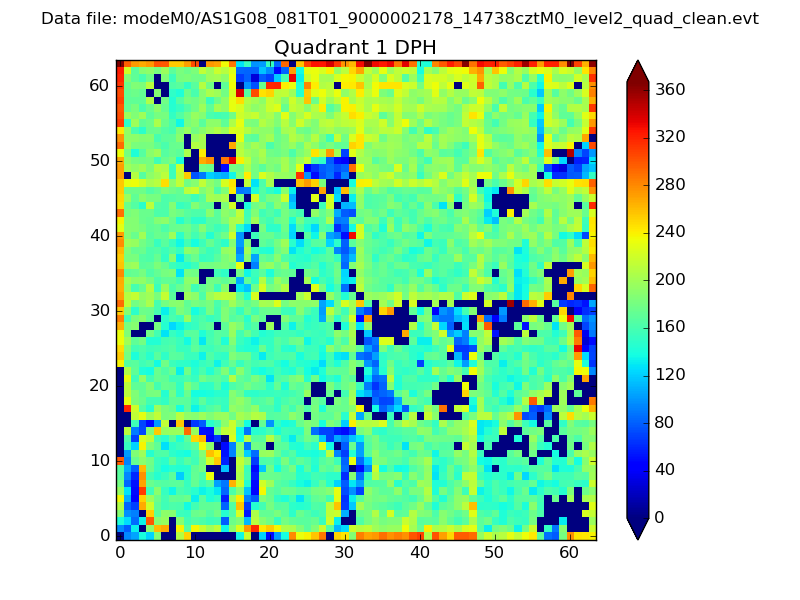 |
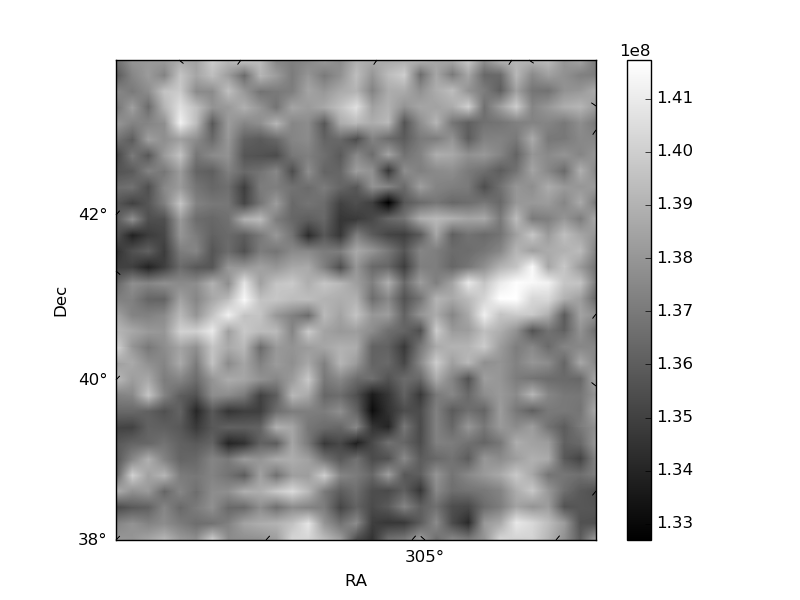
Quadrant B |
|---|---|---|---|
| Quadrant D | 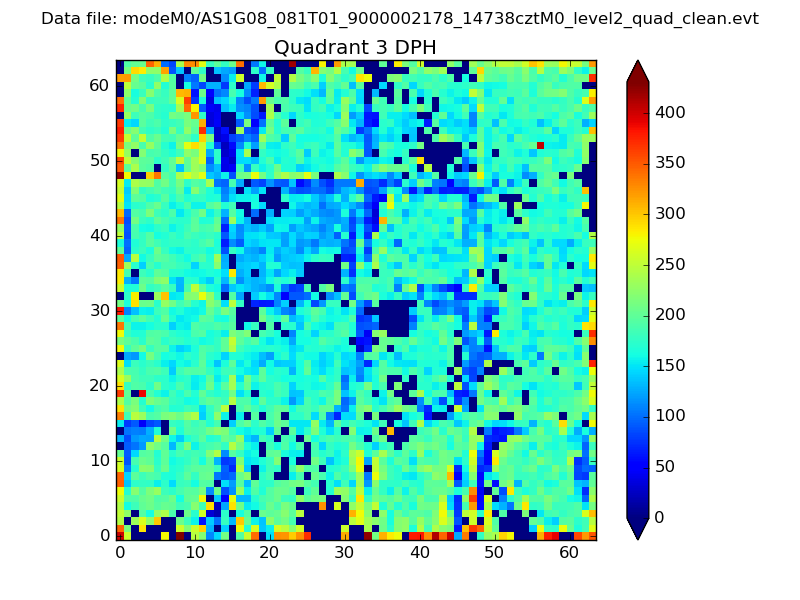 |
 |
Quadrant C |
| Plot type | Count rate plots | Images |
|---|---|---|
| Comparison with Poisson distribution Blue bars denote a histogram of data divided into 1 sec bins. Red curve is a Poisson curve with rate = median count rate of data. |
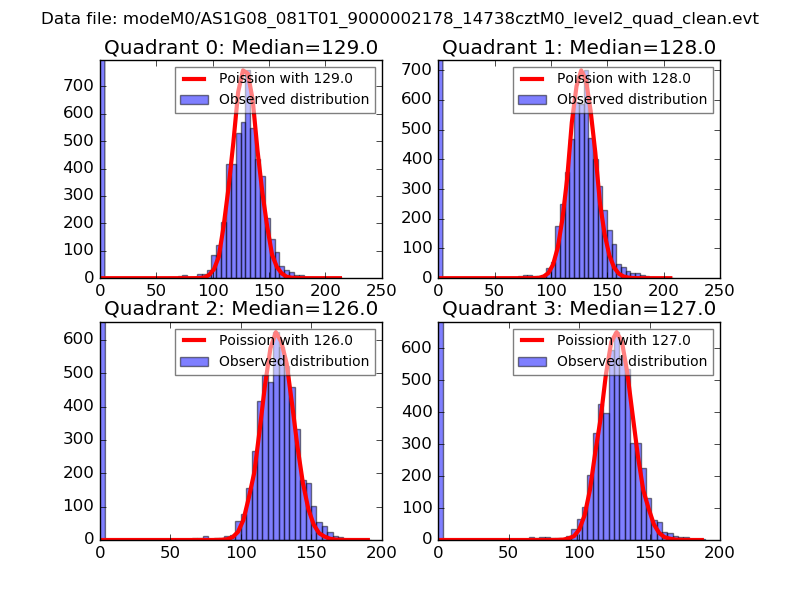 |
 |
| Quadrant-wise count rates Data is divided into 100 sec bins |
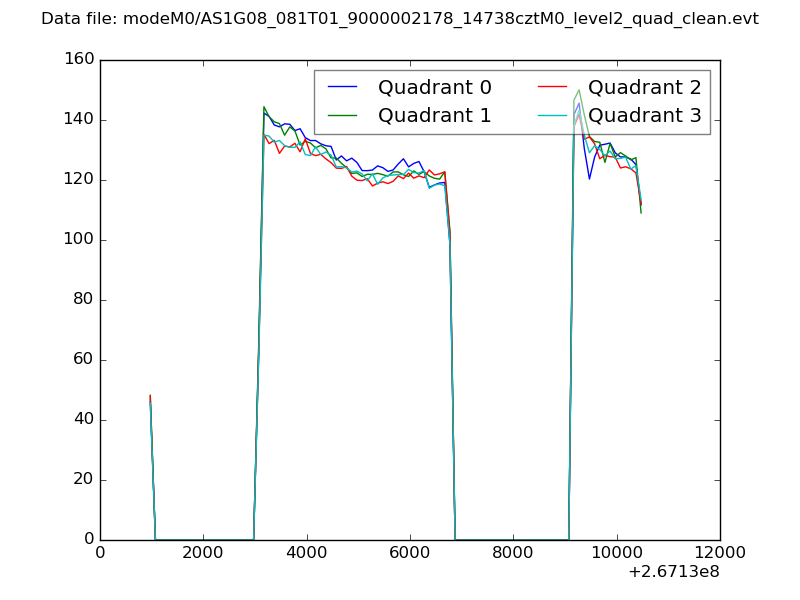 |
|
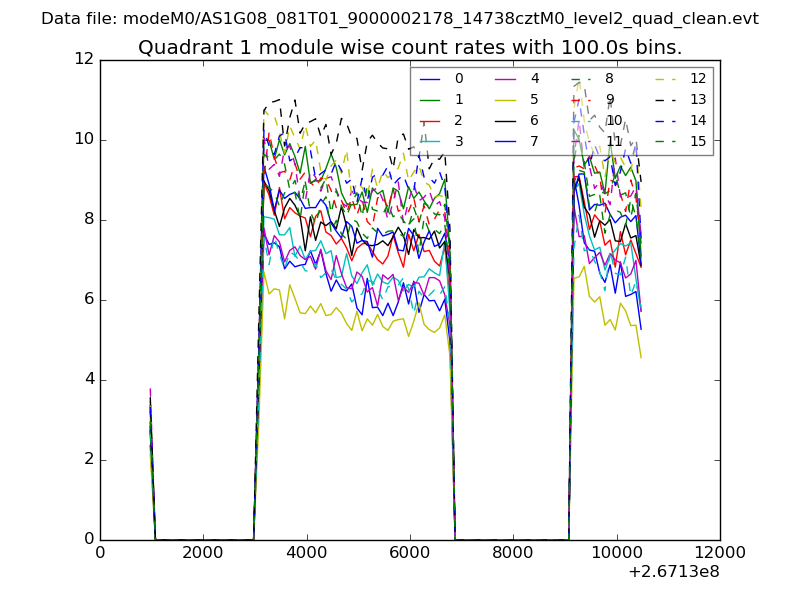
| Module-wise count rates for Quadrant A Data is divided into 100 sec bins |
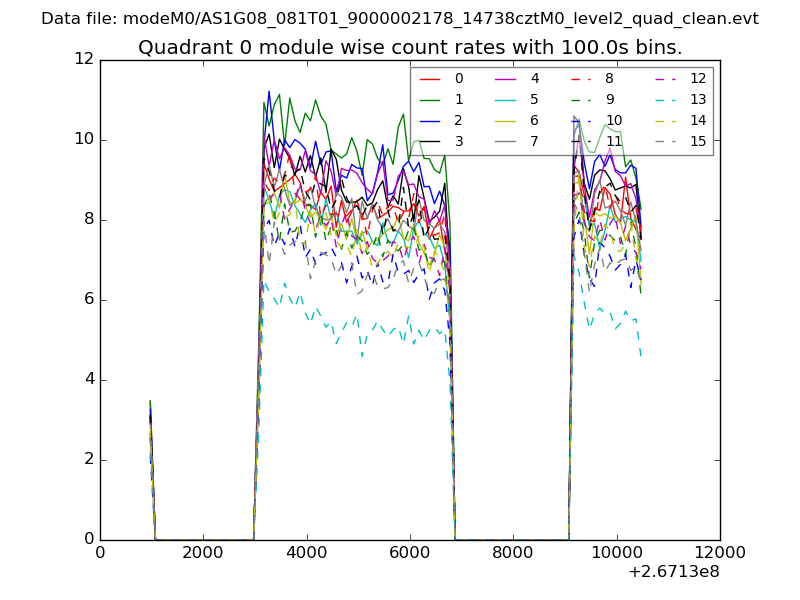 |
 |
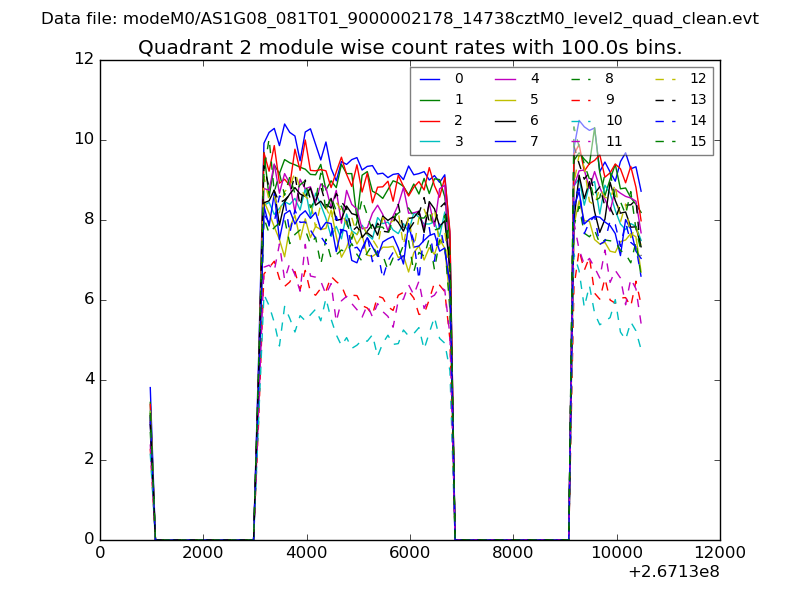
| Module-wise count rates for Quadrant B Data is divided into 100 sec bins |
 |
 |
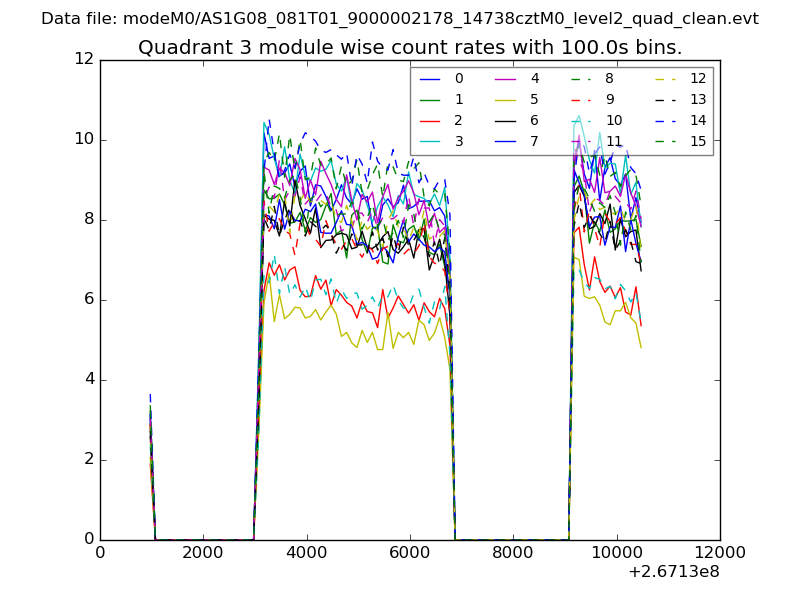
| Module-wise count rates for Quadrant C Data is divided into 100 sec bins |
 |
 |
| Module-wise count rates for Quadrant D Data is divided into 100 sec bins |
 |
 |
| Parameter | Plot |
|---|---|
| CZT HV Monitor | 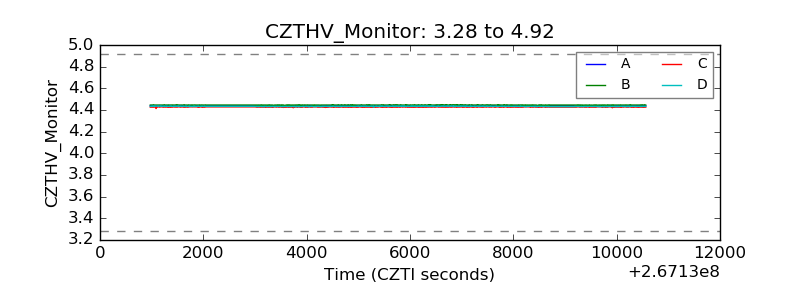 |
| D_VDD | 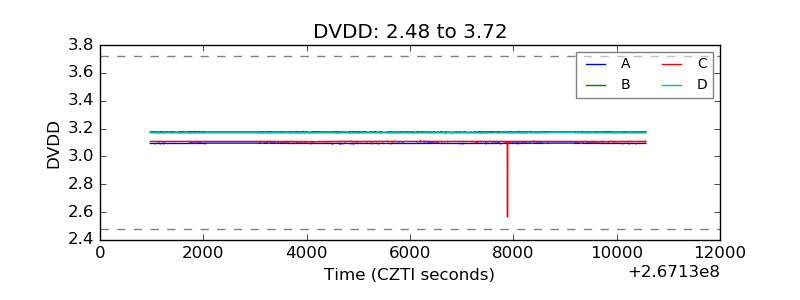 |
| Temperature 1 | 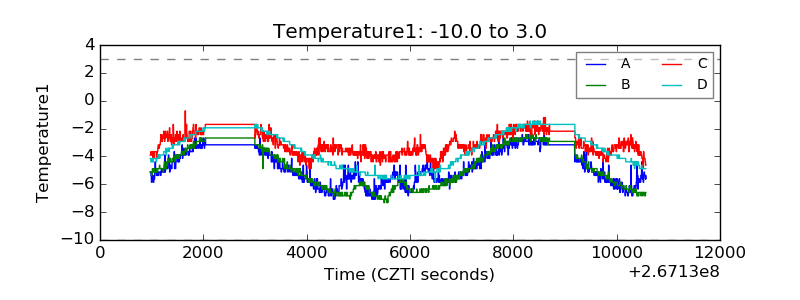 |
| Veto HV Monitor | 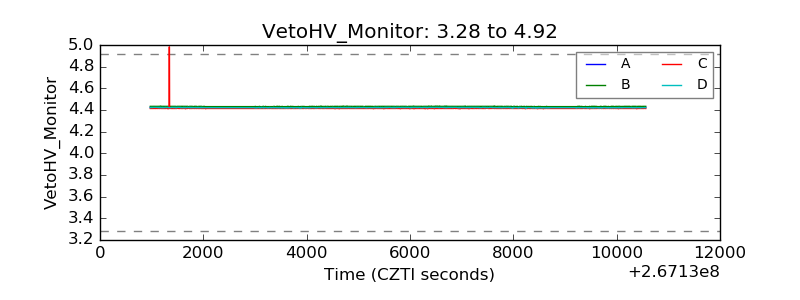 |
| Veto LLD | 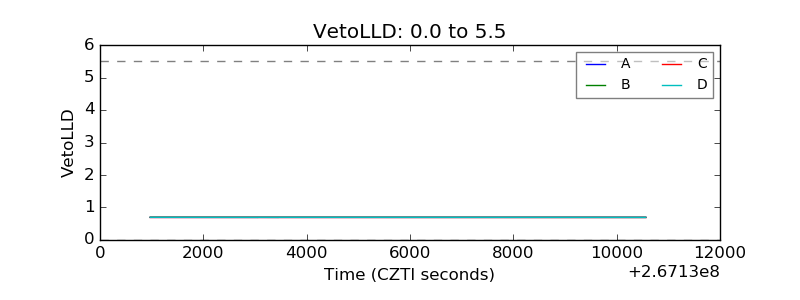 |
| Alpha Counter | 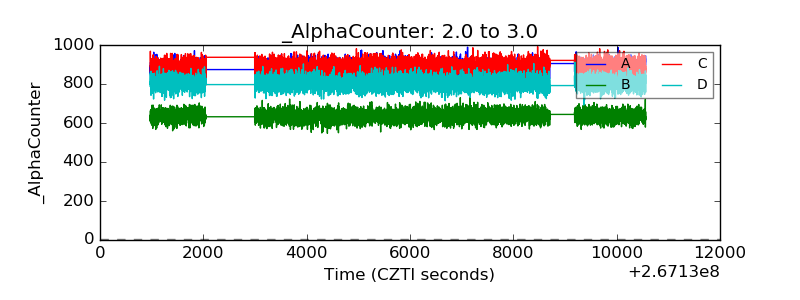 |
| _CPM_Rate | 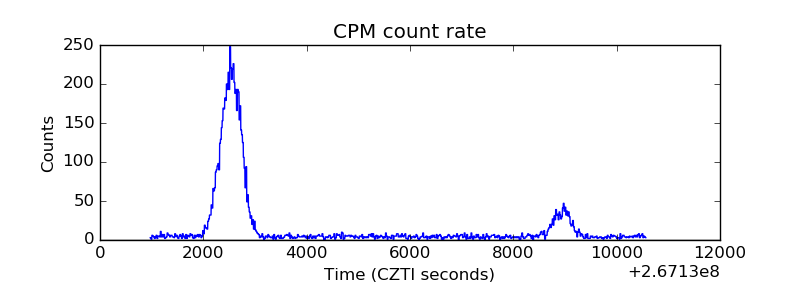 |
| CZT Counter | 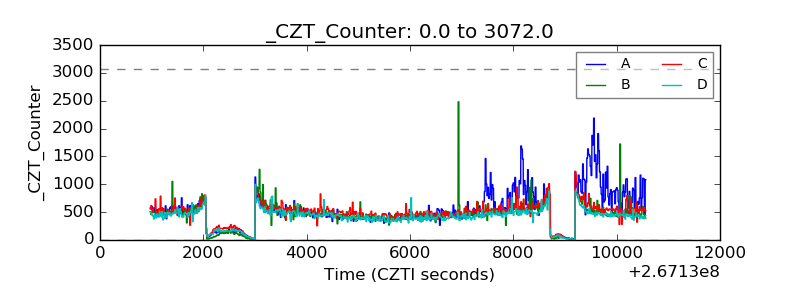 |
| +2.5 Volts monitor |  |
| +5 Volts monitor |  |
| _ROLL_ROT |  |
| _Roll_DEC | 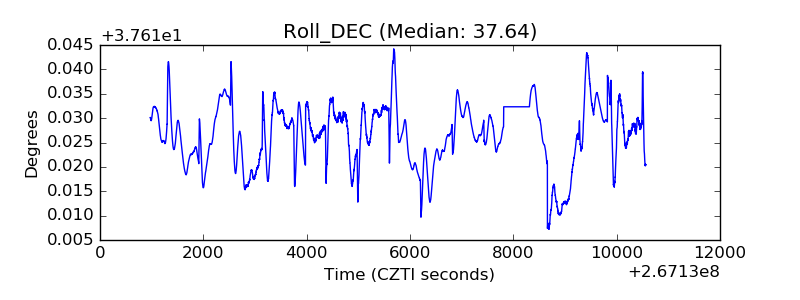 |
| _Roll_RA | 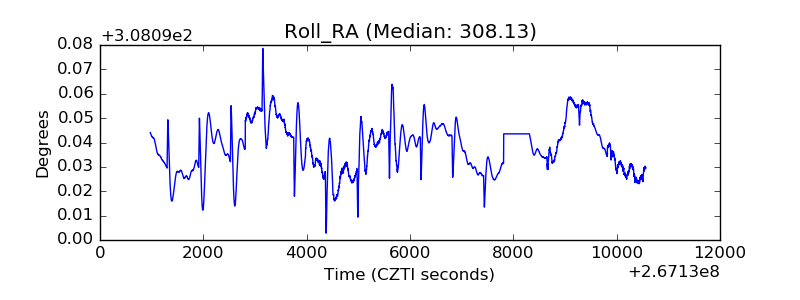 |
| Veto Counter | 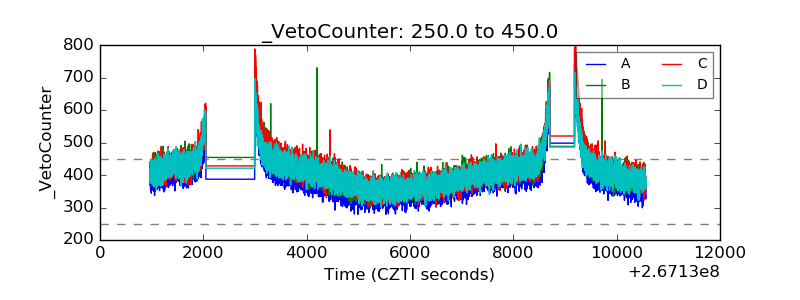 |