| Param | Original file | Final file |
|---|---|---|
| Filename | modeM0/AS1G08_081T01_9000002178_14740cztM0_level2.evt | modeM0/AS1G08_081T01_9000002178_14740cztM0_level2_quad_clean.evt |
| Size (bytes) | 709,228,800 | 110,975,040 |
| Size | 676.4 MB | 105.8 MB |
| Events in quadrant A | 8,482,656 | 679,418 |
| Events in quadrant B | 4,198,050 | 714,386 |
| Events in quadrant C | 4,440,142 | 699,816 |
| Events in quadrant D | 3,811,201 | 704,663 |
| Mode M0 | |||
|---|---|---|---|
| Quadrant | BADHDUFLAG | Total packets | Discarded packets |
| A | 0 | 30891 | 2 |
| B | 0 | 17935 | 2 |
| C | 0 | 18277 | 2 |
| D | 0 | 17081 | 2 |
| Mode SS | |||
|---|---|---|---|
| Quadrant | BADHDUFLAG | Total packets | Discarded packets |
| A | 0 | 168 | 0 |
| B | 0 | 168 | 0 |
| C | 0 | 168 | 0 |
| D | 0 | 168 | 0 |
| Mode M9 | |||
|---|---|---|---|
| Quadrant | BADHDUFLAG | Total packets | Discarded packets |
| A | 0 | 5 | 0 |
| B | 0 | 5 | 0 |
| C | 0 | 5 | 0 |
| D | 0 | 5 | 0 |
| Quadrant | Total seconds | Saturated seconds | Saturation percentage |
|---|---|---|---|
| A | 8083 | 820 | 10.144748% |
| B | 8083 | 200 | 2.474329% |
| C | 8083 | 93 | 1.150563% |
| D | 8083 | 52 | 0.643325% |
Noise dominated data is calculated using 1-second bins in cleaned event files. If a bin has >2000 counts, and if more than 50% of those come from <1% of pixels, then it is considered to be noise-dominated and hence unusable.
| Quadrant | # 1 sec bins | Bins with >0 counts | Bins with >2000 counts | High rate bins dominated by noise | Noise dominated (total time) | Noise dominated (detector-on time) | Marked lightcurve |
|---|---|---|---|---|---|---|---|
| A | 8709 | 8085 | 528 | 528 | 6.06% | 6.53% | 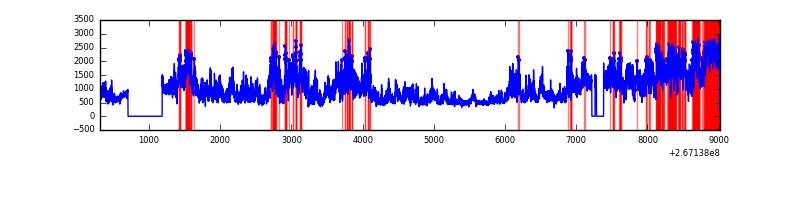 |
| B | 8709 | 8087 | 18 | 18 | 0.21% | 0.22% | 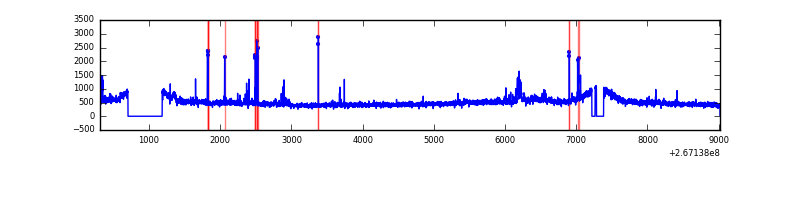 |
| C | 8709 | 8087 | 3 | 3 | 0.03% | 0.04% | 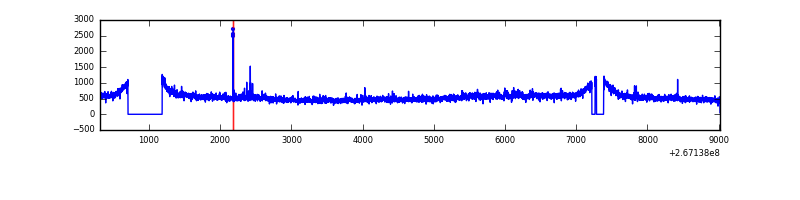 |
| D | 8709 | 8086 | 5 | 5 | 0.06% | 0.06% | 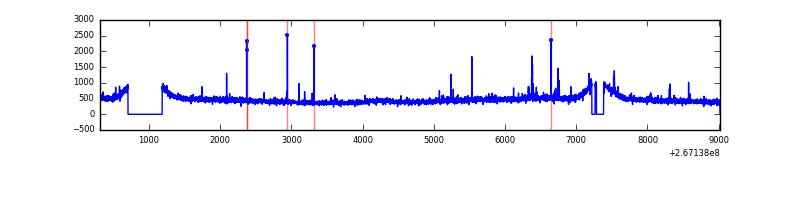 |
Top three noisy pixels from each quadrant. If the there are fewer than three noisy pixels in the level2.evt file, extra rows are filled as -1
| Pixel properties | Quadrant properties | ||||||
|---|---|---|---|---|---|---|---|
| Quadrant | DetID | PixID | Counts | Sigma | Mean | Median | Sigma |
| A | 8 | 15 | 4660850 | 23262.5 | 985 | 962 | 200.3 |
| A | 12 | 189 | 22786 | 108.95 | 985 | 962 | 200.3 |
| A | 0 | 226 | 8802 | 39.14 | 985 | 962 | 200.3 |
| B | 0 | 189 | 77139 | 394.92 | 1003 | 977 | 192.9 |
| B | 10 | 16 | 73494 | 376.02 | 1003 | 977 | 192.9 |
| B | 0 | 205 | 38512 | 194.63 | 1003 | 977 | 192.9 |
| C | 3 | 233 | 573750 | 2498.46 | 982 | 989 | 229.2 |
| C | 6 | 96 | 30458 | 128.55 | 982 | 989 | 229.2 |
| C | 13 | 61 | 7050 | 26.44 | 982 | 989 | 229.2 |
| D | 2 | 234 | 36696 | 149.27 | 981 | 957 | 239.4 |
| D | 2 | 14 | 34897 | 141.76 | 981 | 957 | 239.4 |
| D | 13 | 172 | 16077 | 63.15 | 981 | 957 | 239.4 |
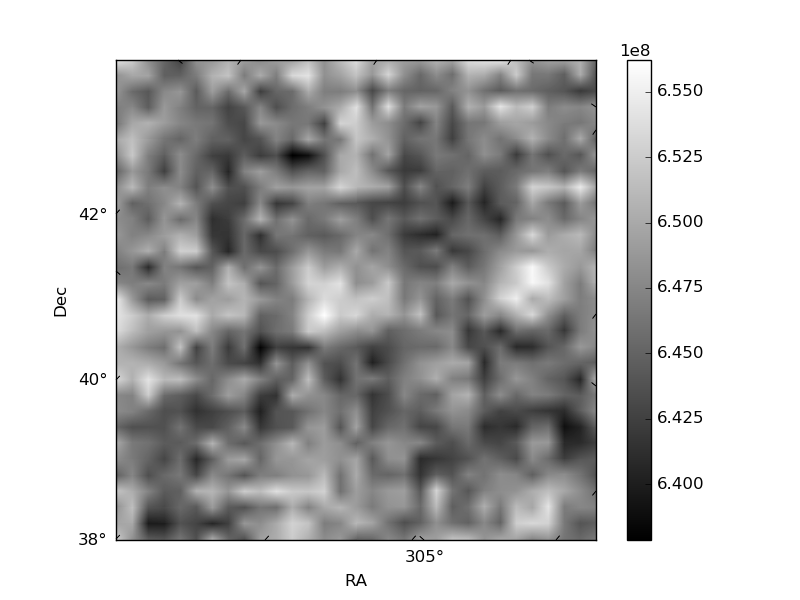
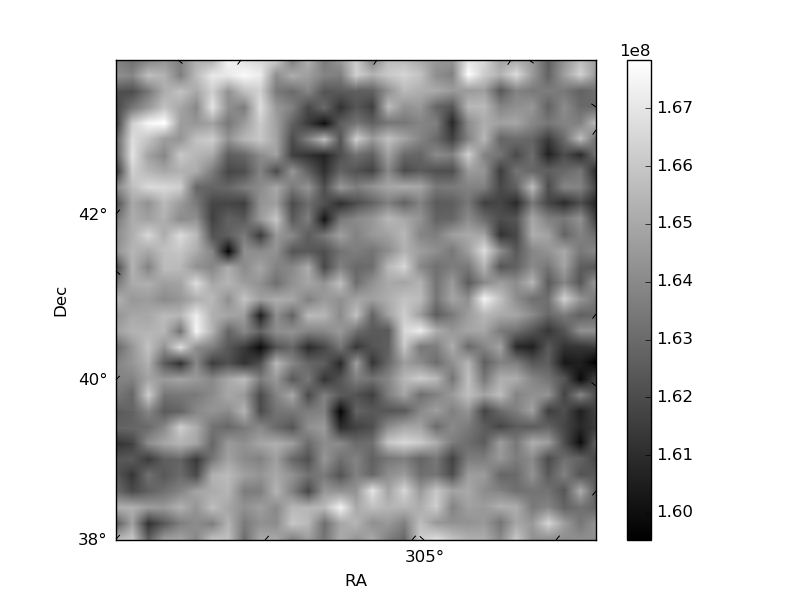
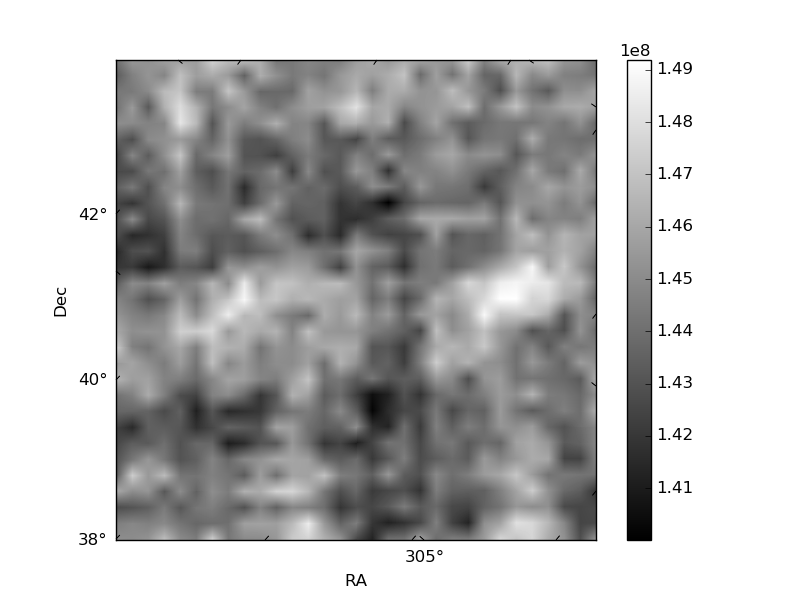
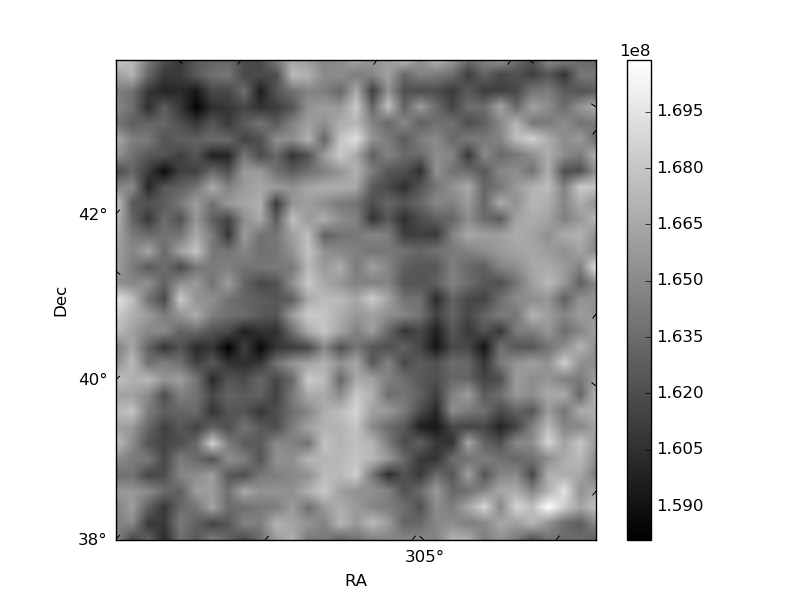
Histogram calculated using DETX and DETY for each event in the final _common_clean file
| Quadrant A | 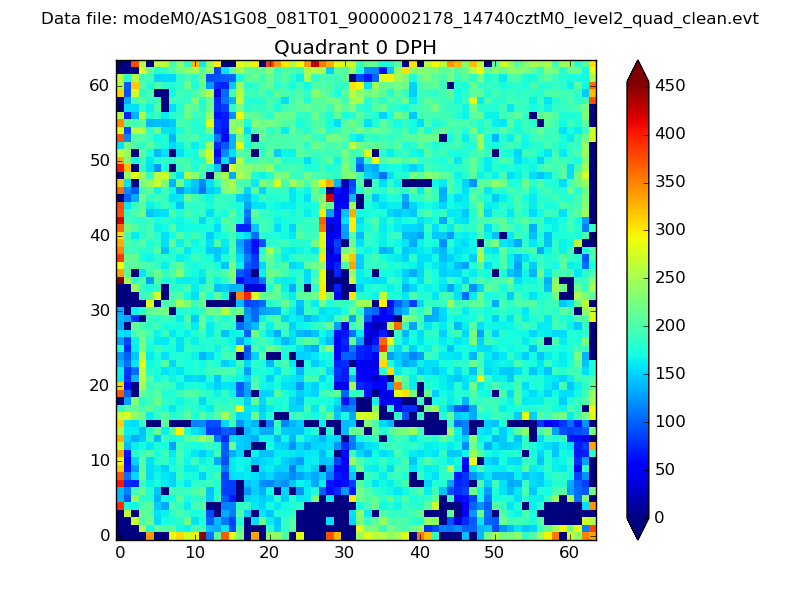 |
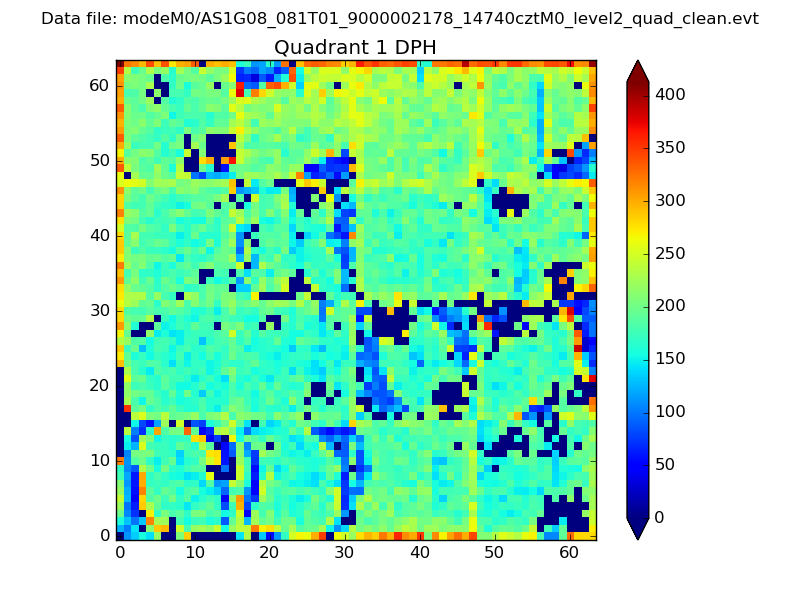 |
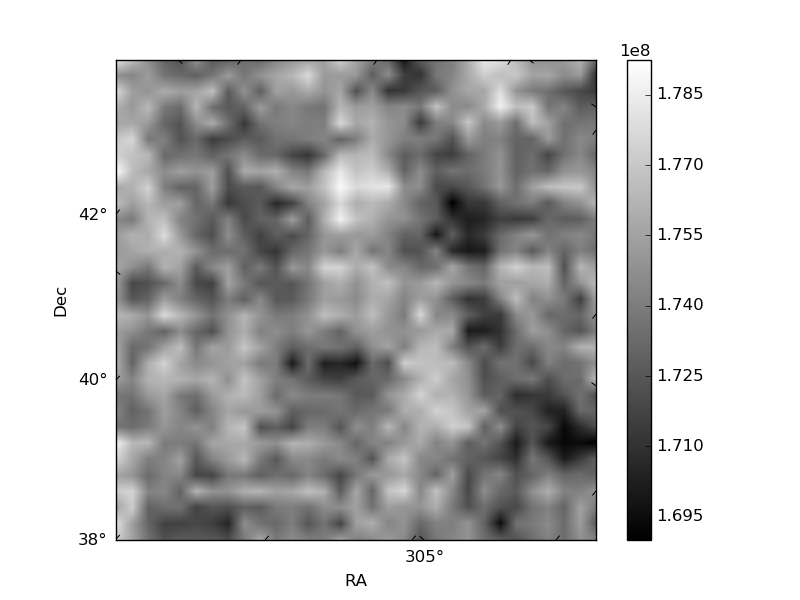
Quadrant B |
|---|---|---|---|
| Quadrant D | 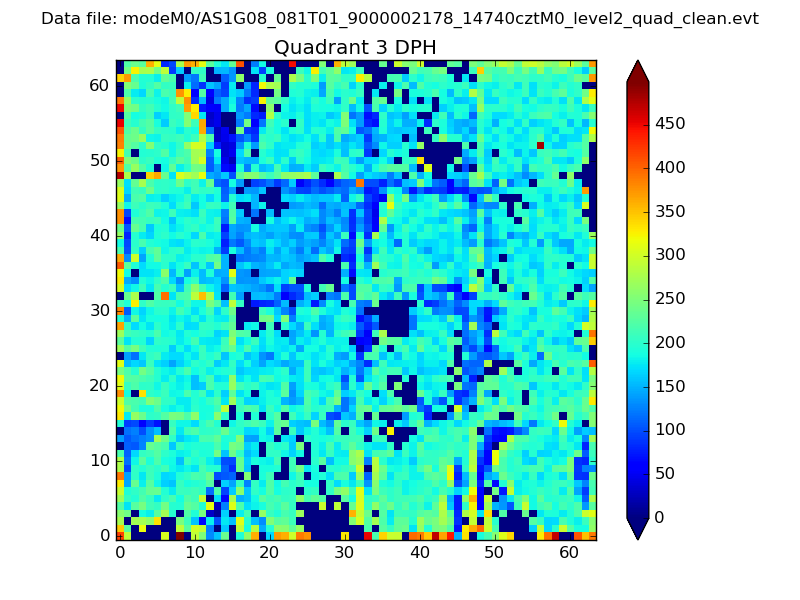 |
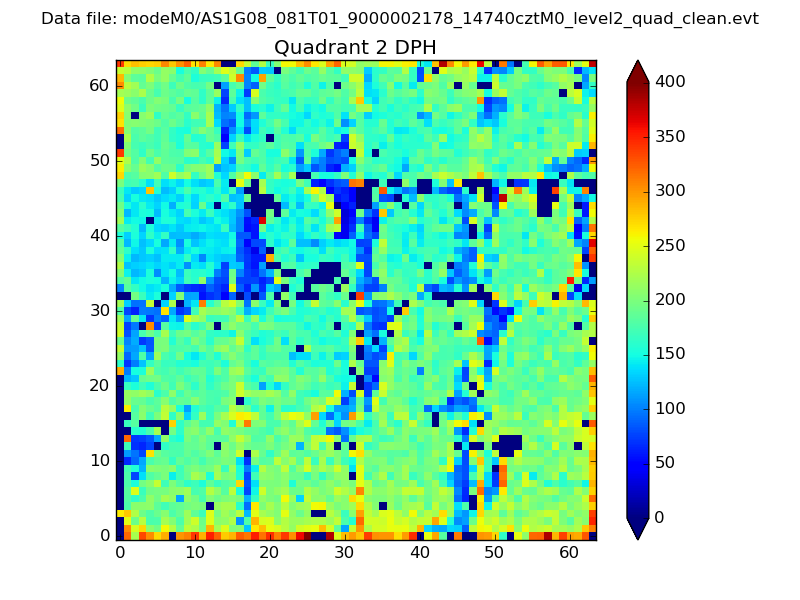 |
Quadrant C |
| Plot type | Count rate plots | Images |
|---|---|---|
| Comparison with Poisson distribution Blue bars denote a histogram of data divided into 1 sec bins. Red curve is a Poisson curve with rate = median count rate of data. |
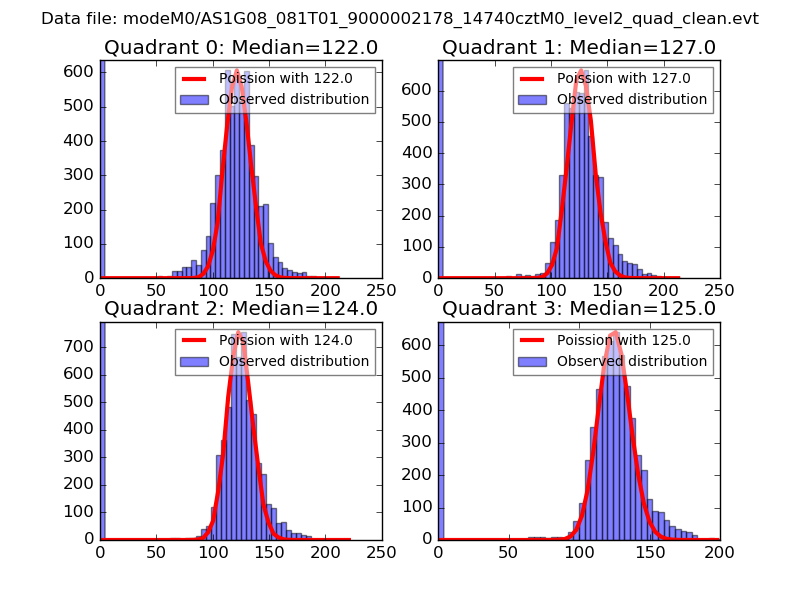 |
 |
| Quadrant-wise count rates Data is divided into 100 sec bins |
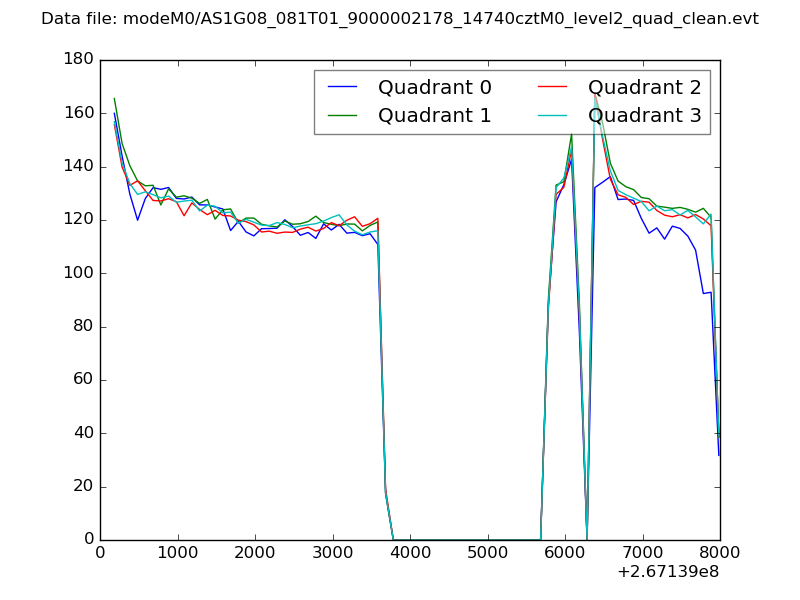 |
|
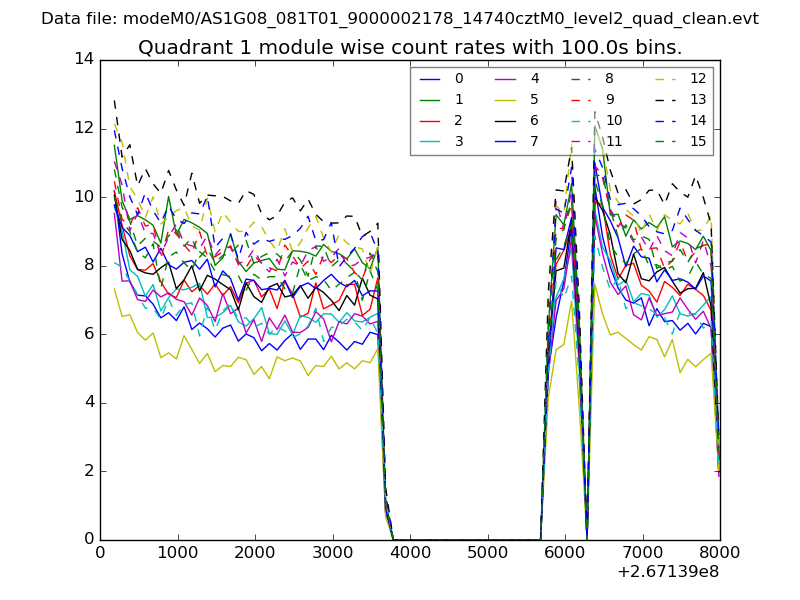
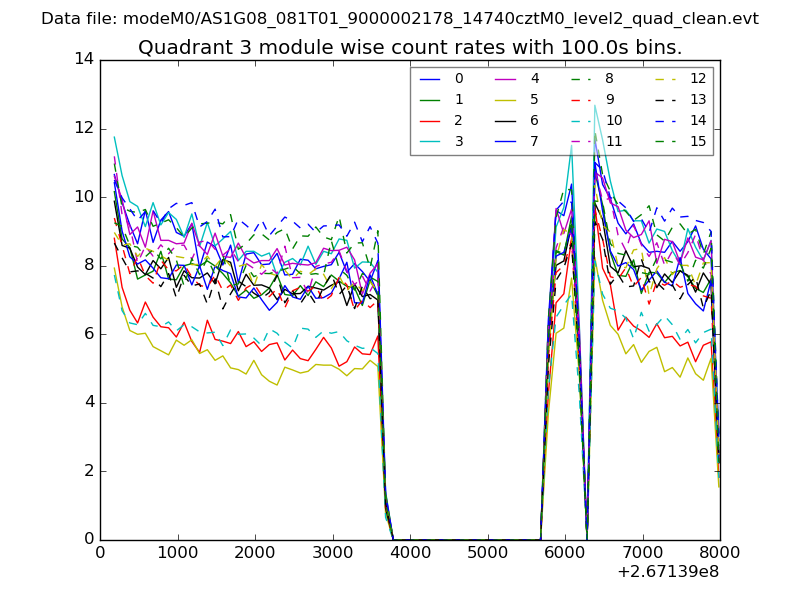
| Module-wise count rates for Quadrant A Data is divided into 100 sec bins |
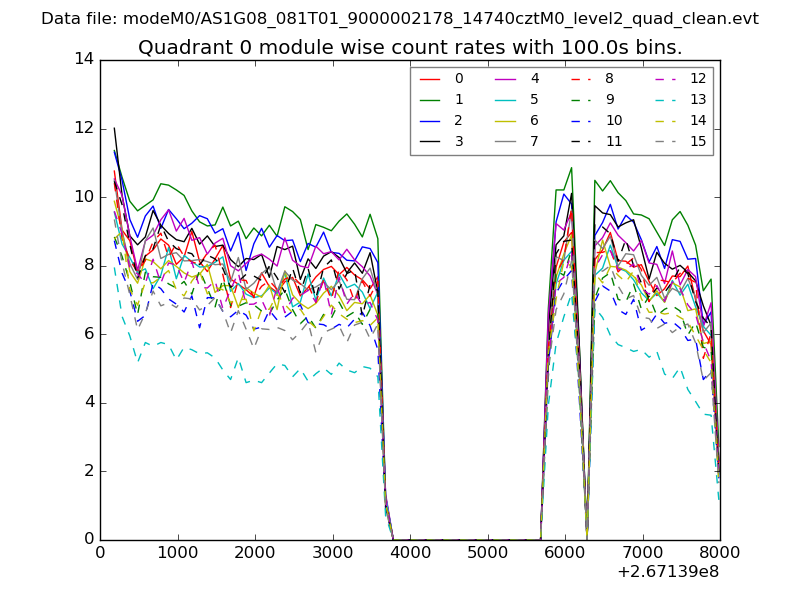 |
 |
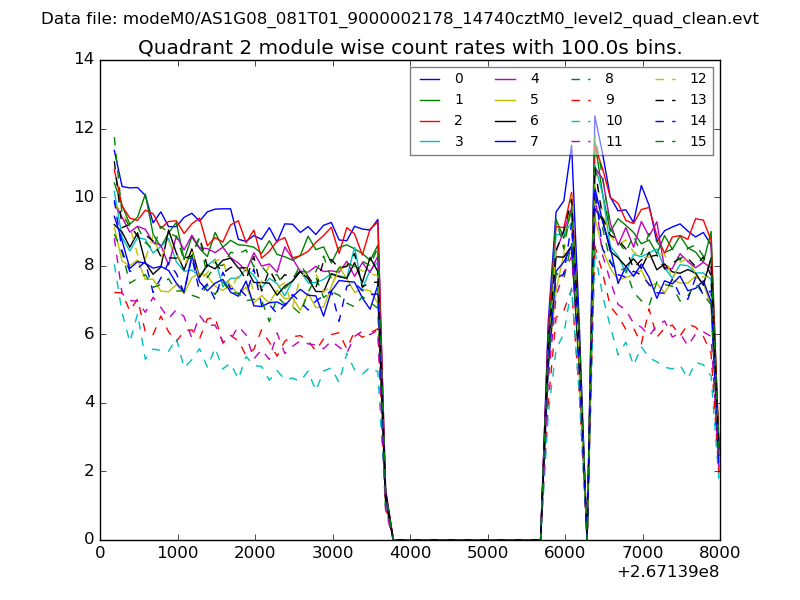
| Module-wise count rates for Quadrant B Data is divided into 100 sec bins |
 |
 |
| Module-wise count rates for Quadrant C Data is divided into 100 sec bins |
 |
 |
| Module-wise count rates for Quadrant D Data is divided into 100 sec bins |
 |
 |
| Parameter | Plot |
|---|---|
| CZT HV Monitor | 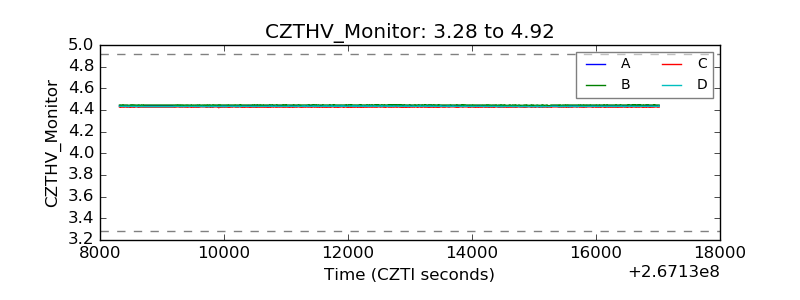 |
| D_VDD | 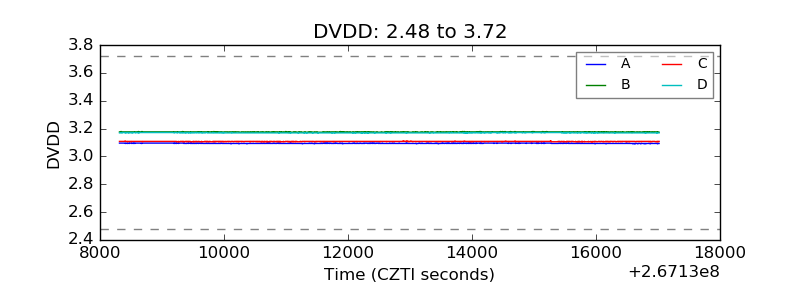 |
| Temperature 1 | 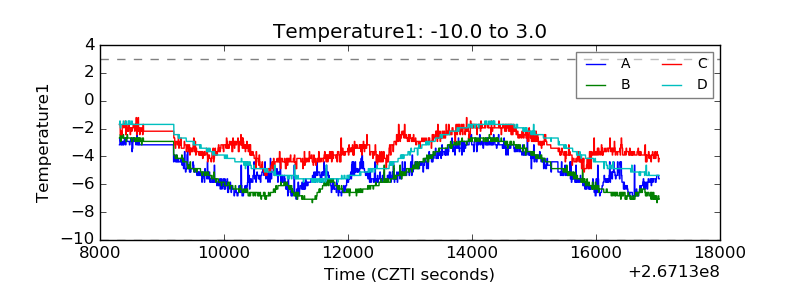 |
| Veto HV Monitor | 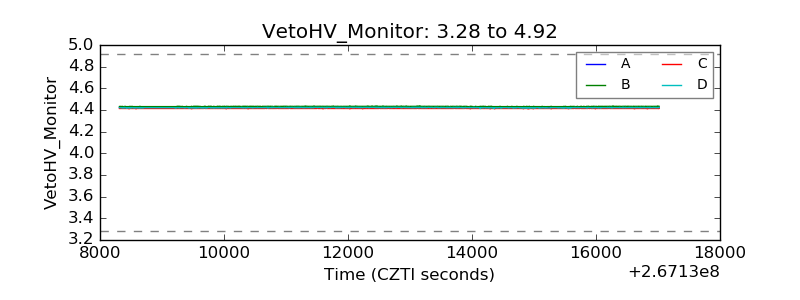 |
| Veto LLD | 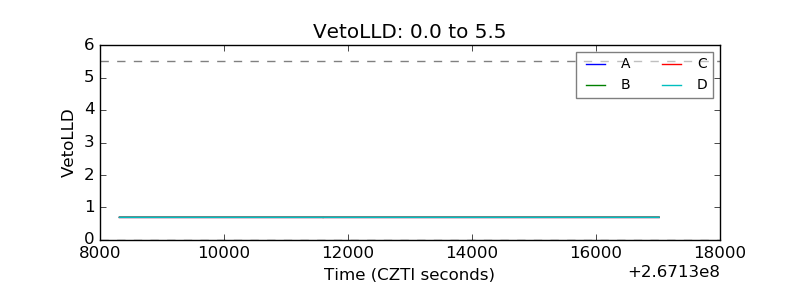 |
| Alpha Counter | 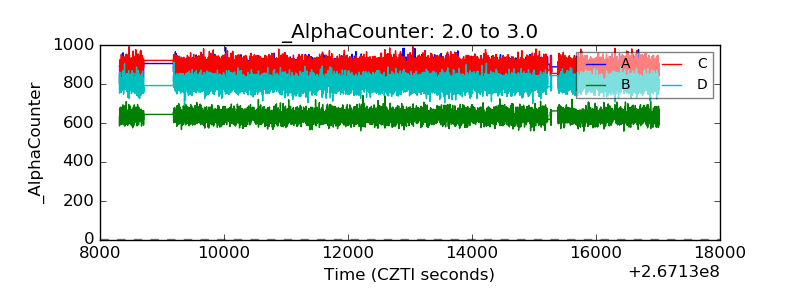 |
| _CPM_Rate |  |
| CZT Counter | 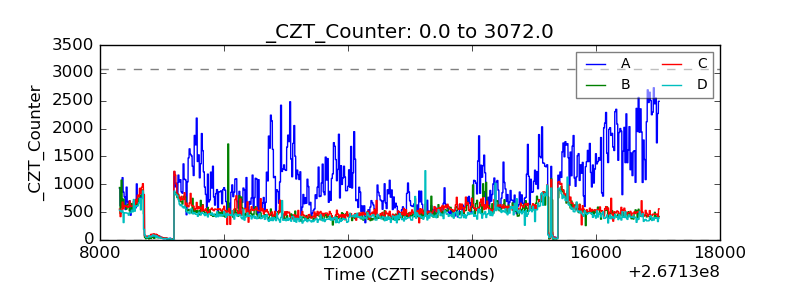 |
| +2.5 Volts monitor | 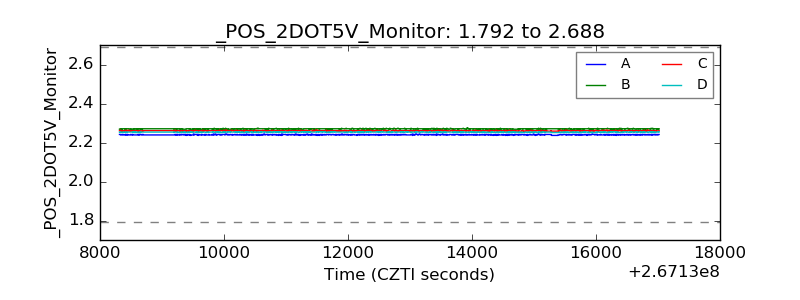 |
| +5 Volts monitor |  |
| _ROLL_ROT | 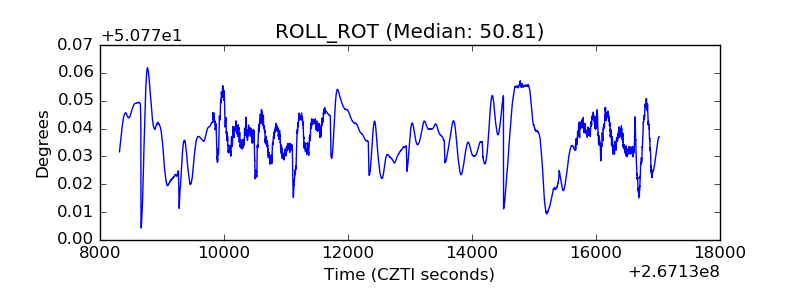 |
| _Roll_DEC |  |
| _Roll_RA |  |
| Veto Counter | 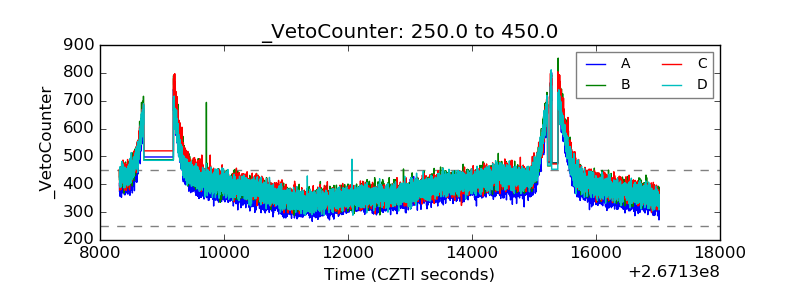 |