| Param | Original file | Final file |
|---|---|---|
| Filename | modeM0/AS1A04_022T06_9000002182_14759cztM0_level2.evt | modeM0/AS1A04_022T06_9000002182_14759cztM0_level2_quad_clean.evt |
| Size (bytes) | 102,597,120 | 26,631,360 |
| Size | 97.8 MB | 25.4 MB |
| Events in quadrant A | 1,048,708 | 177,516 |
| Events in quadrant B | 681,043 | 180,815 |
| Events in quadrant C | 698,978 | 176,400 |
| Events in quadrant D | 588,035 | 174,621 |
| Mode SS | |||
|---|---|---|---|
| Quadrant | BADHDUFLAG | Total packets | Discarded packets |
| A | 0 | 55 | 29 |
| B | 0 | 56 | 30 |
| C | 0 | 57 | 31 |
| D | 0 | 50 | 24 |
| Mode M0 | |||
|---|---|---|---|
| Quadrant | BADHDUFLAG | Total packets | Discarded packets |
| A | 0 | 8780 | 4751 |
| B | 0 | 5570 | 2800 |
| C | 0 | 5697 | 2932 |
| D | 0 | 5676 | 3049 |
| Mode M9 | |||
|---|---|---|---|
| Quadrant | BADHDUFLAG | Total packets | Discarded packets |
| A | 0 | 20 | 16 |
| B | 0 | 14 | 11 |
| C | 0 | 15 | 11 |
| D | 0 | 14 | 12 |
| Quadrant | Total seconds | Saturated seconds | Saturation percentage |
|---|---|---|---|
| A | 1283 | 9 | 0.701481% |
| B | 1286 | 15 | 1.166407% |
| C | 1288 | 1 | 0.077640% |
| D | 1291 | 4 | 0.309837% |
Noise dominated data is calculated using 1-second bins in cleaned event files. If a bin has >2000 counts, and if more than 50% of those come from <1% of pixels, then it is considered to be noise-dominated and hence unusable.
| Quadrant | # 1 sec bins | Bins with >0 counts | Bins with >2000 counts | High rate bins dominated by noise | Noise dominated (total time) | Noise dominated (detector-on time) | Marked lightcurve |
|---|---|---|---|---|---|---|---|
| A | 1306 | 1301 | 2 | 2 | 0.15% | 0.15% | 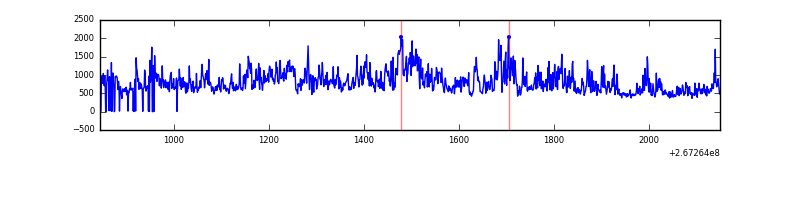 |
| B | 1306 | 1303 | 6 | 6 | 0.46% | 0.46% | 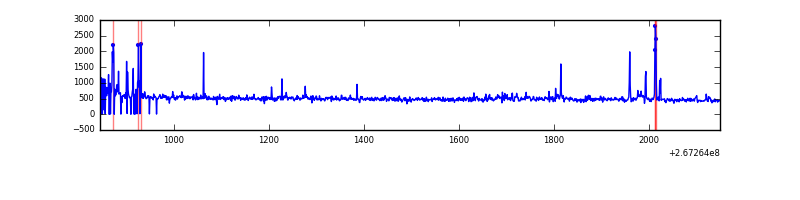 |
| C | 1306 | 1304 | 1 | 1 | 0.08% | 0.08% | 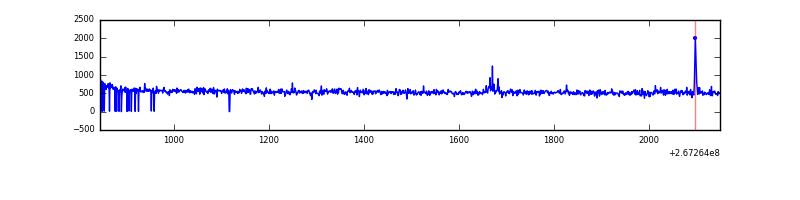 |
| D | 1306 | 1305 | 2 | 2 | 0.15% | 0.15% | 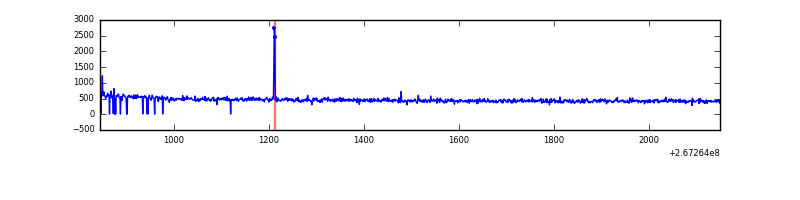 |
Top three noisy pixels from each quadrant. If the there are fewer than three noisy pixels in the level2.evt file, extra rows are filled as -1
| Pixel properties | Quadrant properties | ||||||
|---|---|---|---|---|---|---|---|
| Quadrant | DetID | PixID | Counts | Sigma | Mean | Median | Sigma |
| A | 8 | 15 | 427872 | 12690.22 | 159 | 155 | 33.7 |
| A | 12 | 189 | 8953 | 261.03 | 159 | 155 | 33.7 |
| A | 0 | 226 | 1442 | 38.18 | 159 | 155 | 33.7 |
| B | 10 | 16 | 41767 | 1290.17 | 158 | 154 | 32.3 |
| B | 0 | 214 | 13573 | 416.04 | 158 | 154 | 32.3 |
| B | 0 | 205 | 7972 | 242.39 | 158 | 154 | 32.3 |
| C | 3 | 233 | 95688 | 2608.97 | 151 | 152 | 36.6 |
| C | 4 | 254 | 12866 | 347.2 | 151 | 152 | 36.6 |
| C | 13 | 61 | 1049 | 24.5 | 151 | 152 | 36.6 |
| D | 2 | 120 | 6601 | 172.67 | 151 | 148 | 37.4 |
| D | 2 | 234 | 4366 | 112.87 | 151 | 148 | 37.4 |
| D | 3 | 238 | 2267 | 56.7 | 151 | 148 | 37.4 |
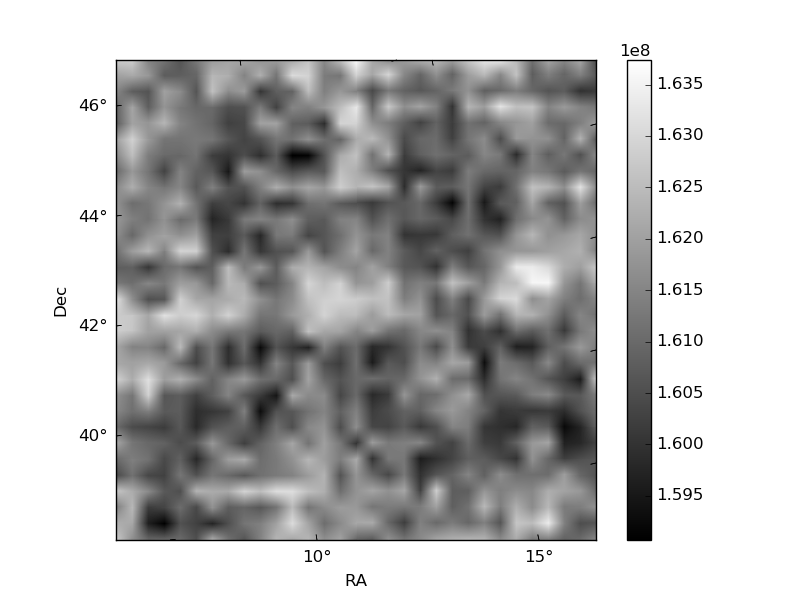
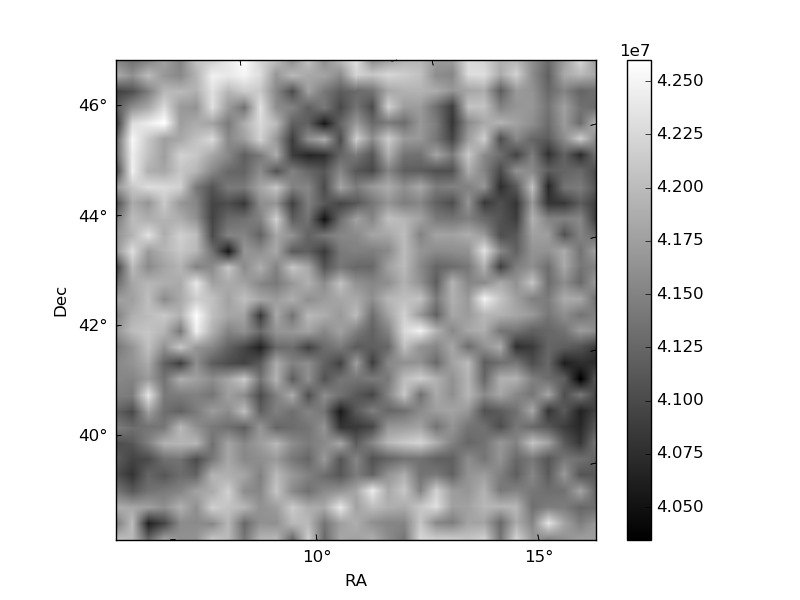
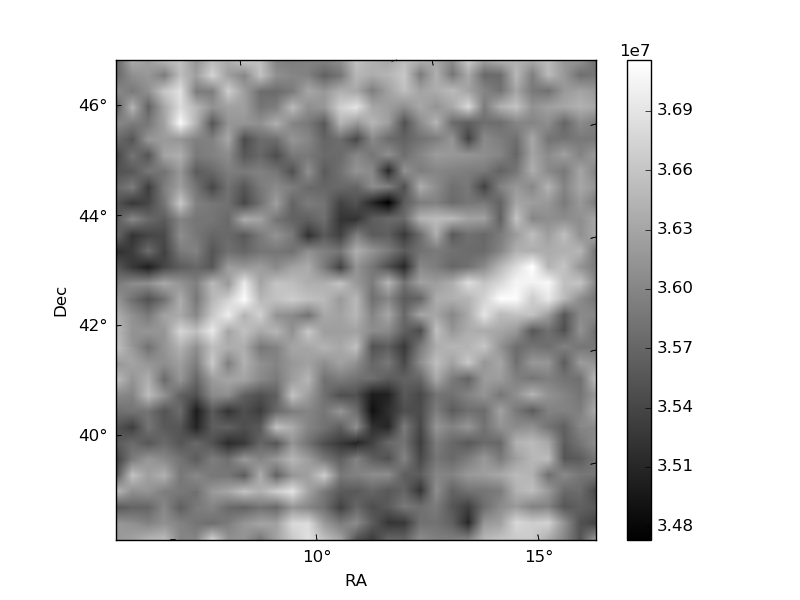
Histogram calculated using DETX and DETY for each event in the final _common_clean file
| Quadrant A | 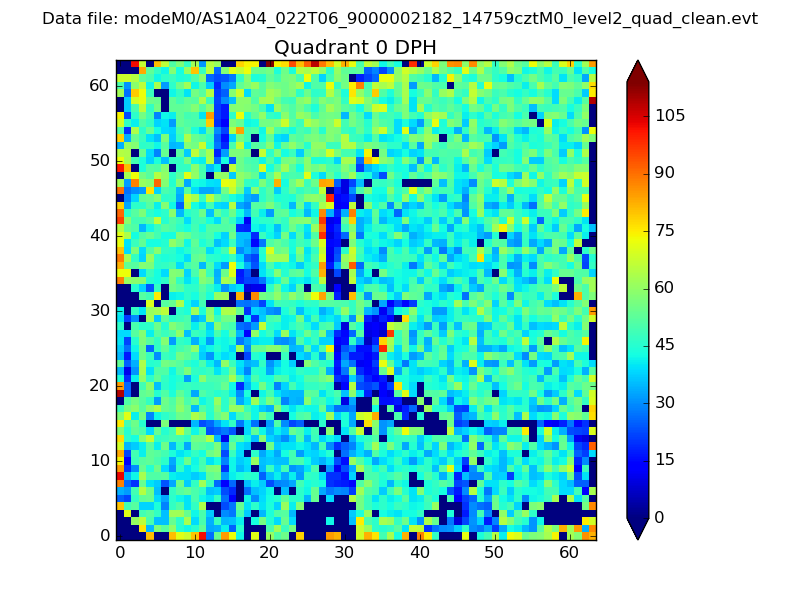 |
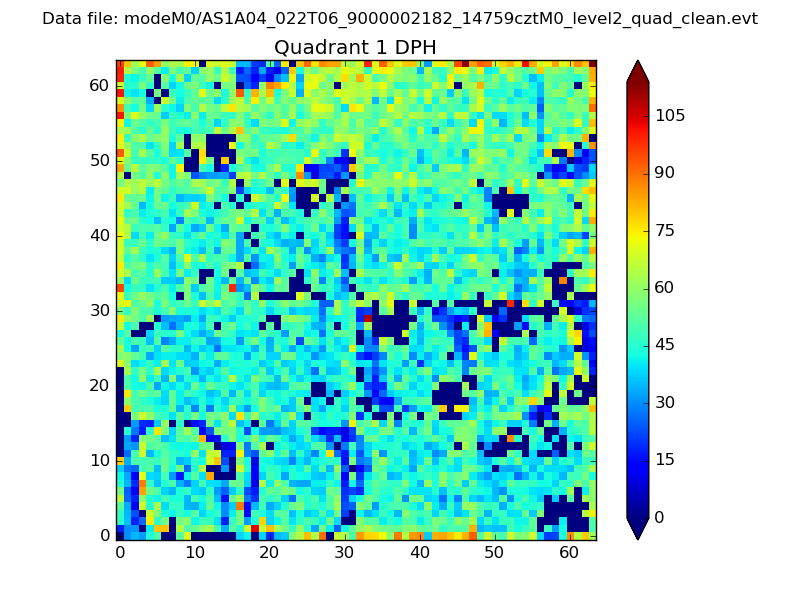 |
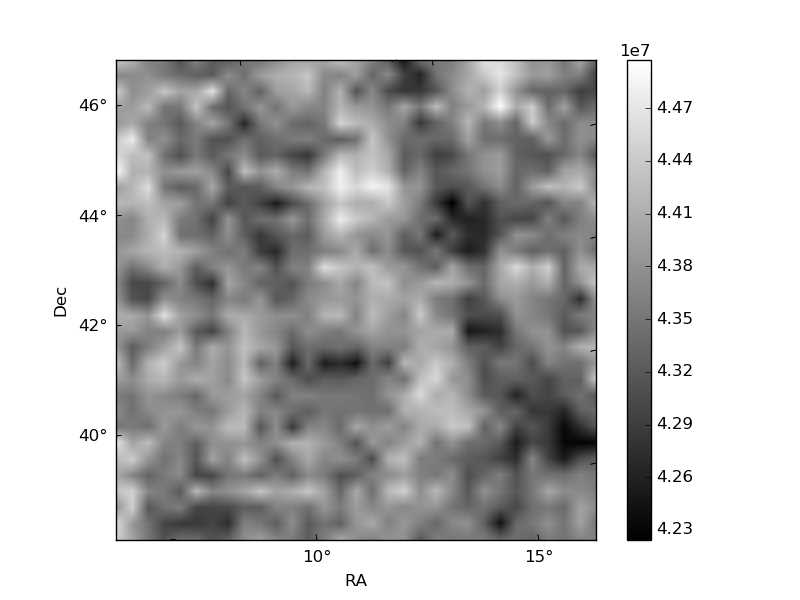
Quadrant B |
|---|---|---|---|
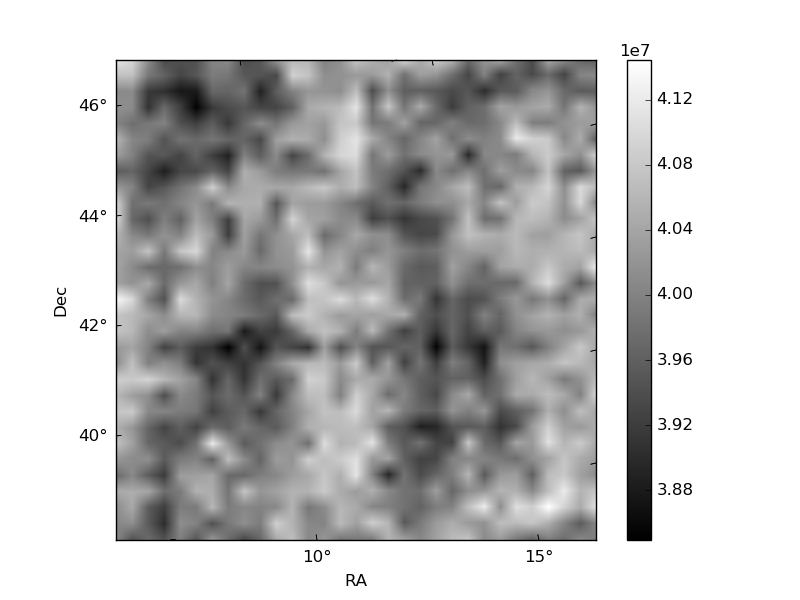
| Quadrant D | 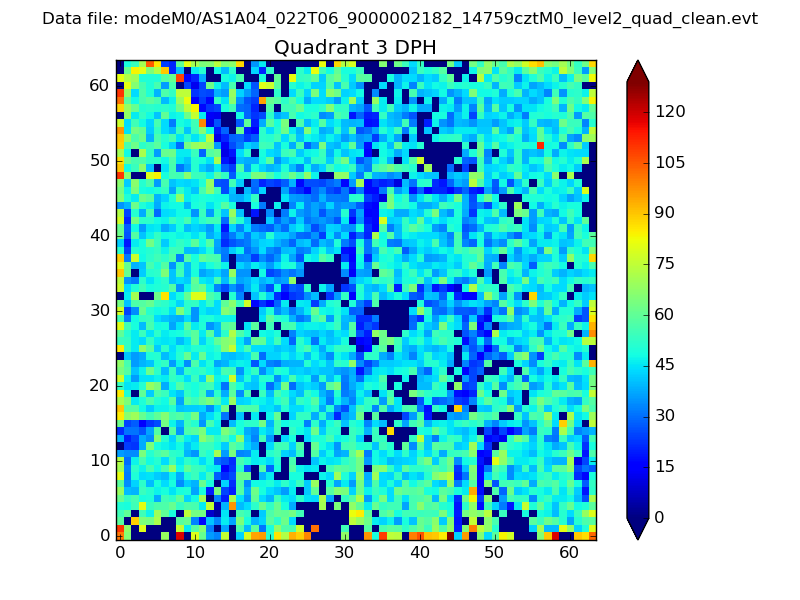 |
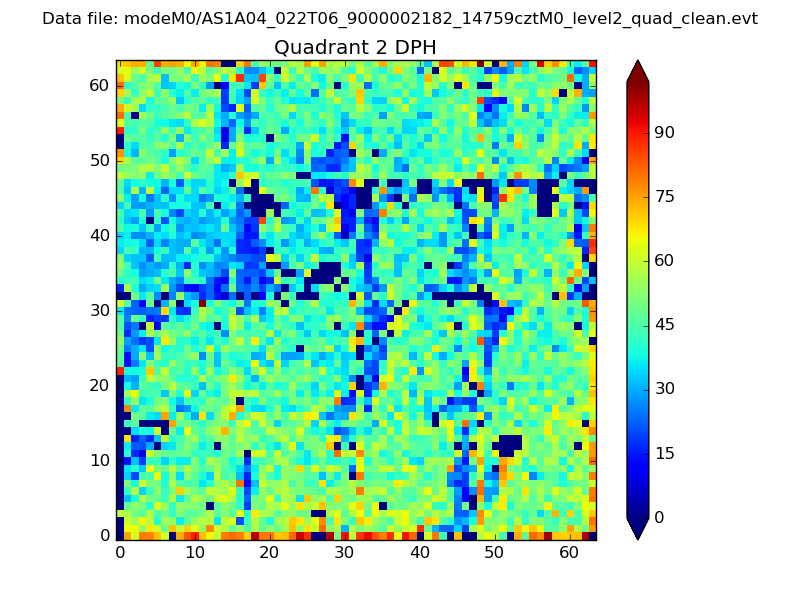 |
Quadrant C |
| Plot type | Count rate plots | Images |
|---|---|---|
| Comparison with Poisson distribution Blue bars denote a histogram of data divided into 1 sec bins. Red curve is a Poisson curve with rate = median count rate of data. |
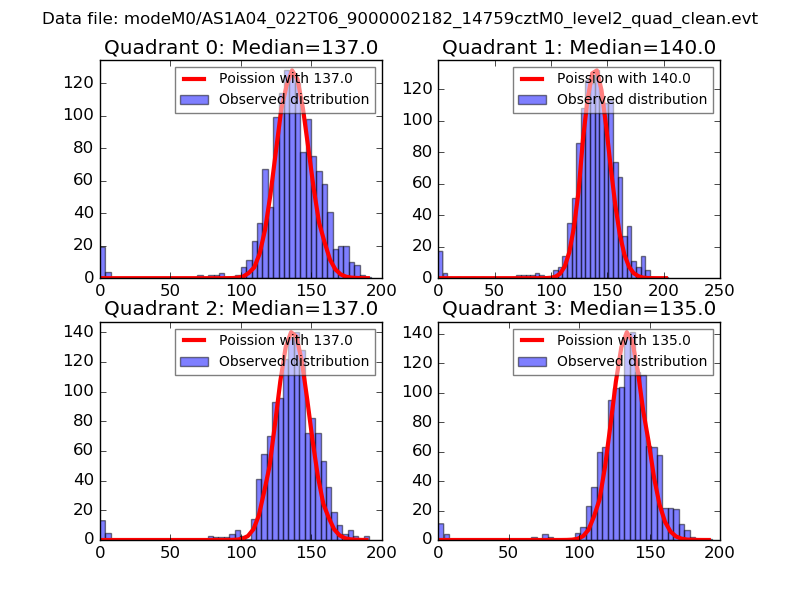 |
 |
| Quadrant-wise count rates Data is divided into 100 sec bins |
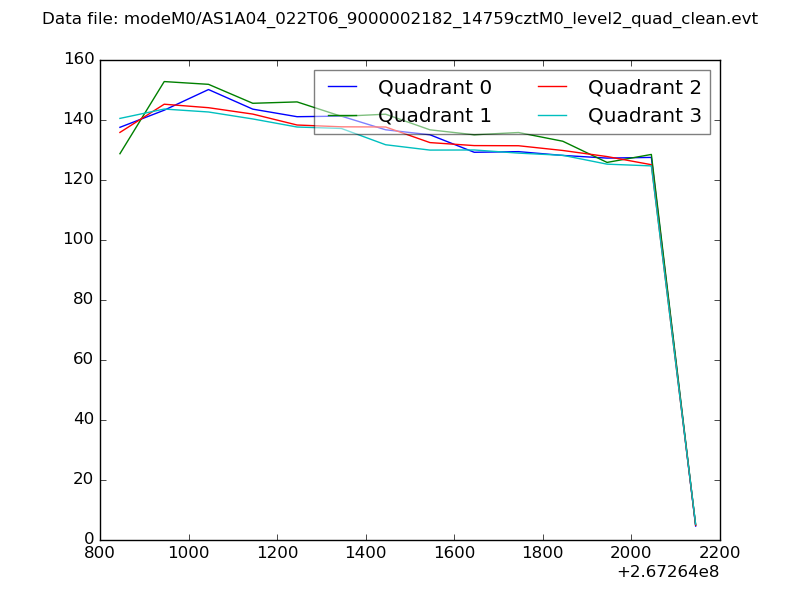 |
|
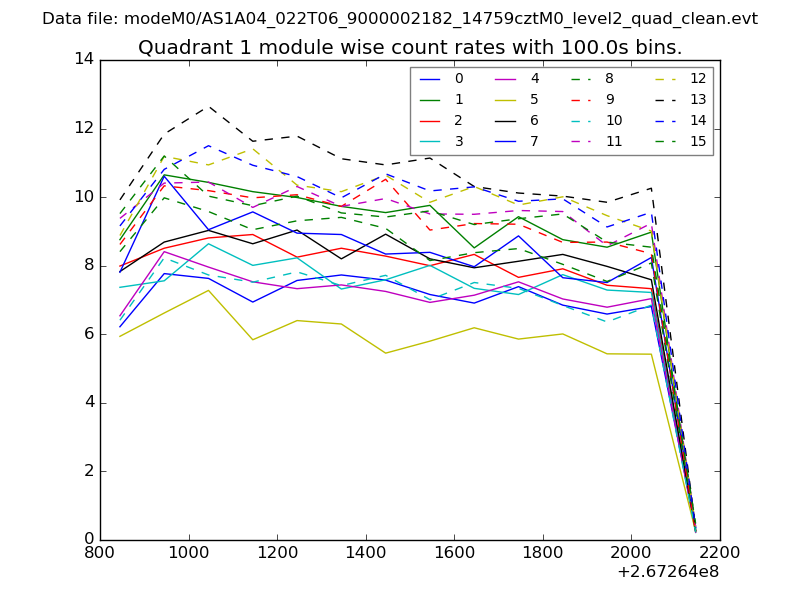
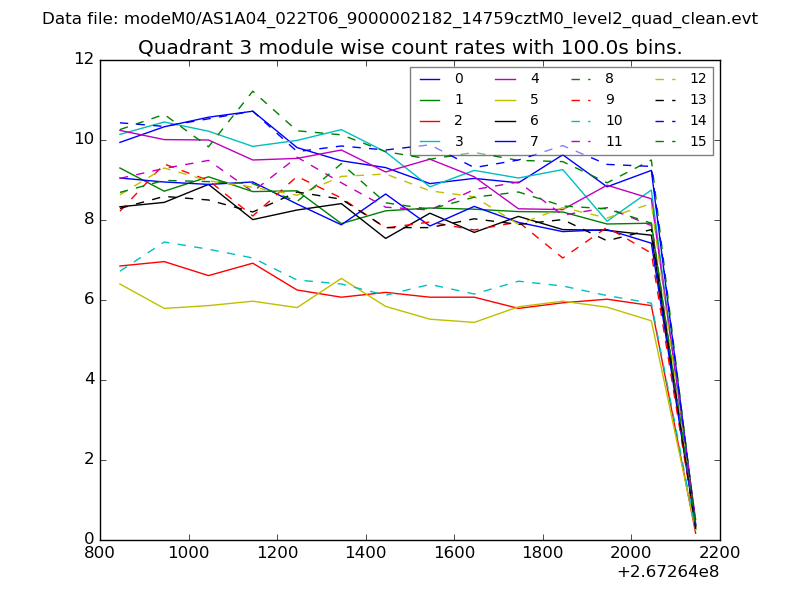
| Module-wise count rates for Quadrant A Data is divided into 100 sec bins |
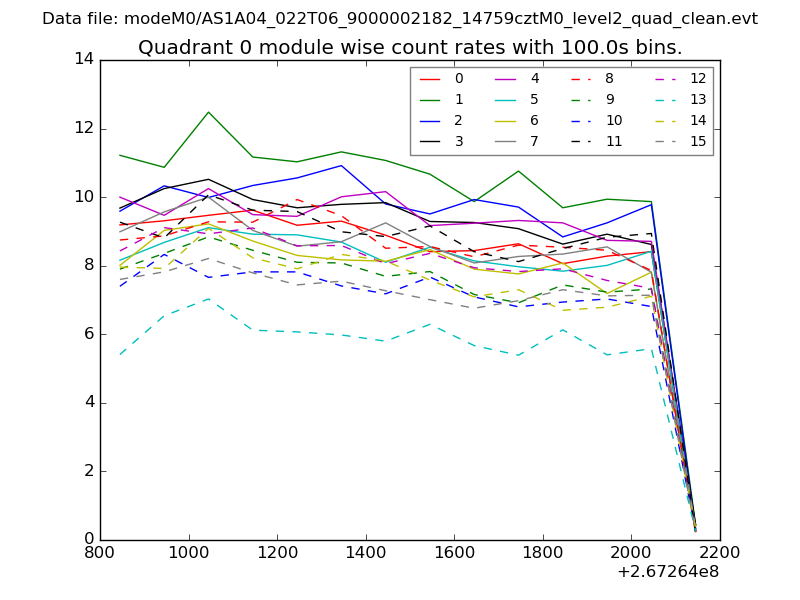 |
 |
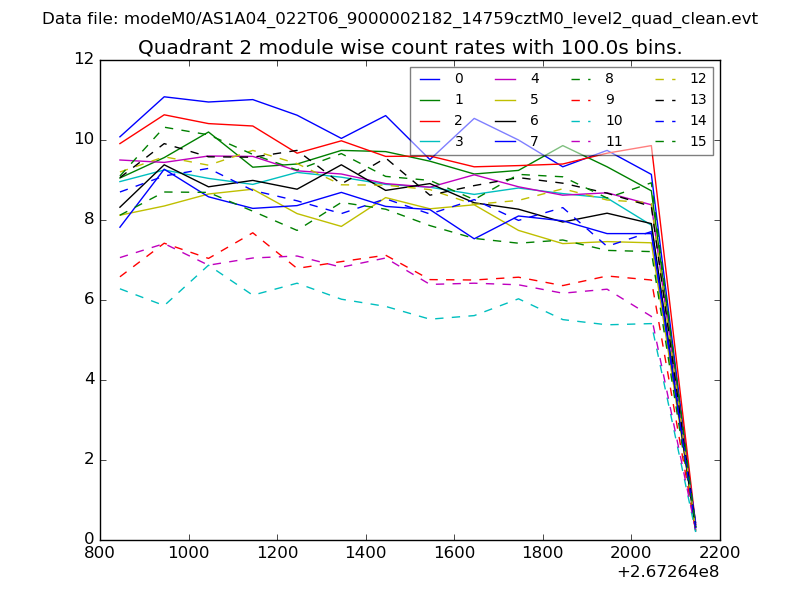
| Module-wise count rates for Quadrant B Data is divided into 100 sec bins |
 |
 |
| Module-wise count rates for Quadrant C Data is divided into 100 sec bins |
 |
 |
| Module-wise count rates for Quadrant D Data is divided into 100 sec bins |
 |
 |
| Parameter | Plot |
|---|---|
| CZT HV Monitor | 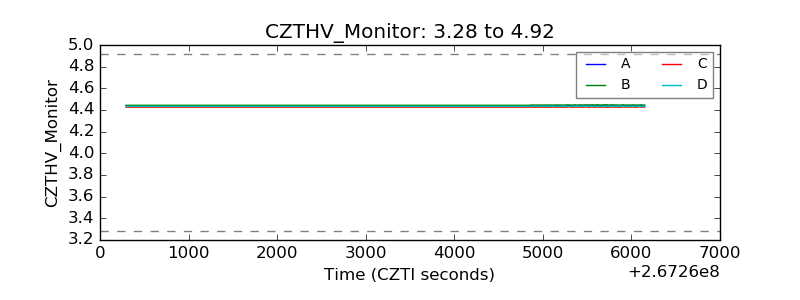 |
| D_VDD | 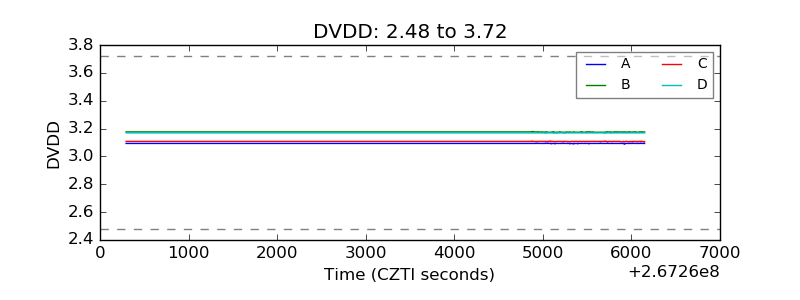 |
| Temperature 1 | 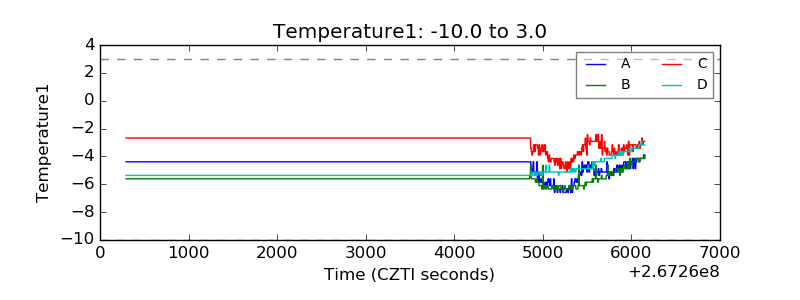 |
| Veto HV Monitor | 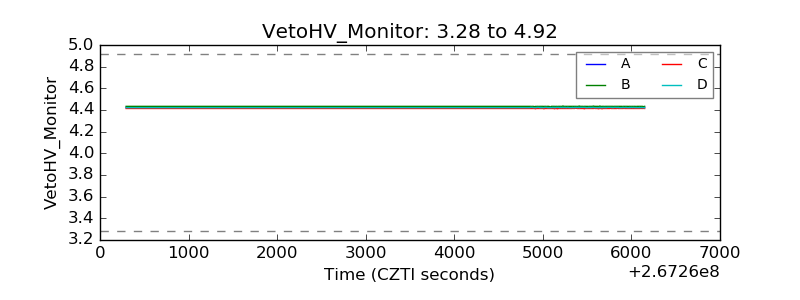 |
| Veto LLD | 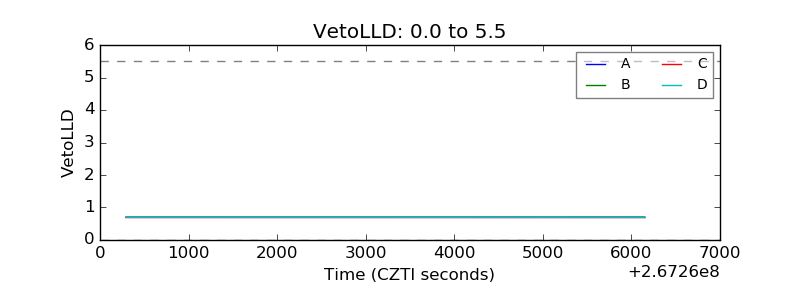 |
| Alpha Counter | 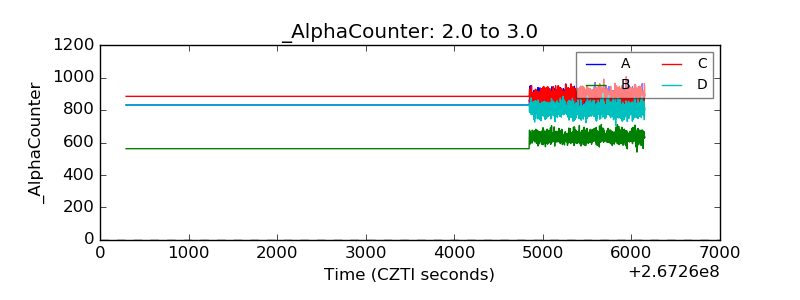 |
| _CPM_Rate | 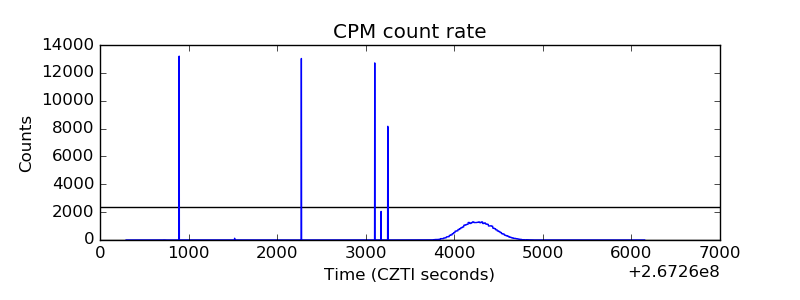 |
| CZT Counter | 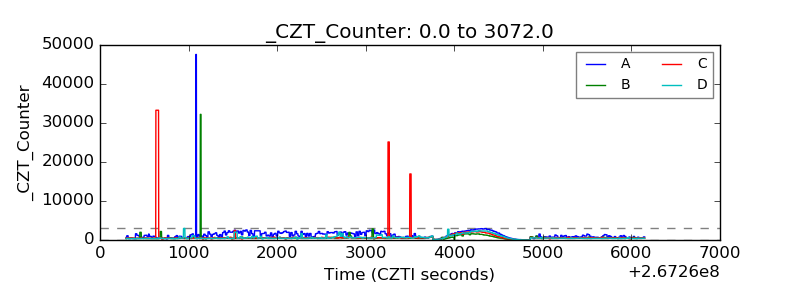 |
| +2.5 Volts monitor | 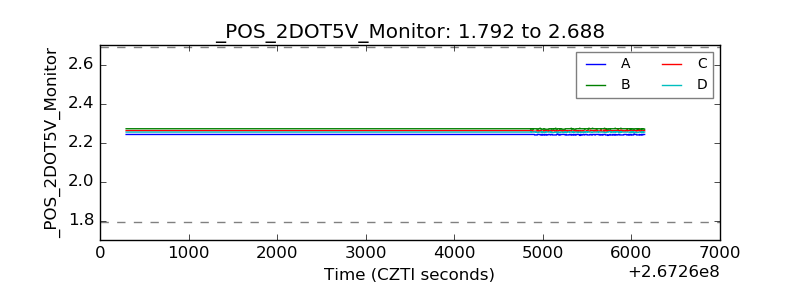 |
| +5 Volts monitor |  |
| _ROLL_ROT | 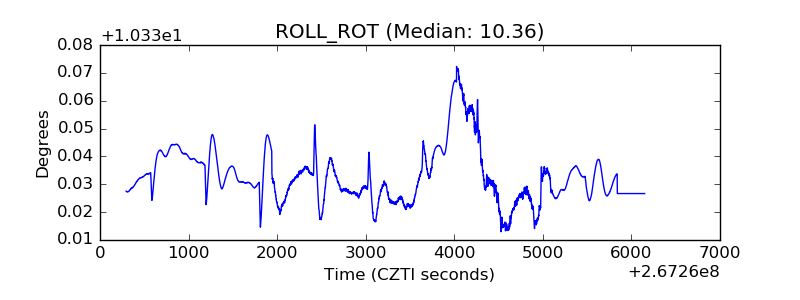 |
| _Roll_DEC | 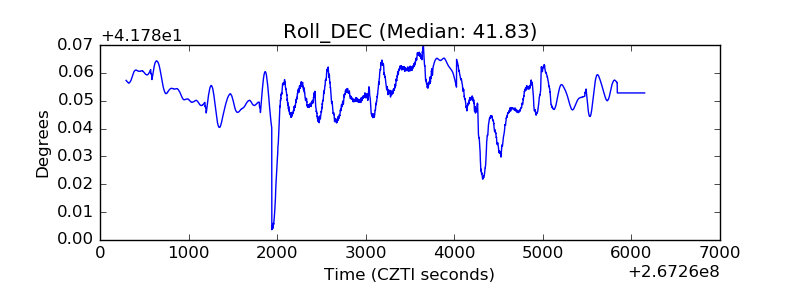 |
| _Roll_RA | 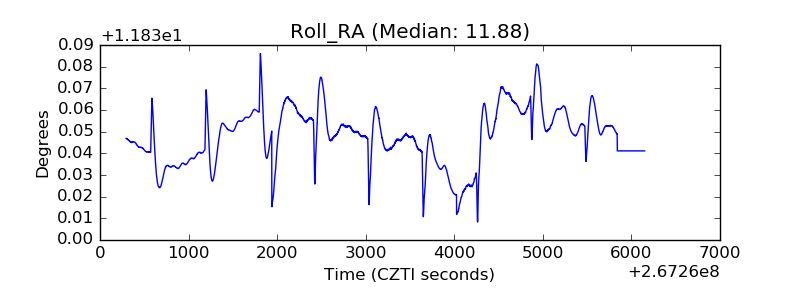 |
| Veto Counter | 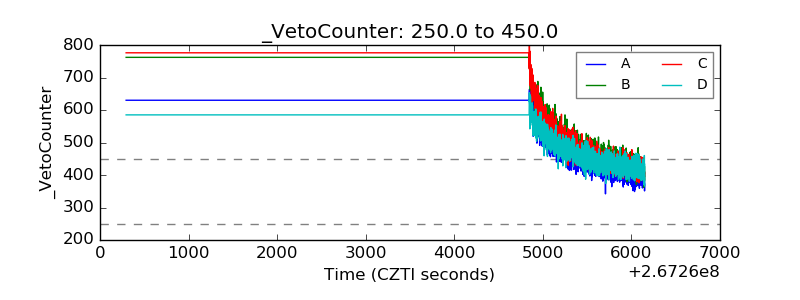 |