| Param | Original file | Final file |
|---|---|---|
| Filename | modeM0/AS1A04_022T06_9000002182_14760cztM0_level2.evt | modeM0/AS1A04_022T06_9000002182_14760cztM0_level2_quad_clean.evt |
| Size (bytes) | 1,423,304,640 | 204,114,240 |
| Size | 1.3 GB | 194.7 MB |
| Events in quadrant A | 16,994,882 | 1,251,199 |
| Events in quadrant B | 8,397,929 | 1,305,451 |
| Events in quadrant C | 8,831,456 | 1,275,053 |
| Events in quadrant D | 7,815,598 | 1,259,543 |
| Mode SS | |||
|---|---|---|---|
| Quadrant | BADHDUFLAG | Total packets | Discarded packets |
| A | 0 | 322 | 0 |
| B | 0 | 322 | 0 |
| C | 0 | 322 | 0 |
| D | 0 | 322 | 0 |
| Mode M0 | |||
|---|---|---|---|
| Quadrant | BADHDUFLAG | Total packets | Discarded packets |
| A | 0 | 61126 | 4 |
| B | 0 | 34934 | 3 |
| C | 0 | 35756 | 3 |
| D | 0 | 34255 | 3 |
| Mode M9 | |||
|---|---|---|---|
| Quadrant | BADHDUFLAG | Total packets | Discarded packets |
| A | 0 | 31 | 0 |
| B | 0 | 31 | 0 |
| C | 0 | 31 | 0 |
| D | 0 | 31 | 0 |
| Quadrant | Total seconds | Saturated seconds | Saturation percentage |
|---|---|---|---|
| A | 15788 | 2133 | 13.510261% |
| B | 15813 | 358 | 2.263960% |
| C | 15813 | 161 | 1.018150% |
| D | 15813 | 137 | 0.866376% |
Noise dominated data is calculated using 1-second bins in cleaned event files. If a bin has >2000 counts, and if more than 50% of those come from <1% of pixels, then it is considered to be noise-dominated and hence unusable.
| Quadrant | # 1 sec bins | Bins with >0 counts | Bins with >2000 counts | High rate bins dominated by noise | Noise dominated (total time) | Noise dominated (detector-on time) | Marked lightcurve |
|---|---|---|---|---|---|---|---|
| A | 18949 | 15792 | 1655 | 1655 | 8.73% | 10.48% | 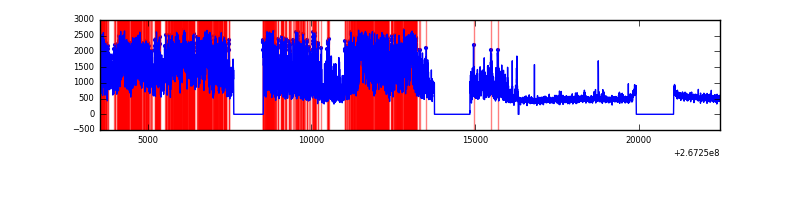 |
| B | 18949 | 15817 | 183 | 183 | 0.97% | 1.16% | 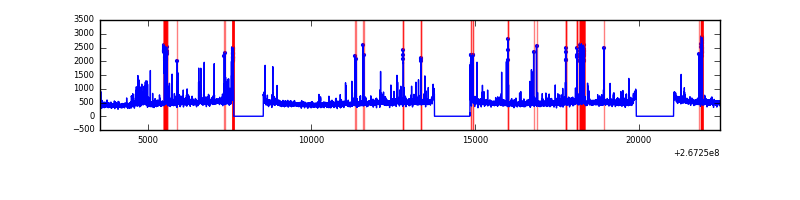 |
| C | 18948 | 15816 | 51 | 51 | 0.27% | 0.32% | 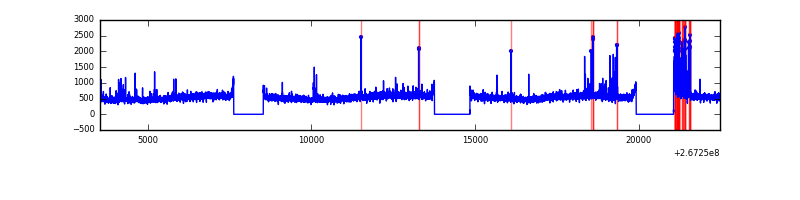 |
| D | 18949 | 15817 | 51 | 51 | 0.27% | 0.32% | 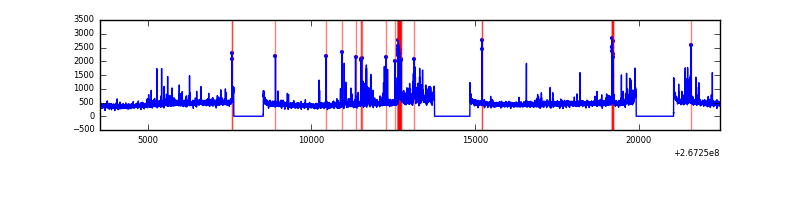 |
Top three noisy pixels from each quadrant. If the there are fewer than three noisy pixels in the level2.evt file, extra rows are filled as -1
| Pixel properties | Quadrant properties | ||||||
|---|---|---|---|---|---|---|---|
| Quadrant | DetID | PixID | Counts | Sigma | Mean | Median | Sigma |
| A | 8 | 15 | 9494625 | 25432.8 | 1854 | 1817 | 373.3 |
| A | 12 | 189 | 285907 | 761.12 | 1854 | 1817 | 373.3 |
| A | 0 | 23 | 65291 | 170.06 | 1854 | 1817 | 373.3 |
| B | 10 | 16 | 525538 | 1472.5 | 1884 | 1837 | 355.7 |
| B | 4 | 142 | 142619 | 395.84 | 1884 | 1837 | 355.7 |
| B | 0 | 205 | 106063 | 293.05 | 1884 | 1837 | 355.7 |
| C | 3 | 233 | 1275607 | 3045.29 | 1823 | 1831 | 418.3 |
| C | 4 | 254 | 427065 | 1016.63 | 1823 | 1831 | 418.3 |
| C | 13 | 61 | 13219 | 27.23 | 1823 | 1831 | 418.3 |
| D | 5 | 222 | 592660 | 1233.16 | 1830 | 1782 | 479.2 |
| D | 2 | 234 | 71863 | 146.26 | 1830 | 1782 | 479.2 |
| D | 2 | 152 | 58243 | 117.83 | 1830 | 1782 | 479.2 |
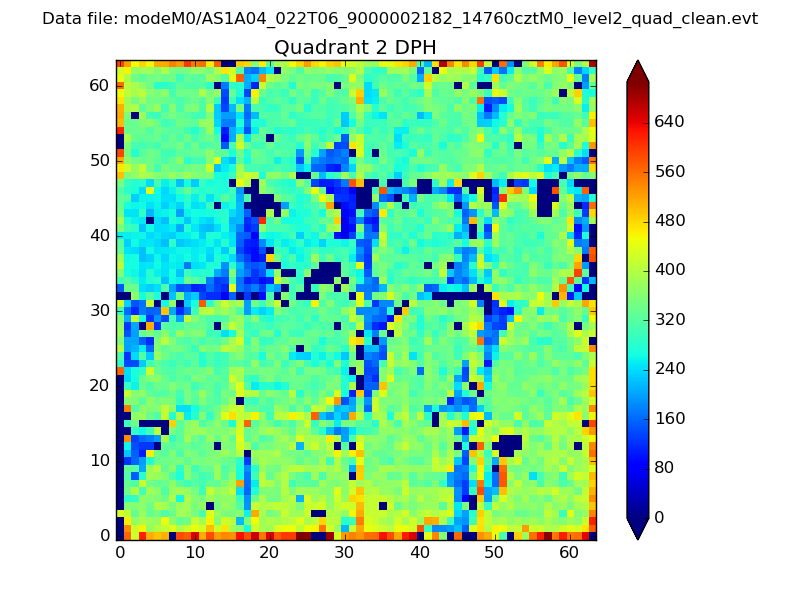
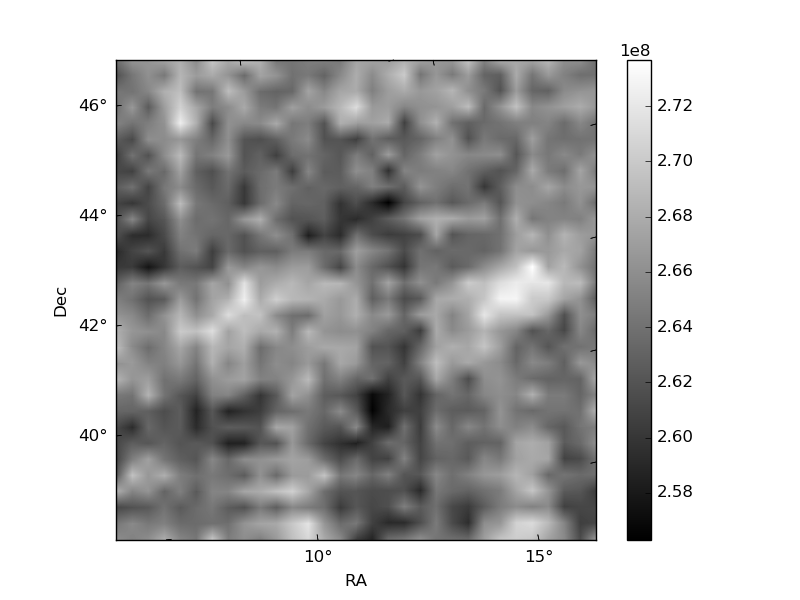
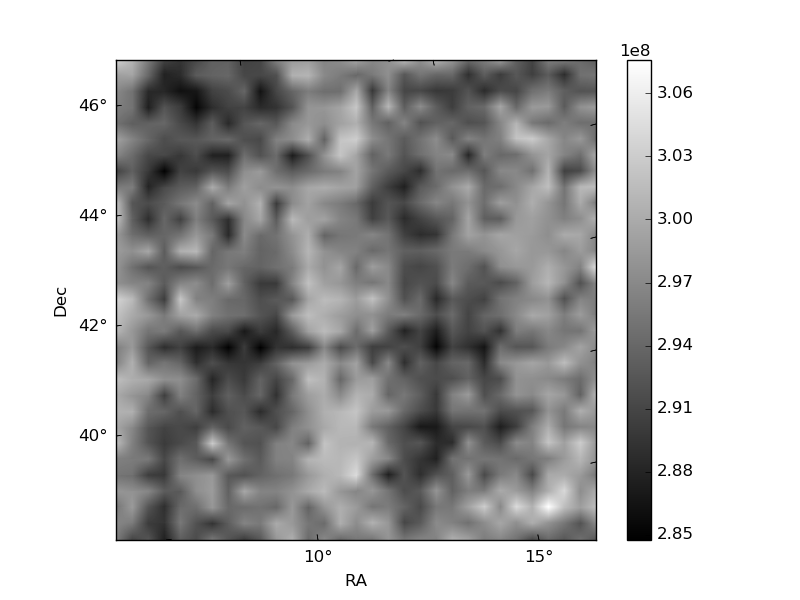
Histogram calculated using DETX and DETY for each event in the final _common_clean file
| Quadrant A | 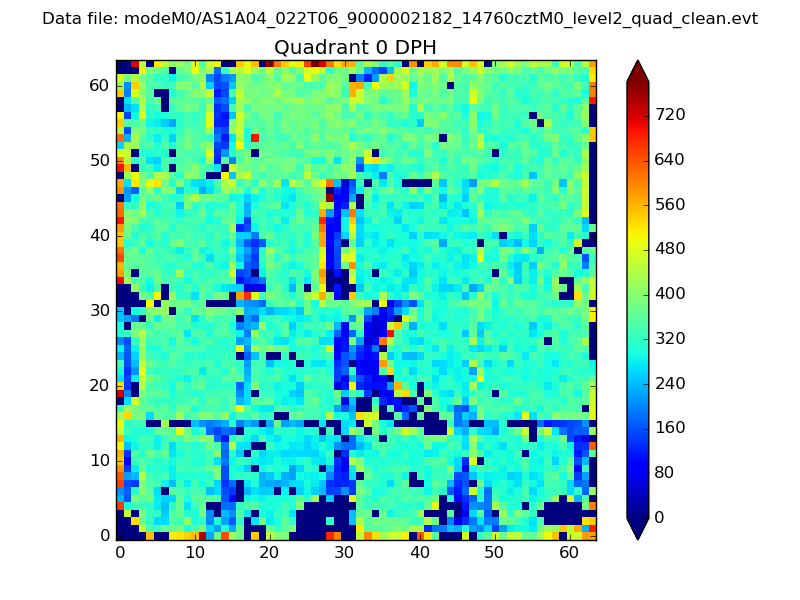 |
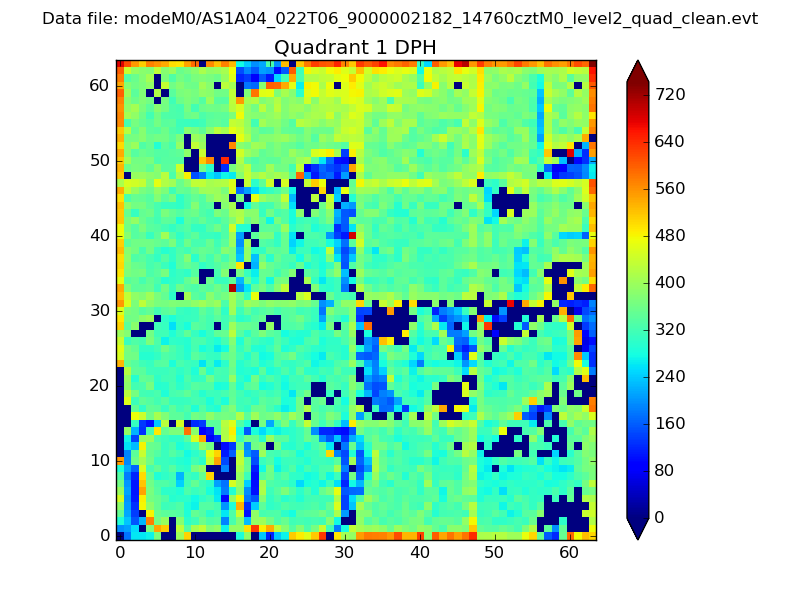 |
Quadrant B |
|---|---|---|---|
| Quadrant D | 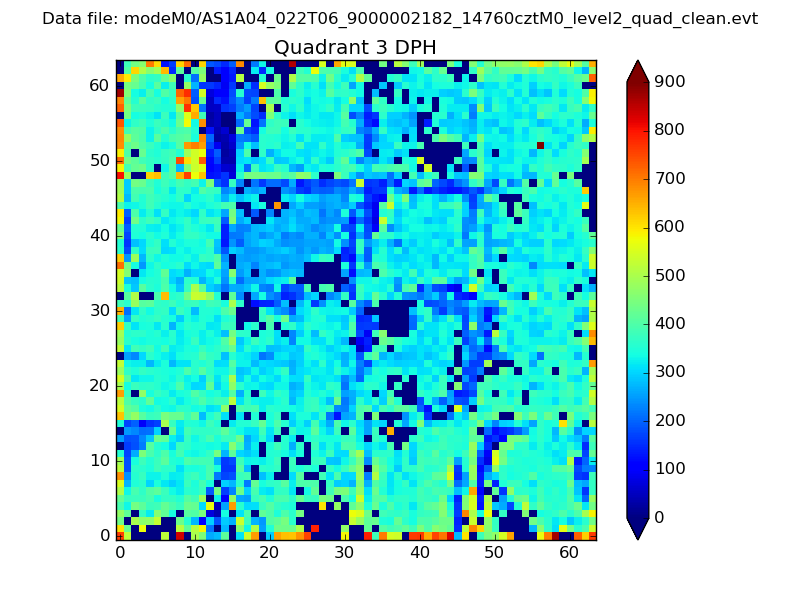 |
 |
Quadrant C |
| Plot type | Count rate plots | Images |
|---|---|---|
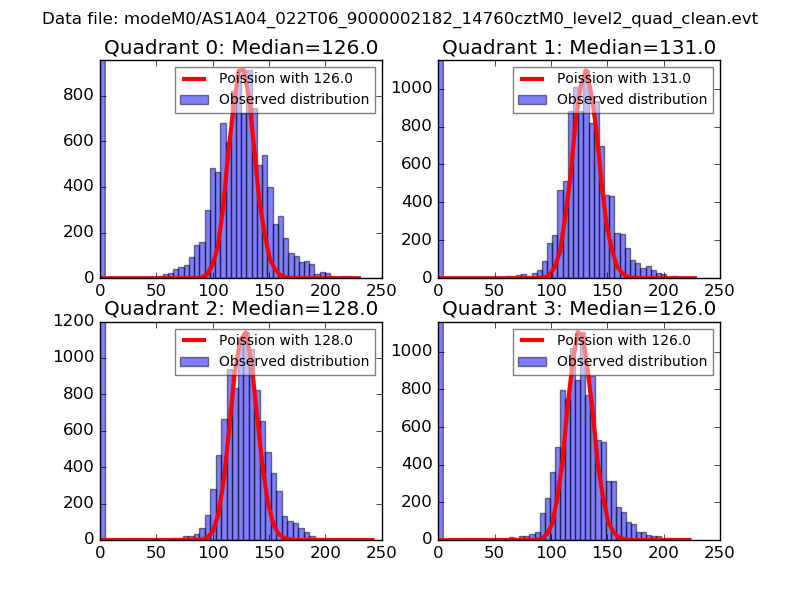
| Comparison with Poisson distribution Blue bars denote a histogram of data divided into 1 sec bins. Red curve is a Poisson curve with rate = median count rate of data. |
 |
 |
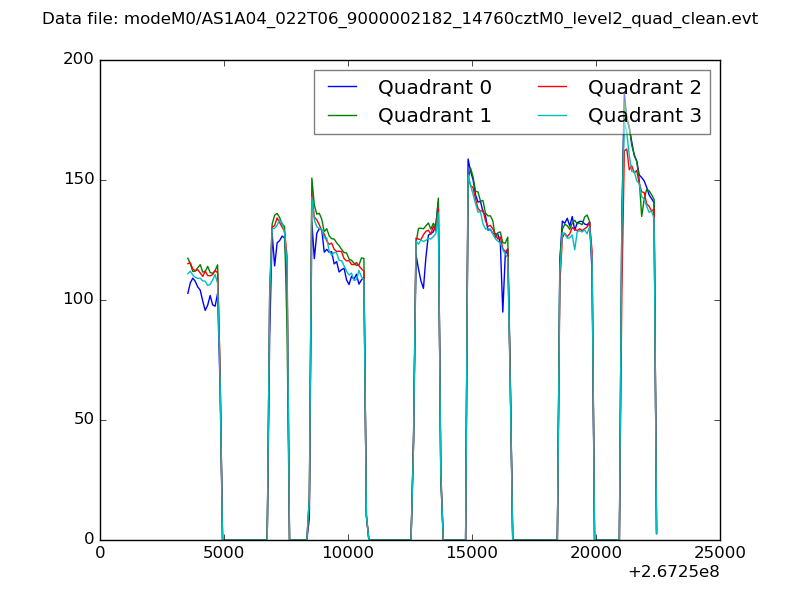
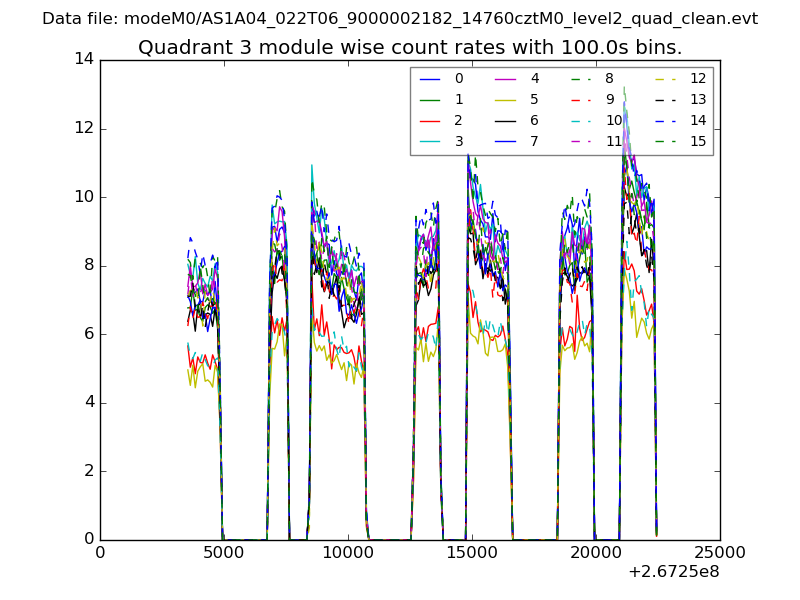
| Quadrant-wise count rates Data is divided into 100 sec bins |
 |
|
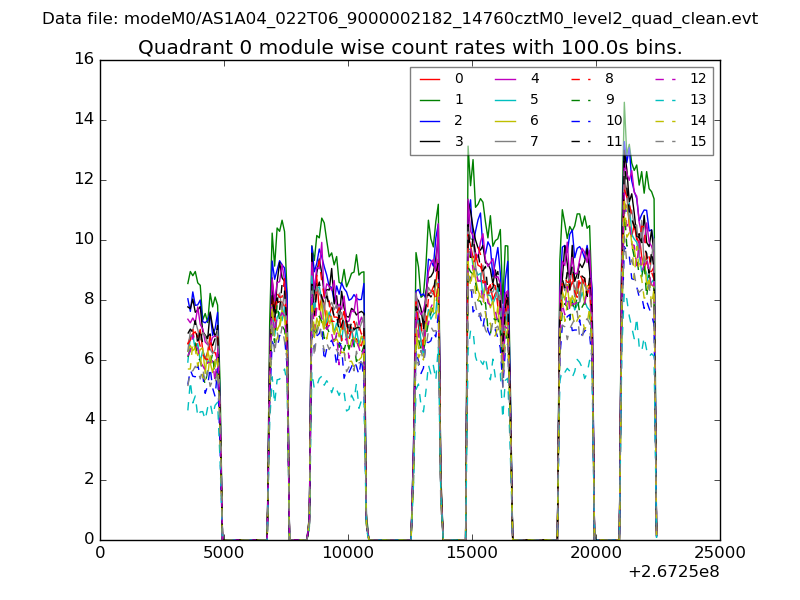
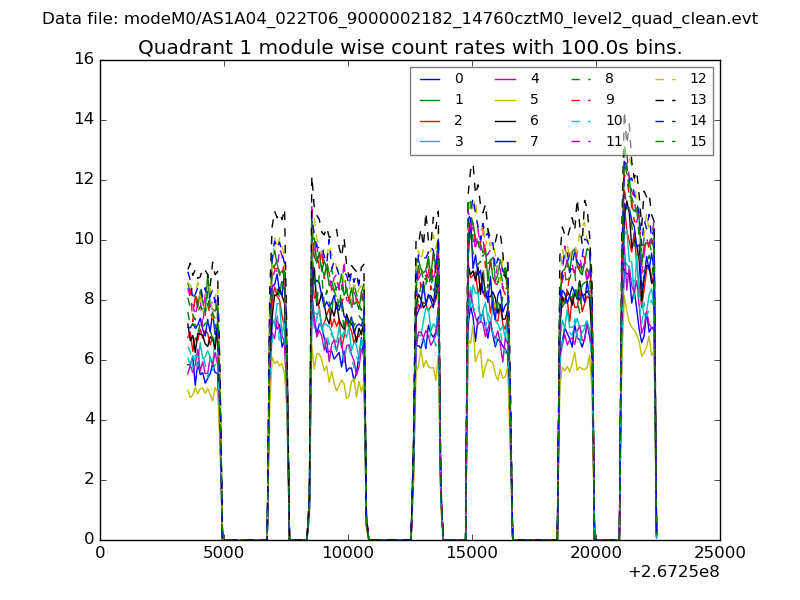
| Module-wise count rates for Quadrant A Data is divided into 100 sec bins |
 |
 |
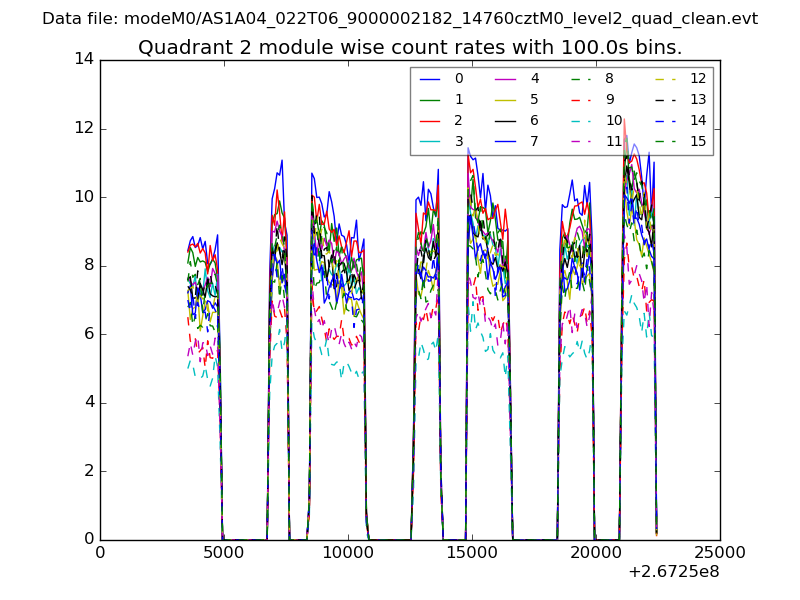
| Module-wise count rates for Quadrant B Data is divided into 100 sec bins |
 |
 |
| Module-wise count rates for Quadrant C Data is divided into 100 sec bins |
 |
 |
| Module-wise count rates for Quadrant D Data is divided into 100 sec bins |
 |
 |
| Parameter | Plot |
|---|---|
| CZT HV Monitor | 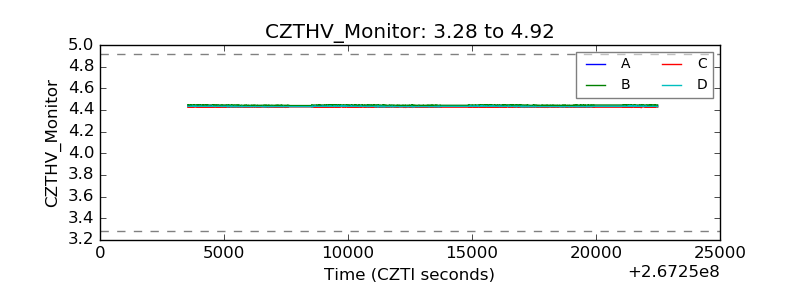 |
| D_VDD |  |
| Temperature 1 | 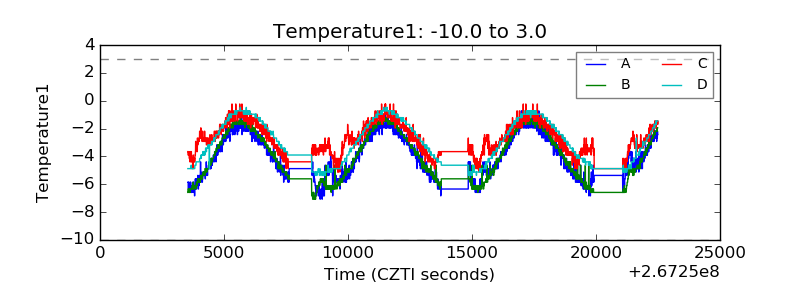 |
| Veto HV Monitor | 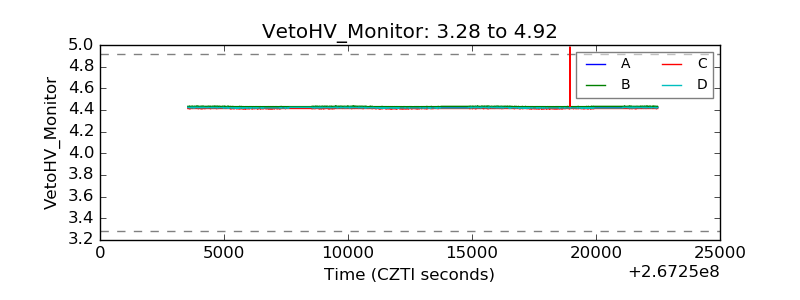 |
| Veto LLD | 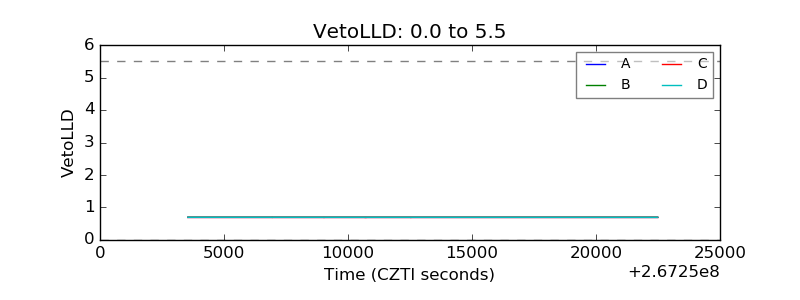 |
| Alpha Counter | 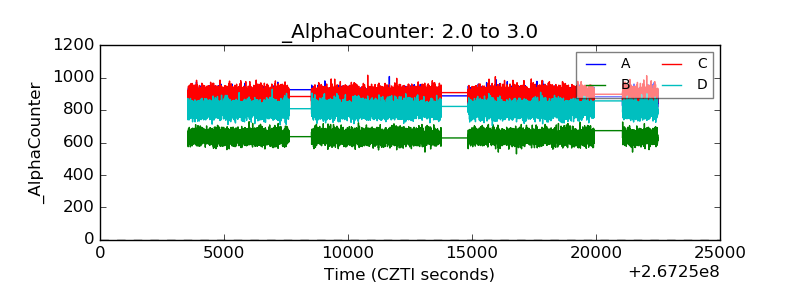 |
| _CPM_Rate | 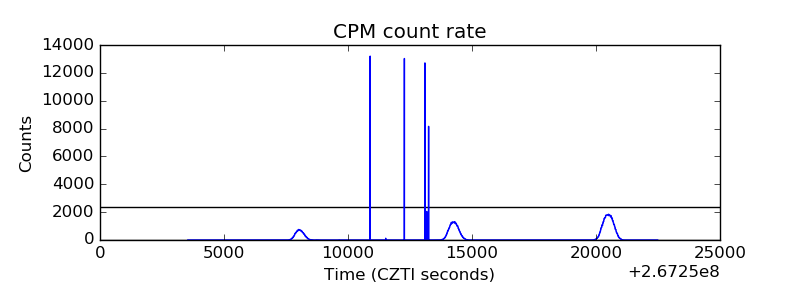 |
| CZT Counter | 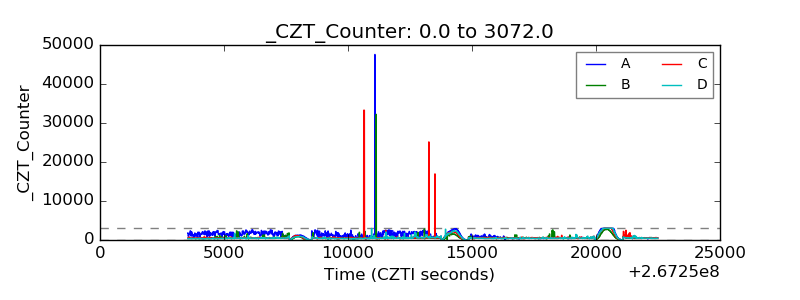 |
| +2.5 Volts monitor |  |
| +5 Volts monitor |  |
| _ROLL_ROT | 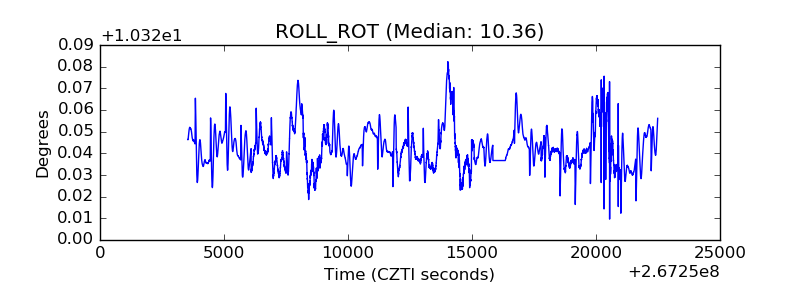 |
| _Roll_DEC | 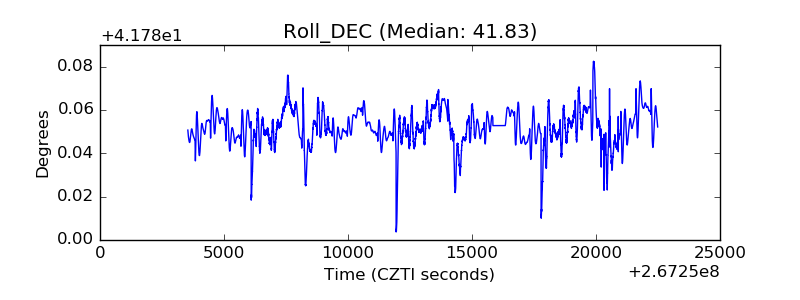 |
| _Roll_RA | 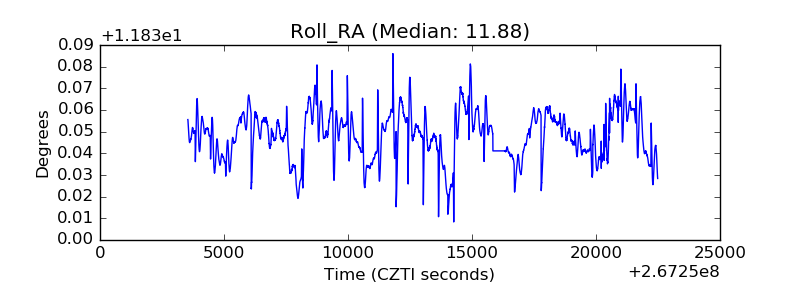 |
| Veto Counter | 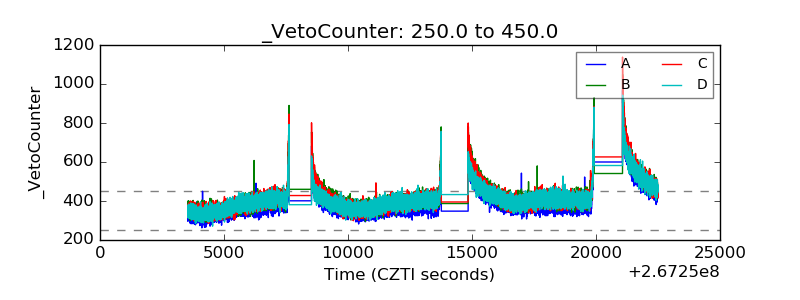 |