| Param | Original file | Final file |
|---|---|---|
| Filename | modeM0/AS1A04_022T06_9000002182_14763cztM0_level2.evt | modeM0/AS1A04_022T06_9000002182_14763cztM0_level2_quad_clean.evt |
| Size (bytes) | 497,880,000 | 79,142,400 |
| Size | 474.8 MB | 75.5 MB |
| Events in quadrant A | 3,352,281 | 503,186 |
| Events in quadrant B | 3,401,041 | 499,980 |
| Events in quadrant C | 4,117,212 | 479,143 |
| Events in quadrant D | 3,782,848 | 476,924 |
| Mode SS | |||
|---|---|---|---|
| Quadrant | BADHDUFLAG | Total packets | Discarded packets |
| A | 0 | 128 | 0 |
| B | 0 | 128 | 0 |
| C | 0 | 128 | 0 |
| D | 0 | 128 | 0 |
| Mode M0 | |||
|---|---|---|---|
| Quadrant | BADHDUFLAG | Total packets | Discarded packets |
| A | 0 | 13625 | 2 |
| B | 0 | 13785 | 1 |
| C | 0 | 16272 | 1 |
| D | 0 | 15088 | 1 |
| Mode M9 | |||
|---|---|---|---|
| Quadrant | BADHDUFLAG | Total packets | Discarded packets |
| A | 0 | 14 | 0 |
| B | 0 | 14 | 0 |
| C | 0 | 14 | 0 |
| D | 0 | 14 | 0 |
| Quadrant | Total seconds | Saturated seconds | Saturation percentage |
|---|---|---|---|
| A | 6263 | 55 | 0.878173% |
| B | 6263 | 54 | 0.862207% |
| C | 6263 | 167 | 2.666454% |
| D | 6263 | 117 | 1.868114% |
Noise dominated data is calculated using 1-second bins in cleaned event files. If a bin has >2000 counts, and if more than 50% of those come from <1% of pixels, then it is considered to be noise-dominated and hence unusable.
| Quadrant | # 1 sec bins | Bins with >0 counts | Bins with >2000 counts | High rate bins dominated by noise | Noise dominated (total time) | Noise dominated (detector-on time) | Marked lightcurve |
|---|---|---|---|---|---|---|---|
| A | 7624 | 6265 | 0 | 0 | 0.00% | 0.00% | 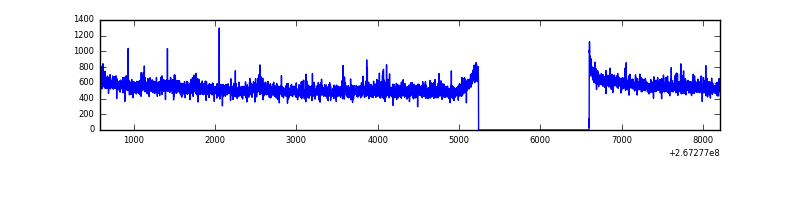 |
| B | 7624 | 6265 | 2 | 2 | 0.03% | 0.03% | 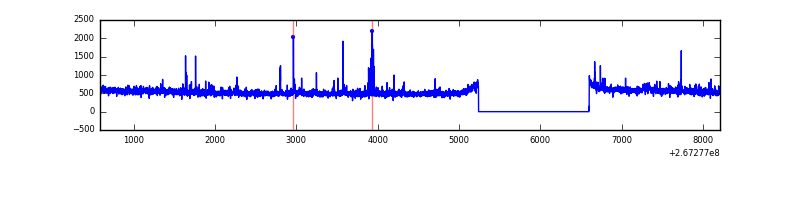 |
| C | 7624 | 6265 | 116 | 116 | 1.52% | 1.85% | 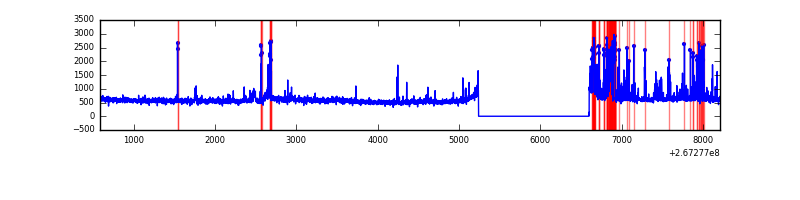 |
| D | 7624 | 6265 | 73 | 73 | 0.96% | 1.17% | 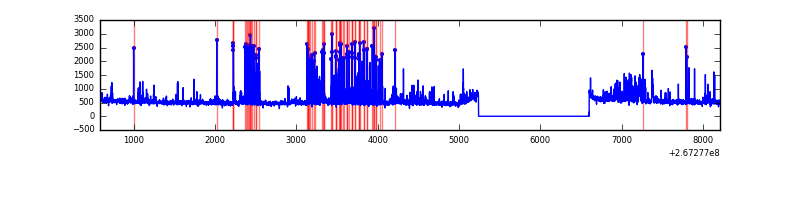 |
Top three noisy pixels from each quadrant. If the there are fewer than three noisy pixels in the level2.evt file, extra rows are filled as -1
| Pixel properties | Quadrant properties | ||||||
|---|---|---|---|---|---|---|---|
| Quadrant | DetID | PixID | Counts | Sigma | Mean | Median | Sigma |
| A | 12 | 189 | 60588 | 351.85 | 848 | 834 | 169.8 |
| A | 14 | 237 | 23086 | 131.03 | 848 | 834 | 169.8 |
| A | 0 | 226 | 7731 | 40.61 | 848 | 834 | 169.8 |
| B | 4 | 142 | 43410 | 277.63 | 831 | 814 | 153.4 |
| B | 0 | 229 | 32542 | 206.8 | 831 | 814 | 153.4 |
| B | 0 | 214 | 23956 | 150.84 | 831 | 814 | 153.4 |
| C | 4 | 254 | 513127 | 2864.76 | 796 | 803 | 178.8 |
| C | 3 | 233 | 452654 | 2526.61 | 796 | 803 | 178.8 |
| C | 0 | 207 | 29073 | 158.08 | 796 | 803 | 178.8 |
| D | 5 | 222 | 572808 | 2805.55 | 812 | 793 | 203.9 |
| D | 2 | 120 | 34846 | 167.02 | 812 | 793 | 203.9 |
| D | 2 | 234 | 30874 | 147.54 | 812 | 793 | 203.9 |
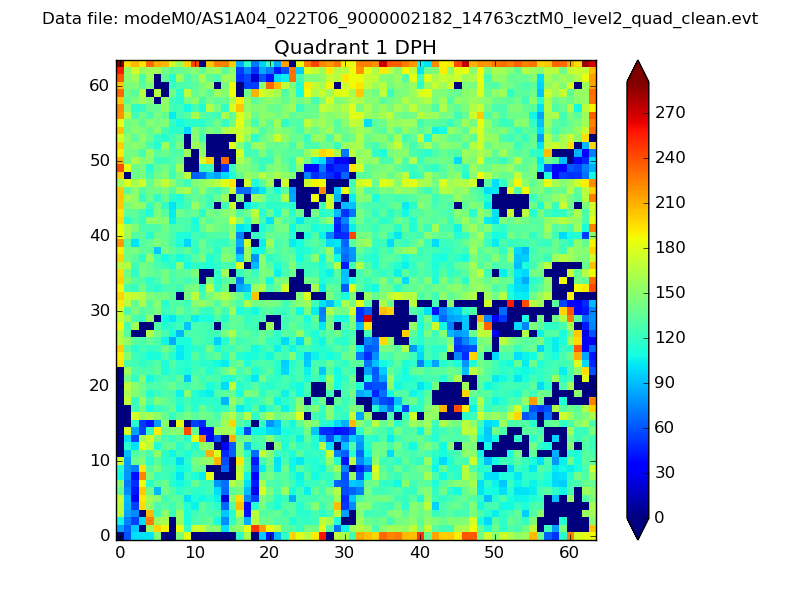
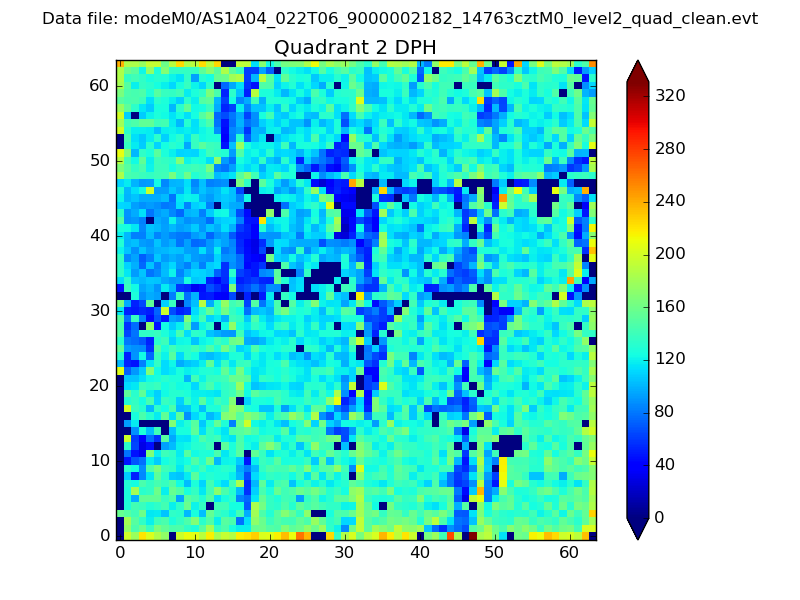
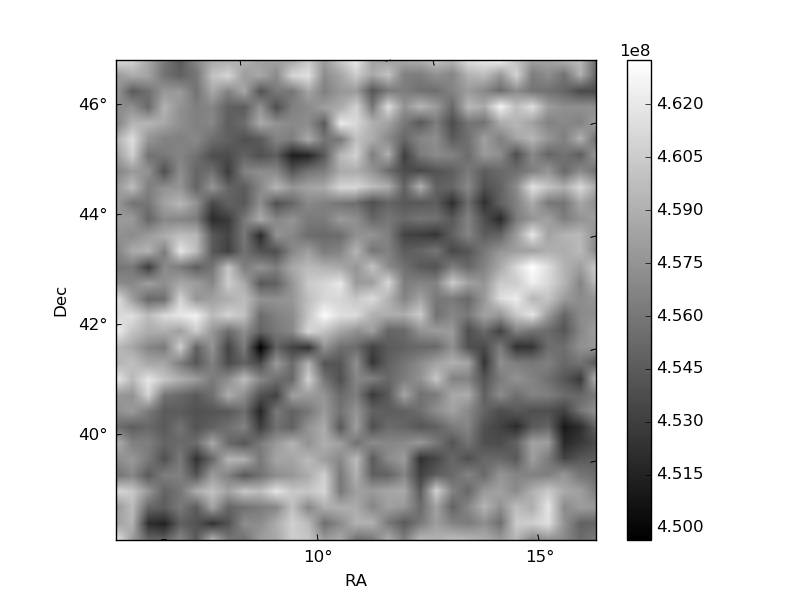
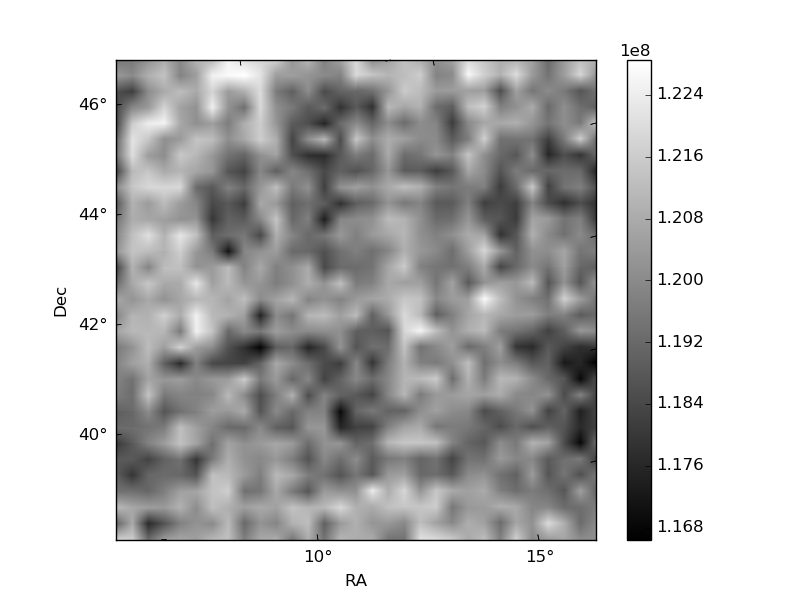
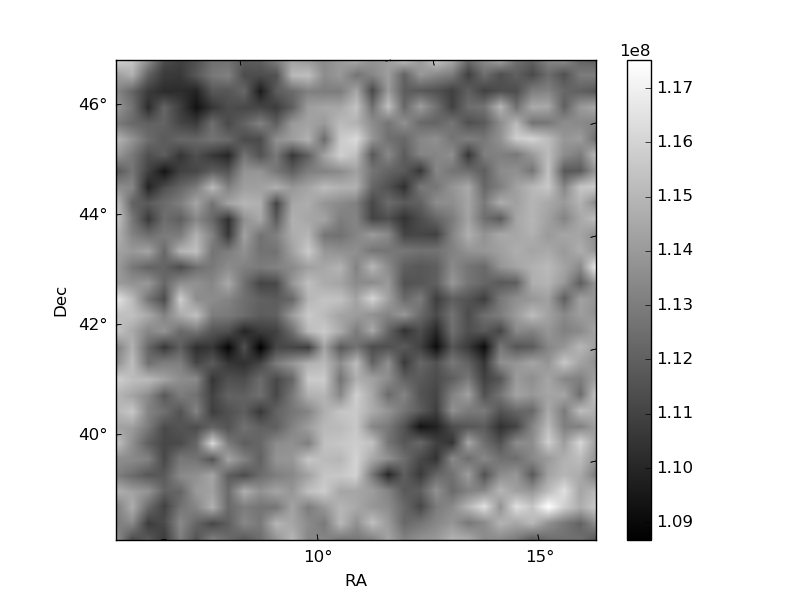
Histogram calculated using DETX and DETY for each event in the final _common_clean file
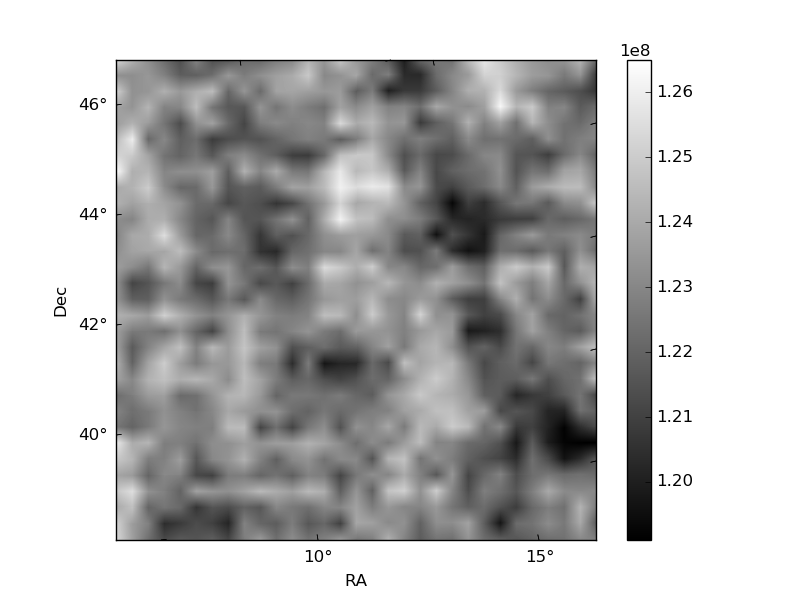
| Quadrant A |  |
 |
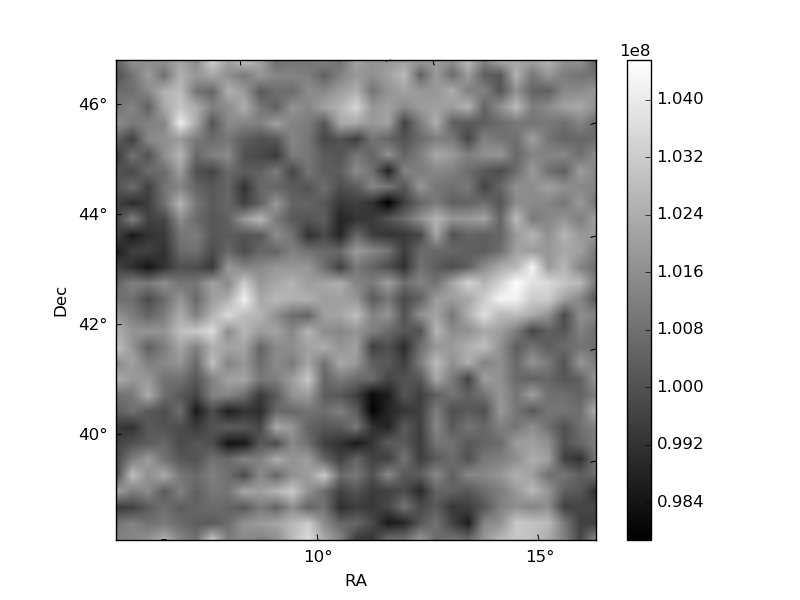
Quadrant B |
|---|---|---|---|
| Quadrant D | 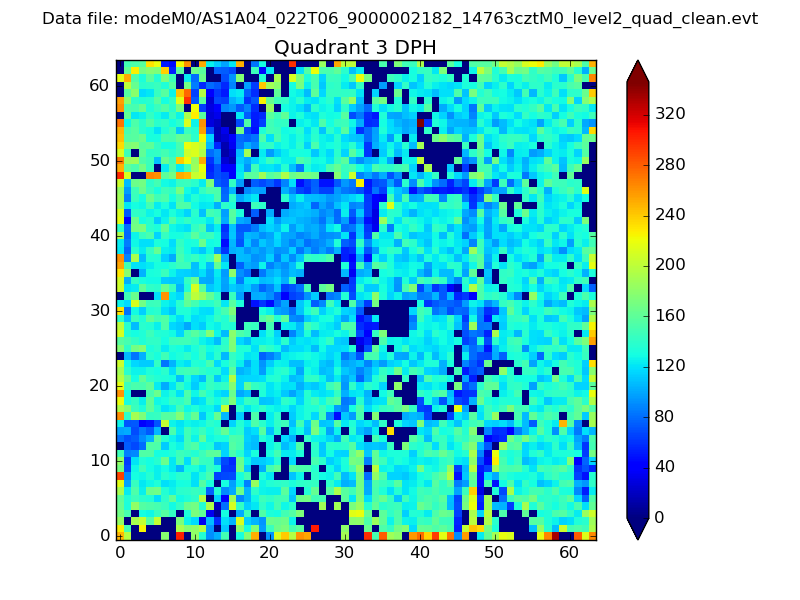 |
 |
Quadrant C |
| Plot type | Count rate plots | Images |
|---|---|---|
| Comparison with Poisson distribution Blue bars denote a histogram of data divided into 1 sec bins. Red curve is a Poisson curve with rate = median count rate of data. |
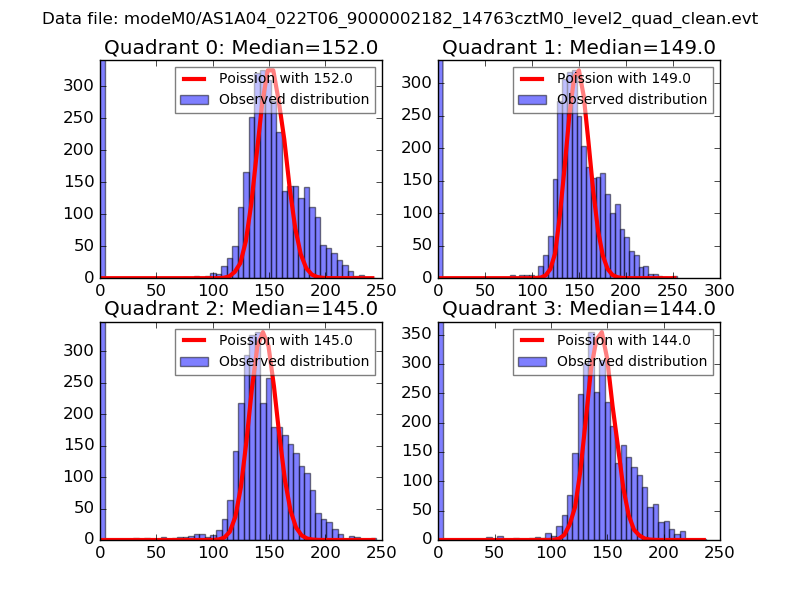 |
 |
| Quadrant-wise count rates Data is divided into 100 sec bins |
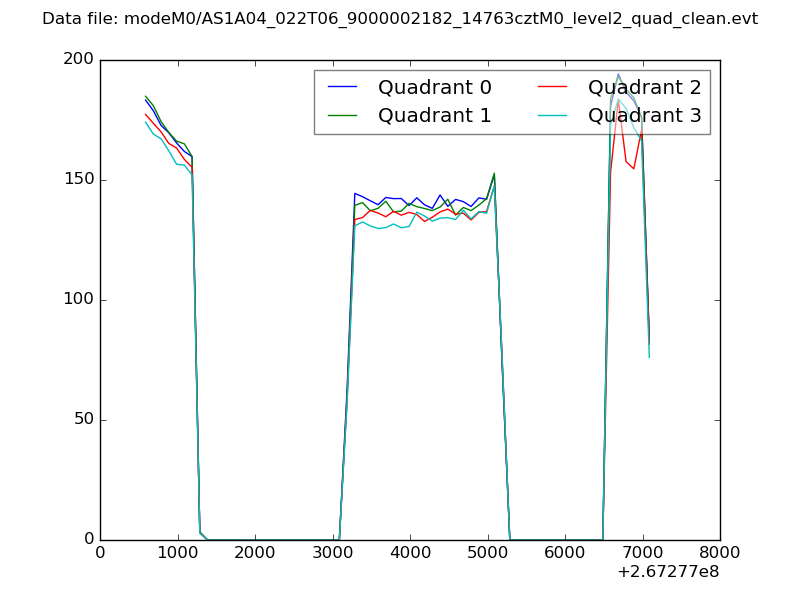 |
|
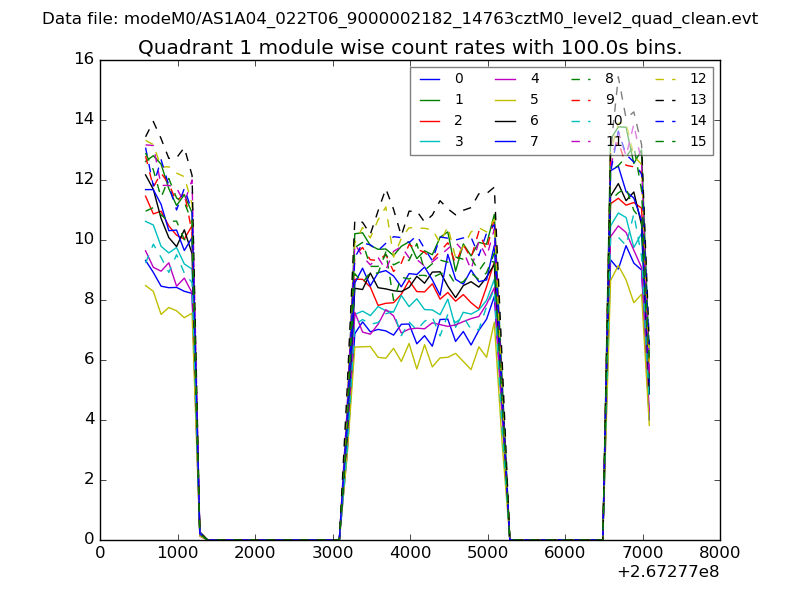
| Module-wise count rates for Quadrant A Data is divided into 100 sec bins |
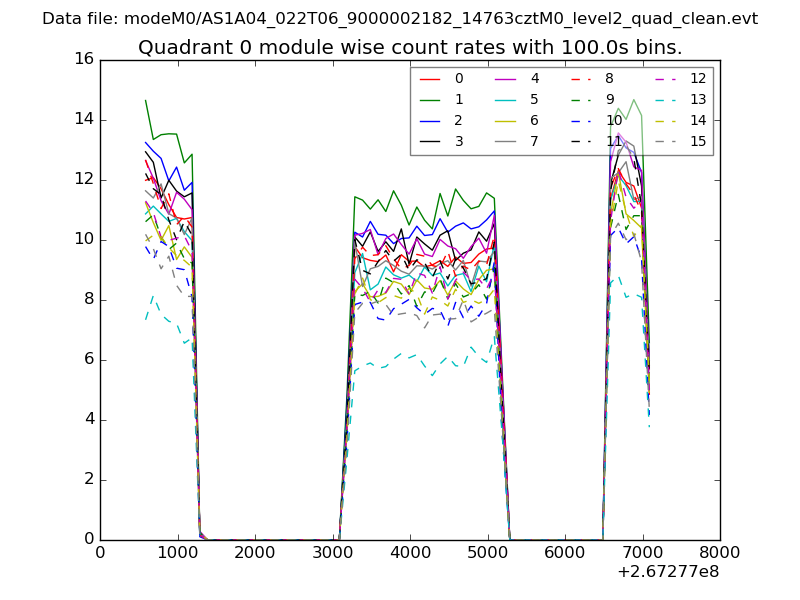 |
 |
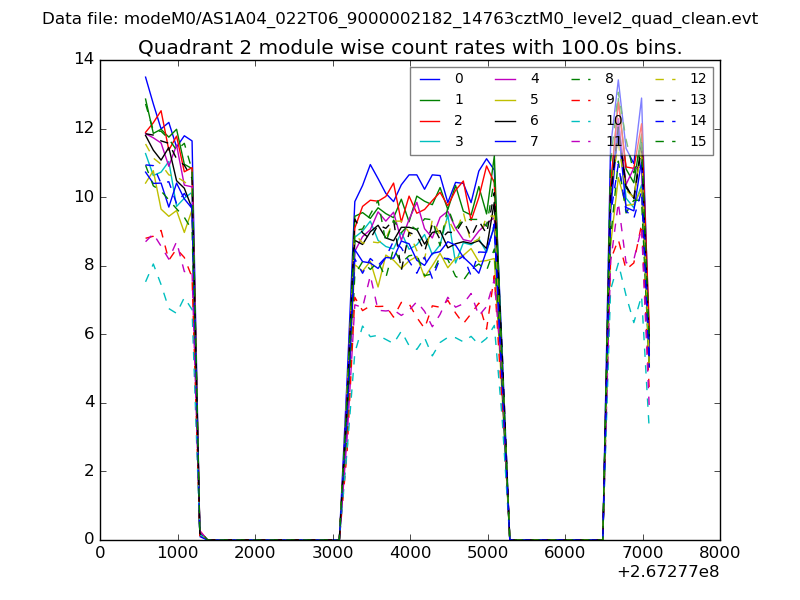
| Module-wise count rates for Quadrant B Data is divided into 100 sec bins |
 |
 |
| Module-wise count rates for Quadrant C Data is divided into 100 sec bins |
 |
 |
| Module-wise count rates for Quadrant D Data is divided into 100 sec bins |
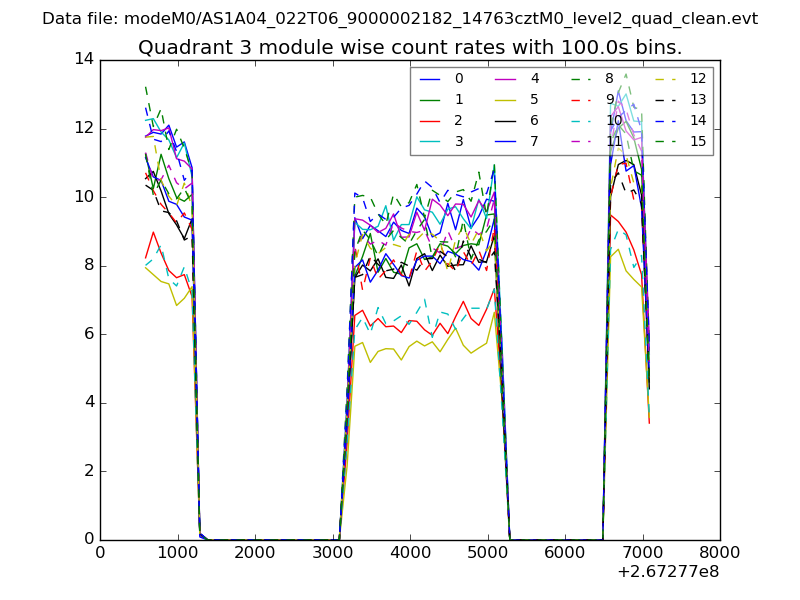 |
 |
| Parameter | Plot |
|---|---|
| CZT HV Monitor | 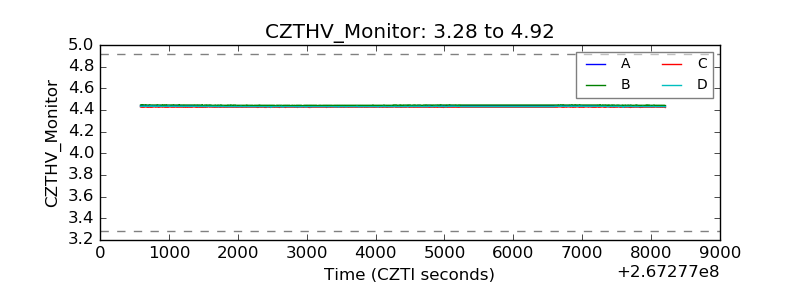 |
| D_VDD | 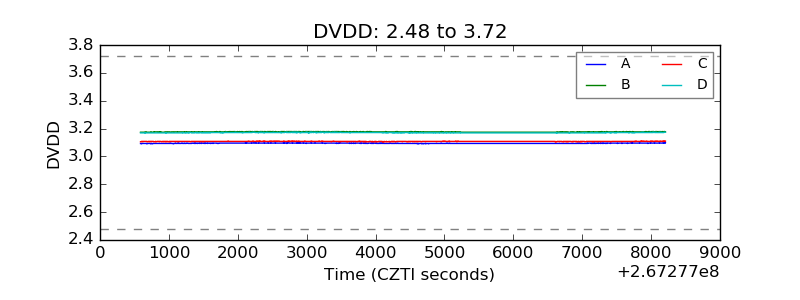 |
| Temperature 1 | 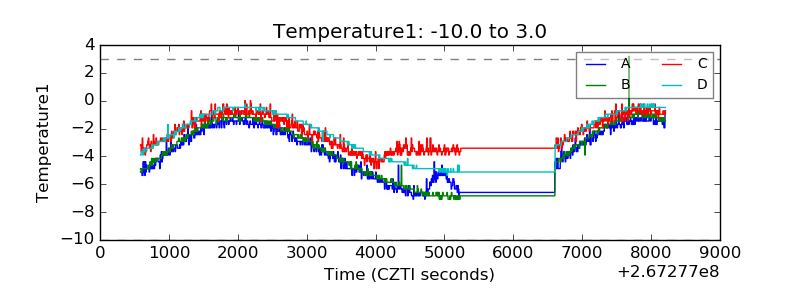 |
| Veto HV Monitor |  |
| Veto LLD |  |
| Alpha Counter | 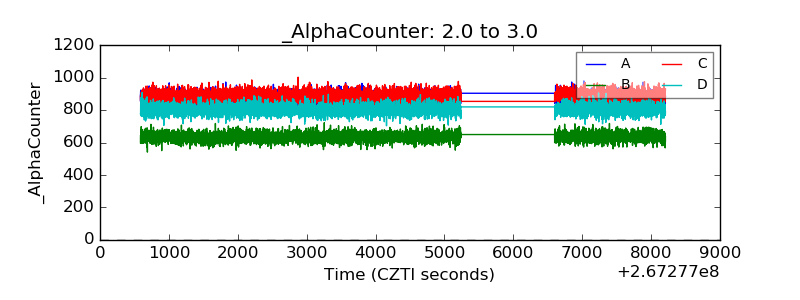 |
| _CPM_Rate | 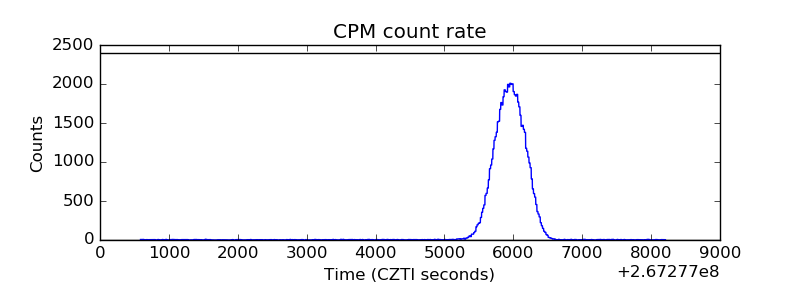 |
| CZT Counter | 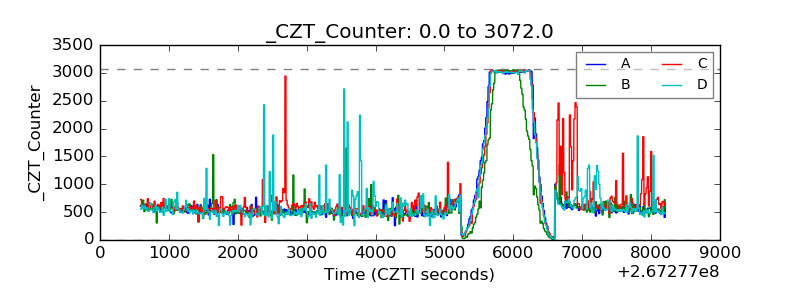 |
| +2.5 Volts monitor |  |
| +5 Volts monitor |  |
| _ROLL_ROT | 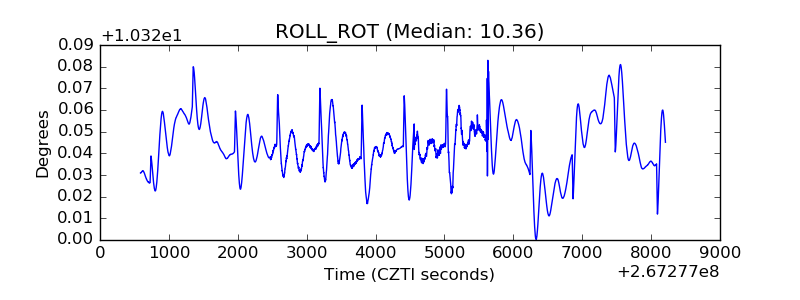 |
| _Roll_DEC | 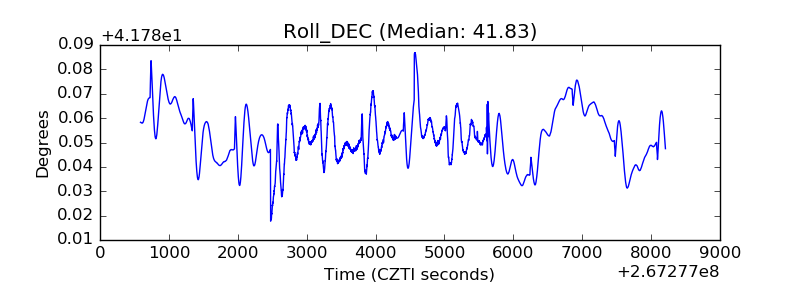 |
| _Roll_RA | 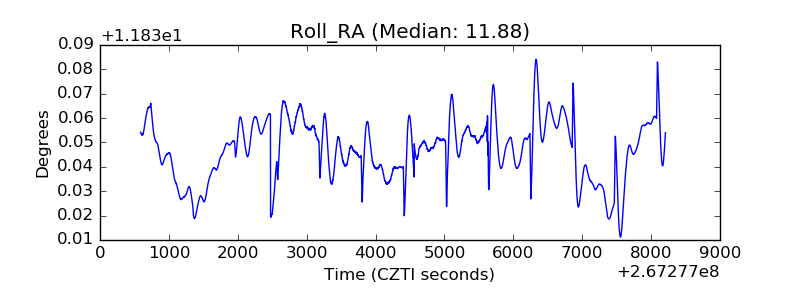 |
| Veto Counter | 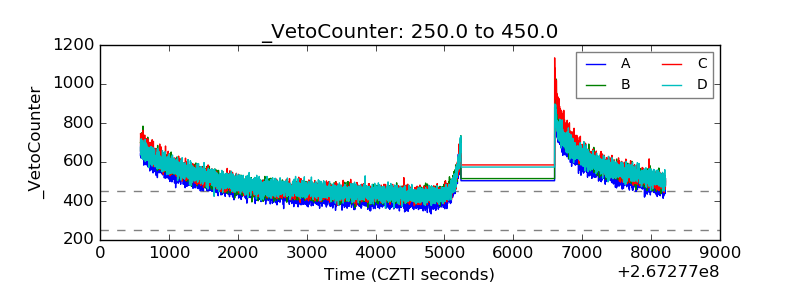 |