| Param | Original file | Final file |
|---|---|---|
| Filename | modeM0/AS1A04_022T06_9000002182_14764cztM0_level2.evt | modeM0/AS1A04_022T06_9000002182_14764cztM0_level2_quad_clean.evt |
| Size (bytes) | 542,894,400 | 64,359,360 |
| Size | 517.7 MB | 61.4 MB |
| Events in quadrant A | 4,406,012 | 388,917 |
| Events in quadrant B | 3,291,665 | 388,703 |
| Events in quadrant C | 4,892,493 | 375,050 |
| Events in quadrant D | 3,442,684 | 374,962 |
| Mode SS | |||
|---|---|---|---|
| Quadrant | BADHDUFLAG | Total packets | Discarded packets |
| A | 0 | 122 | 0 |
| B | 0 | 122 | 0 |
| C | 0 | 122 | 0 |
| D | 0 | 122 | 0 |
| Mode M0 | |||
|---|---|---|---|
| Quadrant | BADHDUFLAG | Total packets | Discarded packets |
| A | 0 | 16694 | 2 |
| B | 0 | 13407 | 1 |
| C | 0 | 18650 | 1 |
| D | 0 | 13866 | 1 |
| Mode M9 | |||
|---|---|---|---|
| Quadrant | BADHDUFLAG | Total packets | Discarded packets |
| A | 0 | 13 | 0 |
| B | 0 | 13 | 0 |
| C | 0 | 13 | 0 |
| D | 0 | 13 | 0 |
| Quadrant | Total seconds | Saturated seconds | Saturation percentage |
|---|---|---|---|
| A | 6029 | 718 | 11.909106% |
| B | 6029 | 95 | 1.575717% |
| C | 6029 | 666 | 11.046608% |
| D | 6029 | 152 | 2.521148% |
Noise dominated data is calculated using 1-second bins in cleaned event files. If a bin has >2000 counts, and if more than 50% of those come from <1% of pixels, then it is considered to be noise-dominated and hence unusable.
| Quadrant | # 1 sec bins | Bins with >0 counts | Bins with >2000 counts | High rate bins dominated by noise | Noise dominated (total time) | Noise dominated (detector-on time) | Marked lightcurve |
|---|---|---|---|---|---|---|---|
| A | 7365 | 6031 | 585 | 585 | 7.94% | 9.70% | 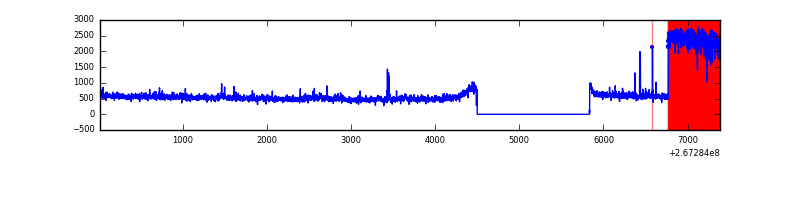 |
| B | 7365 | 6031 | 3 | 3 | 0.04% | 0.05% | 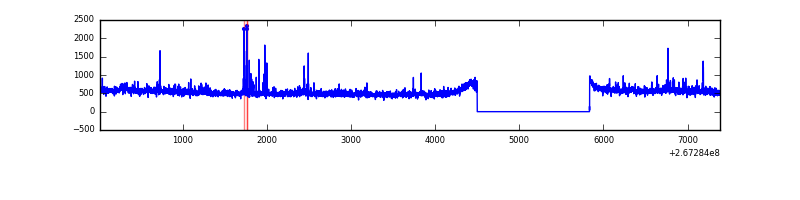 |
| C | 7365 | 6031 | 410 | 410 | 5.57% | 6.80% | 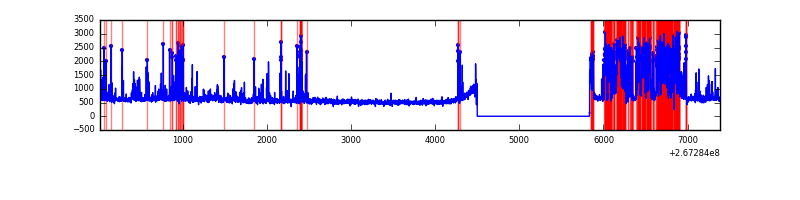 |
| D | 7365 | 6031 | 71 | 71 | 0.96% | 1.18% | 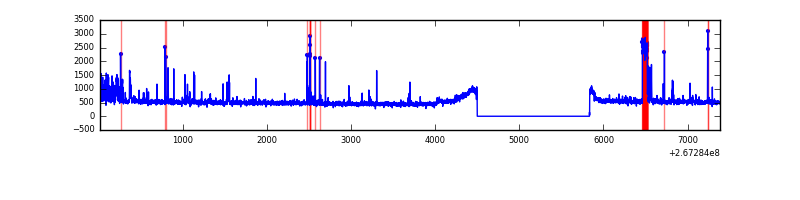 |
Top three noisy pixels from each quadrant. If the there are fewer than three noisy pixels in the level2.evt file, extra rows are filled as -1
| Pixel properties | Quadrant properties | ||||||
|---|---|---|---|---|---|---|---|
| Quadrant | DetID | PixID | Counts | Sigma | Mean | Median | Sigma |
| A | 14 | 237 | 1433068 | 9618.79 | 741 | 727 | 148.9 |
| A | 12 | 189 | 66430 | 441.22 | 741 | 727 | 148.9 |
| A | 0 | 23 | 45532 | 300.88 | 741 | 727 | 148.9 |
| B | 0 | 229 | 29691 | 195.94 | 801 | 786 | 147.5 |
| B | 0 | 156 | 26525 | 174.48 | 801 | 786 | 147.5 |
| B | 0 | 219 | 23870 | 156.48 | 801 | 786 | 147.5 |
| C | 4 | 254 | 1481932 | 8945.12 | 735 | 741 | 165.6 |
| C | 3 | 233 | 460153 | 2774.45 | 735 | 741 | 165.6 |
| C | 0 | 207 | 67052 | 400.46 | 735 | 741 | 165.6 |
| D | 5 | 222 | 238882 | 1224.98 | 781 | 759 | 194.4 |
| D | 2 | 69 | 66056 | 335.91 | 781 | 759 | 194.4 |
| D | 9 | 1 | 34384 | 172.98 | 781 | 759 | 194.4 |
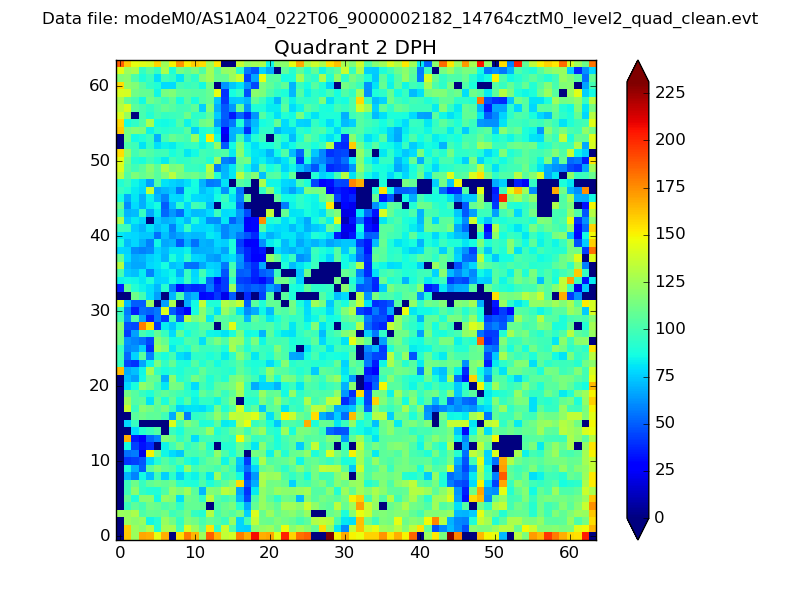
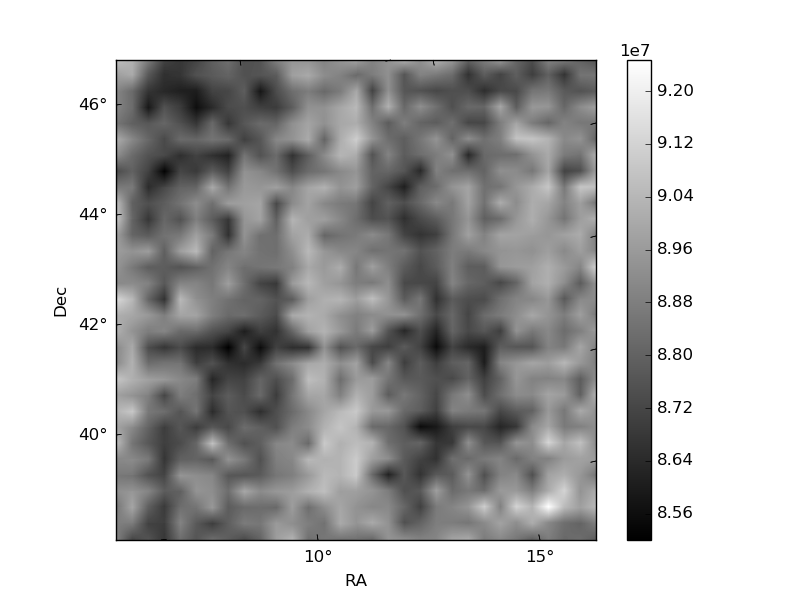
Histogram calculated using DETX and DETY for each event in the final _common_clean file
| Quadrant A | 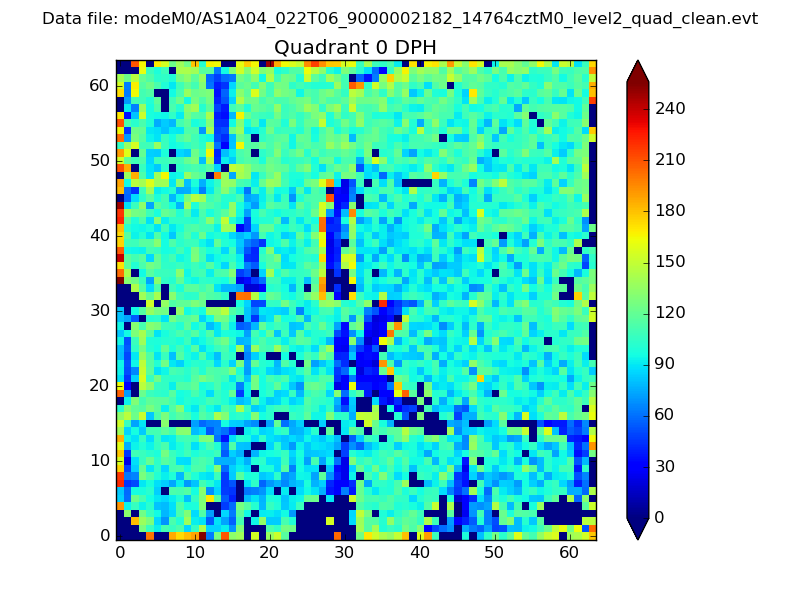 |
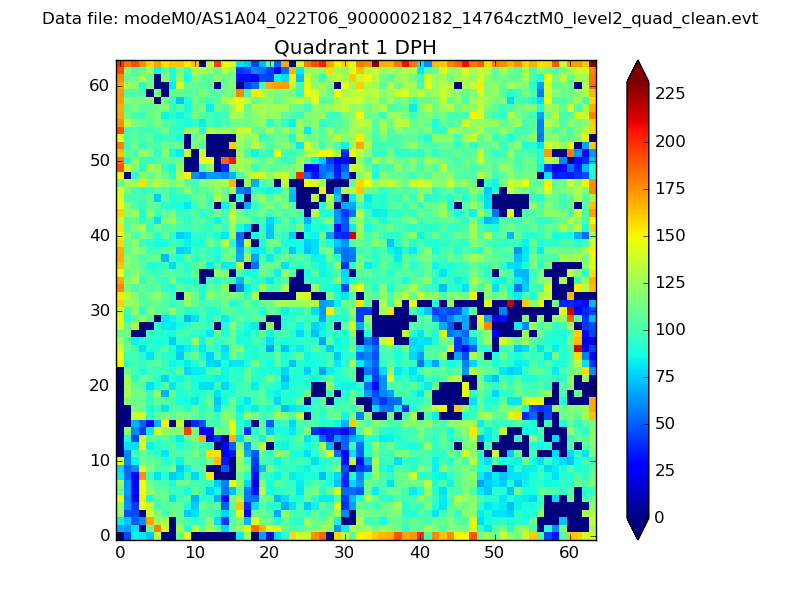 |
Quadrant B |
|---|---|---|---|
| Quadrant D | 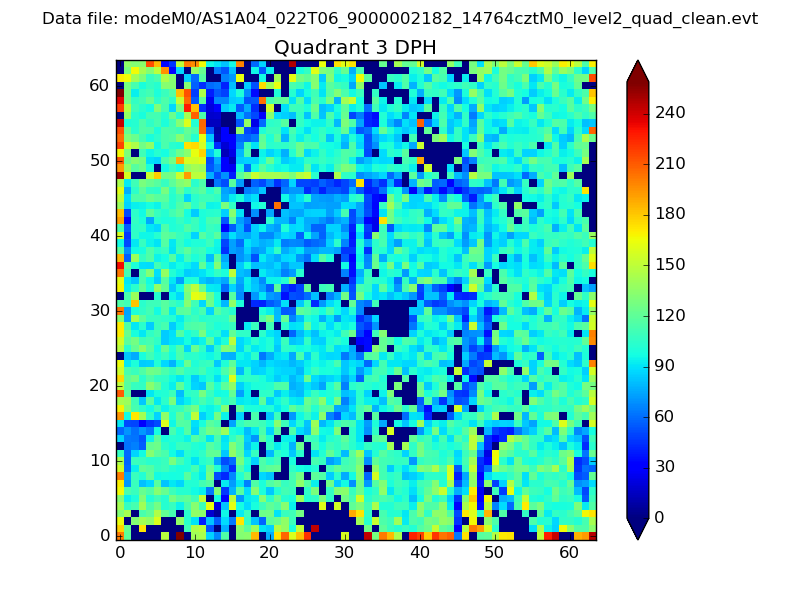 |
 |
Quadrant C |
| Plot type | Count rate plots | Images |
|---|---|---|
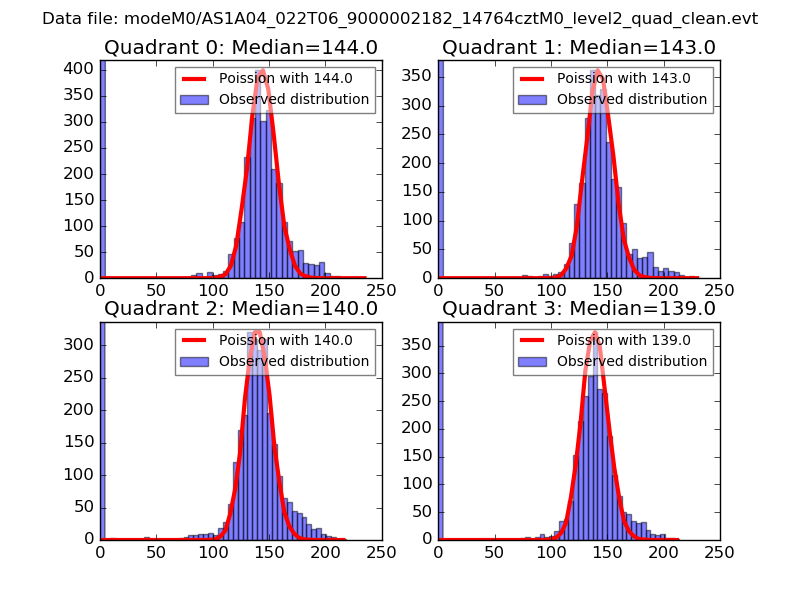
| Comparison with Poisson distribution Blue bars denote a histogram of data divided into 1 sec bins. Red curve is a Poisson curve with rate = median count rate of data. |
 |
 |
| Quadrant-wise count rates Data is divided into 100 sec bins |
 |
|
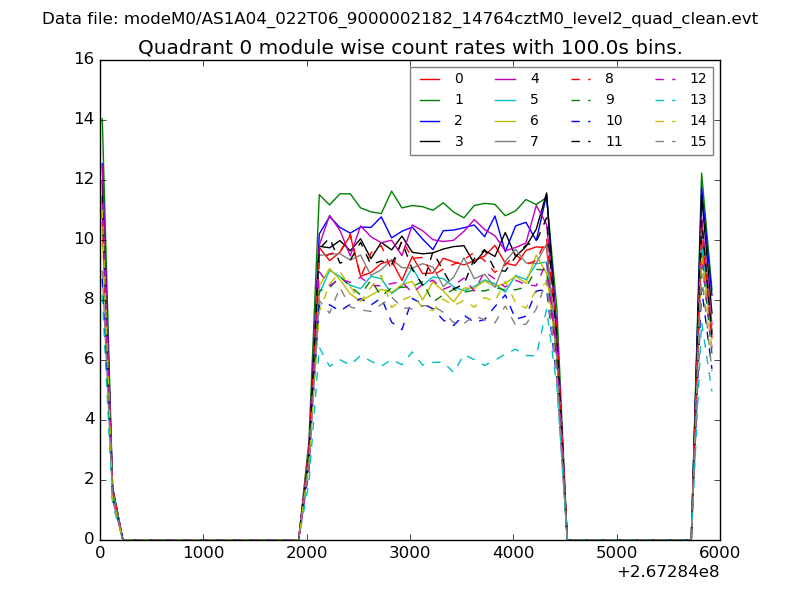
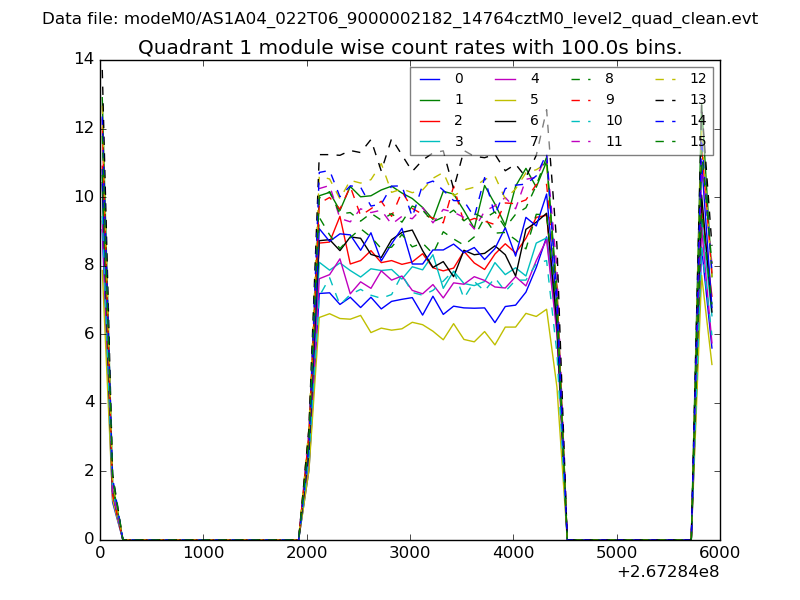
| Module-wise count rates for Quadrant A Data is divided into 100 sec bins |
 |
 |
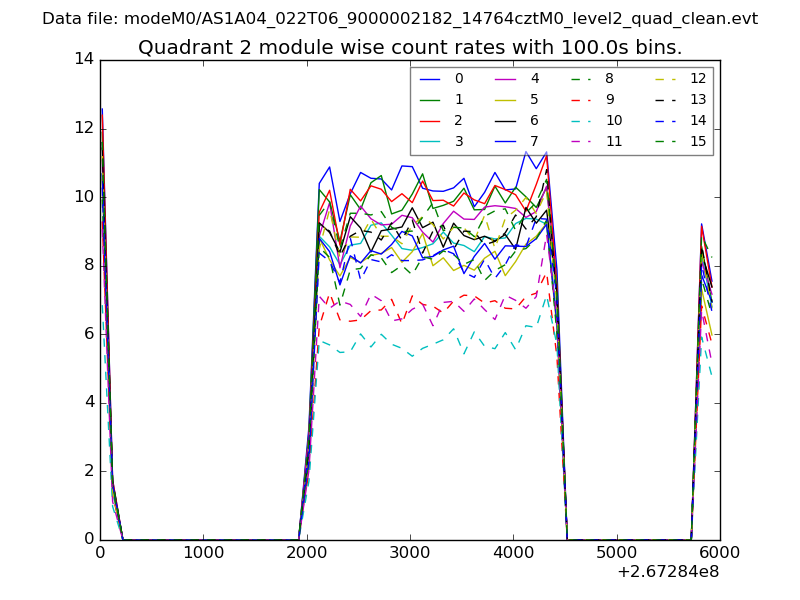
| Module-wise count rates for Quadrant B Data is divided into 100 sec bins |
 |
 |
| Module-wise count rates for Quadrant C Data is divided into 100 sec bins |
 |
 |
| Module-wise count rates for Quadrant D Data is divided into 100 sec bins |
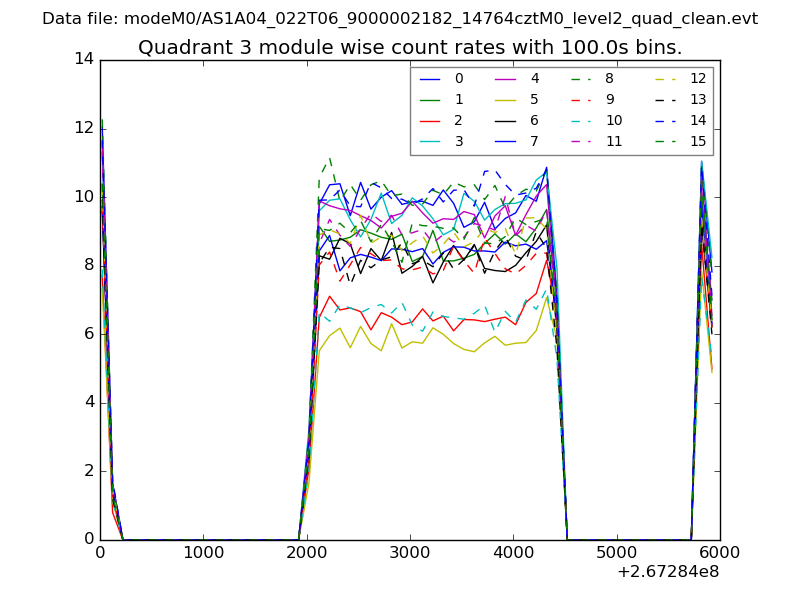 |
 |
| Parameter | Plot |
|---|---|
| CZT HV Monitor | 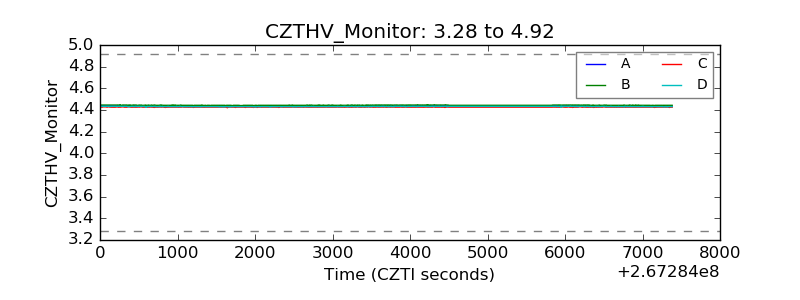 |
| D_VDD | 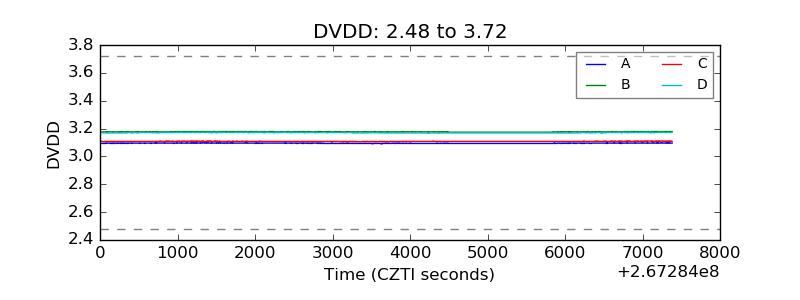 |
| Temperature 1 | 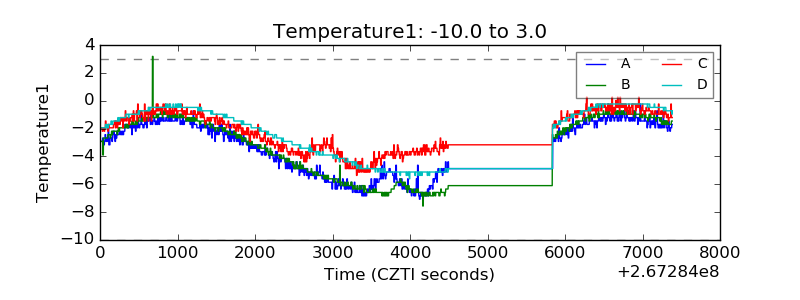 |
| Veto HV Monitor | 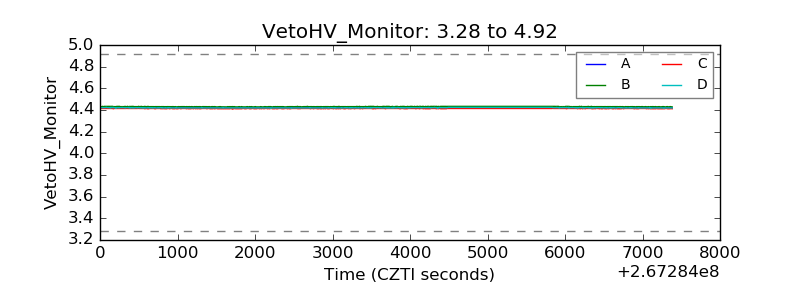 |
| Veto LLD | 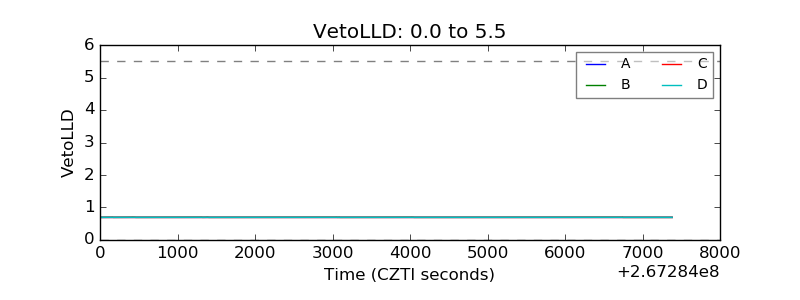 |
| Alpha Counter |  |
| _CPM_Rate |  |
| CZT Counter | 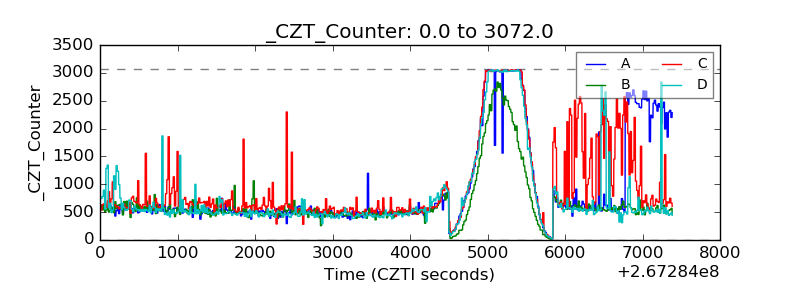 |
| +2.5 Volts monitor |  |
| +5 Volts monitor |  |
| _ROLL_ROT | 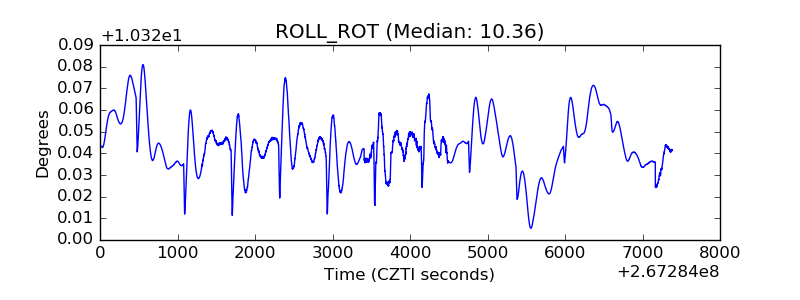 |
| _Roll_DEC | 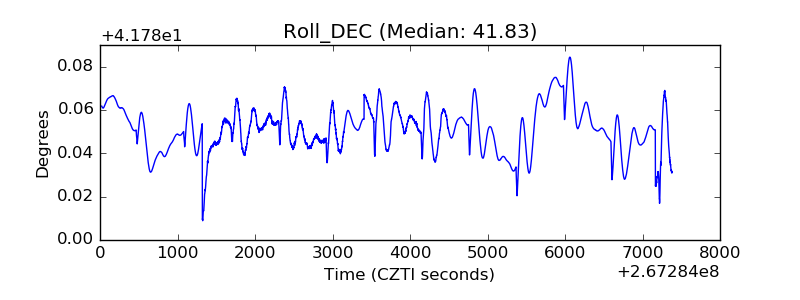 |
| _Roll_RA | 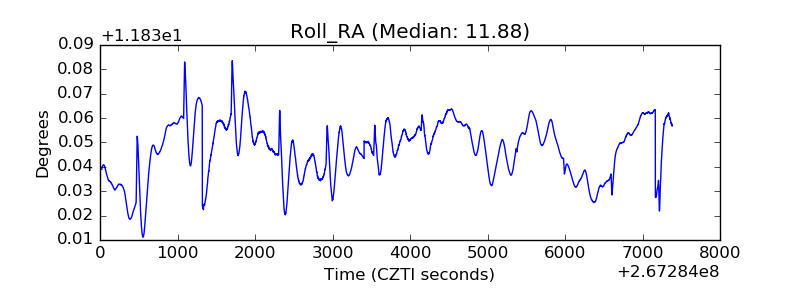 |
| Veto Counter | 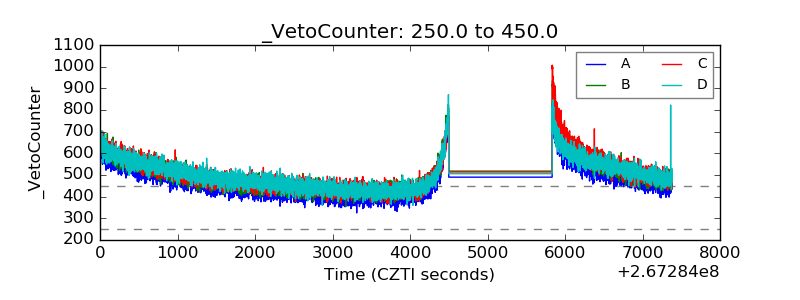 |