| Param | Original file | Final file |
|---|---|---|
| Filename | modeM0/AS1A04_022T06_9000002182_14765cztM0_level2.evt | modeM0/AS1A04_022T06_9000002182_14765cztM0_level2_quad_clean.evt |
| Size (bytes) | 639,708,480 | 70,562,880 |
| Size | 610.1 MB | 67.3 MB |
| Events in quadrant A | 6,101,459 | 413,599 |
| Events in quadrant B | 3,550,729 | 430,854 |
| Events in quadrant C | 5,742,121 | 414,156 |
| Events in quadrant D | 3,534,701 | 420,260 |
| Mode SS | |||
|---|---|---|---|
| Quadrant | BADHDUFLAG | Total packets | Discarded packets |
| A | 0 | 134 | 0 |
| B | 0 | 134 | 0 |
| C | 0 | 134 | 0 |
| D | 0 | 134 | 0 |
| Mode M0 | |||
|---|---|---|---|
| Quadrant | BADHDUFLAG | Total packets | Discarded packets |
| A | 0 | 22577 | 3 |
| B | 0 | 14578 | 2 |
| C | 0 | 21548 | 2 |
| D | 0 | 14591 | 2 |
| Mode M9 | |||
|---|---|---|---|
| Quadrant | BADHDUFLAG | Total packets | Discarded packets |
| A | 0 | 13 | 0 |
| B | 0 | 13 | 0 |
| C | 0 | 13 | 0 |
| D | 0 | 14 | 0 |
| Quadrant | Total seconds | Saturated seconds | Saturation percentage |
|---|---|---|---|
| A | 6557 | 1405 | 21.427482% |
| B | 6557 | 122 | 1.860607% |
| C | 6557 | 861 | 13.131005% |
| D | 6557 | 165 | 2.516395% |
Noise dominated data is calculated using 1-second bins in cleaned event files. If a bin has >2000 counts, and if more than 50% of those come from <1% of pixels, then it is considered to be noise-dominated and hence unusable.
| Quadrant | # 1 sec bins | Bins with >0 counts | Bins with >2000 counts | High rate bins dominated by noise | Noise dominated (total time) | Noise dominated (detector-on time) | Marked lightcurve |
|---|---|---|---|---|---|---|---|
| A | 7768 | 6559 | 1237 | 1237 | 15.92% | 18.86% | 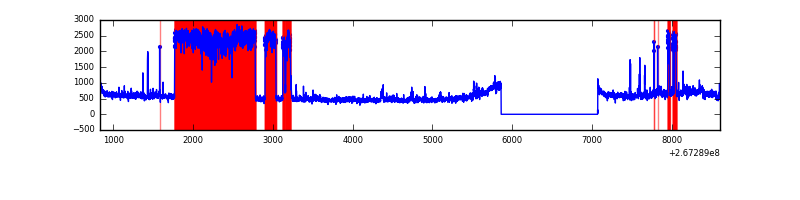 |
| B | 7768 | 6559 | 4 | 4 | 0.05% | 0.06% | 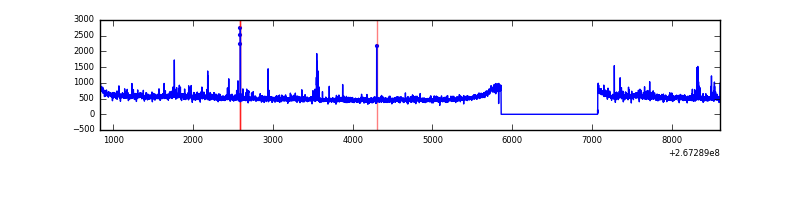 |
| C | 7768 | 6559 | 536 | 536 | 6.90% | 8.17% | 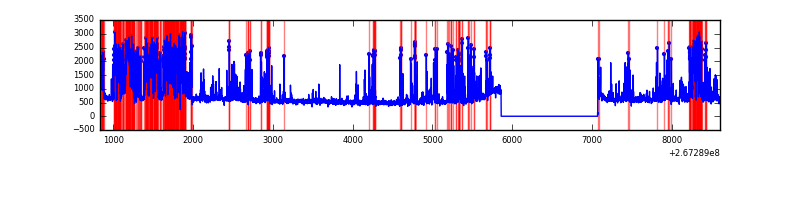 |
| D | 7768 | 6559 | 70 | 70 | 0.90% | 1.07% | 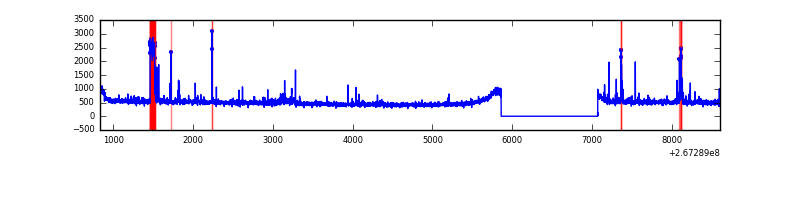 |
Top three noisy pixels from each quadrant. If the there are fewer than three noisy pixels in the level2.evt file, extra rows are filled as -1
| Pixel properties | Quadrant properties | ||||||
|---|---|---|---|---|---|---|---|
| Quadrant | DetID | PixID | Counts | Sigma | Mean | Median | Sigma |
| A | 14 | 237 | 2828454 | 18978.62 | 739 | 725 | 149.0 |
| A | 0 | 23 | 290678 | 1946.05 | 739 | 725 | 149.0 |
| A | 12 | 189 | 97513 | 649.6 | 739 | 725 | 149.0 |
| B | 4 | 142 | 37896 | 230.07 | 864 | 844 | 161.0 |
| B | 0 | 219 | 34067 | 206.3 | 864 | 844 | 161.0 |
| B | 0 | 190 | 25222 | 151.37 | 864 | 844 | 161.0 |
| C | 4 | 254 | 1996067 | 11053.36 | 789 | 794 | 180.5 |
| C | 3 | 233 | 494078 | 2732.68 | 789 | 794 | 180.5 |
| C | 0 | 207 | 158703 | 874.78 | 789 | 794 | 180.5 |
| D | 5 | 222 | 148268 | 690.99 | 843 | 821 | 213.4 |
| D | 2 | 136 | 57239 | 264.39 | 843 | 821 | 213.4 |
| D | 13 | 172 | 49605 | 228.62 | 843 | 821 | 213.4 |
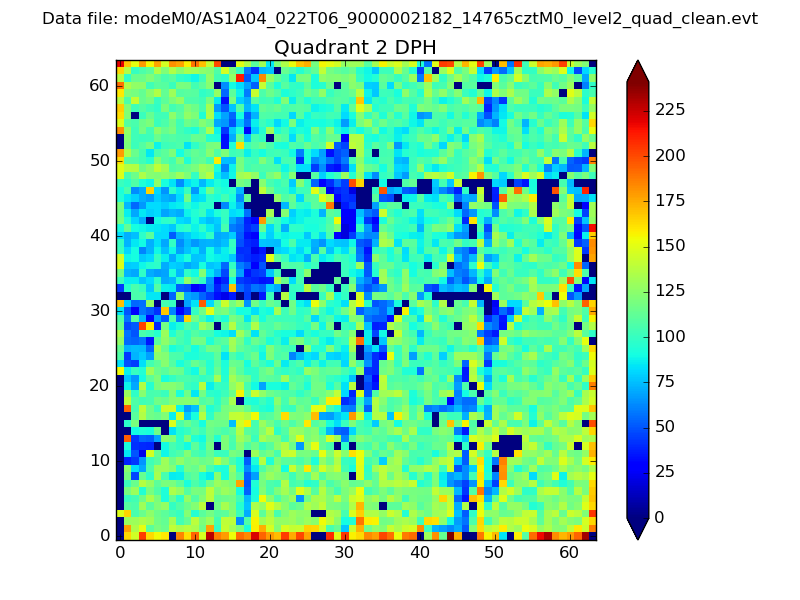
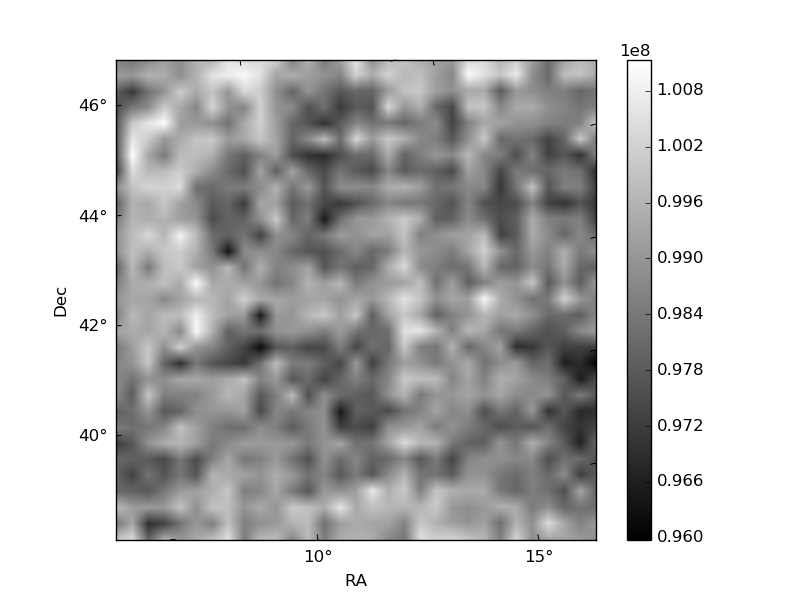
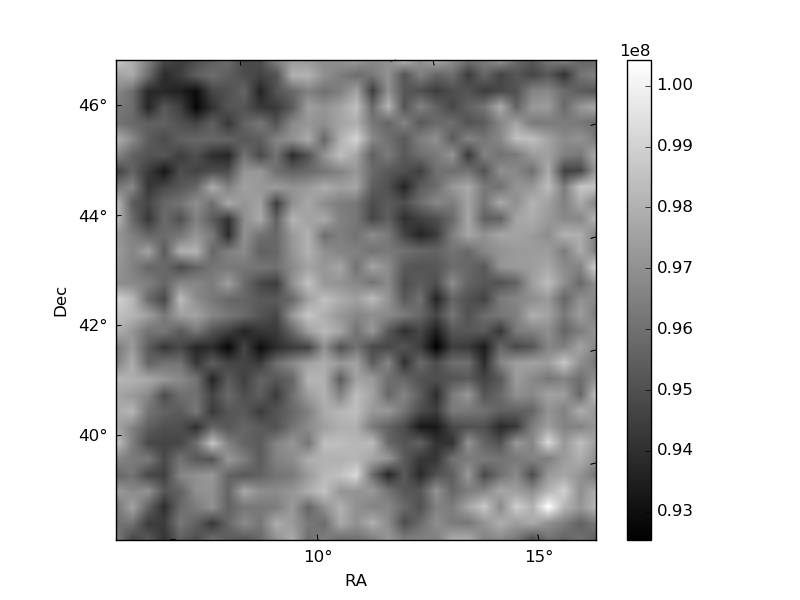
Histogram calculated using DETX and DETY for each event in the final _common_clean file
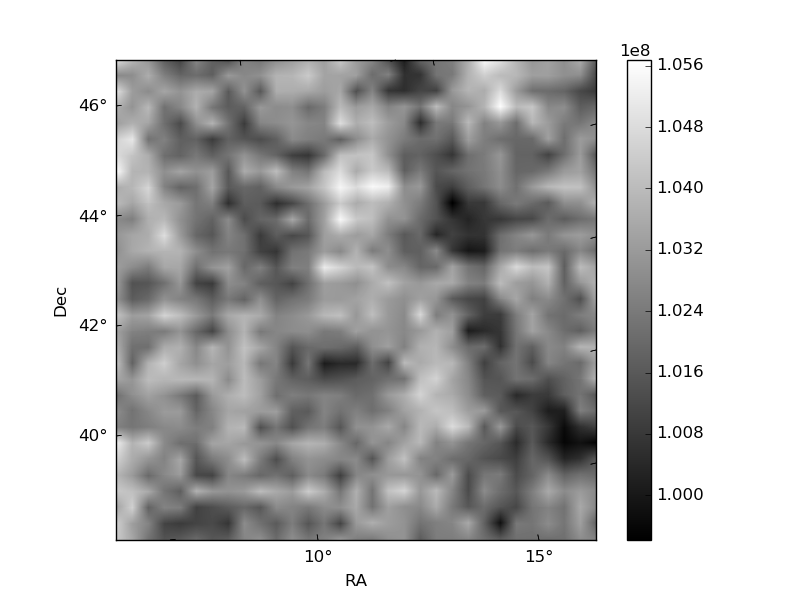
| Quadrant A | 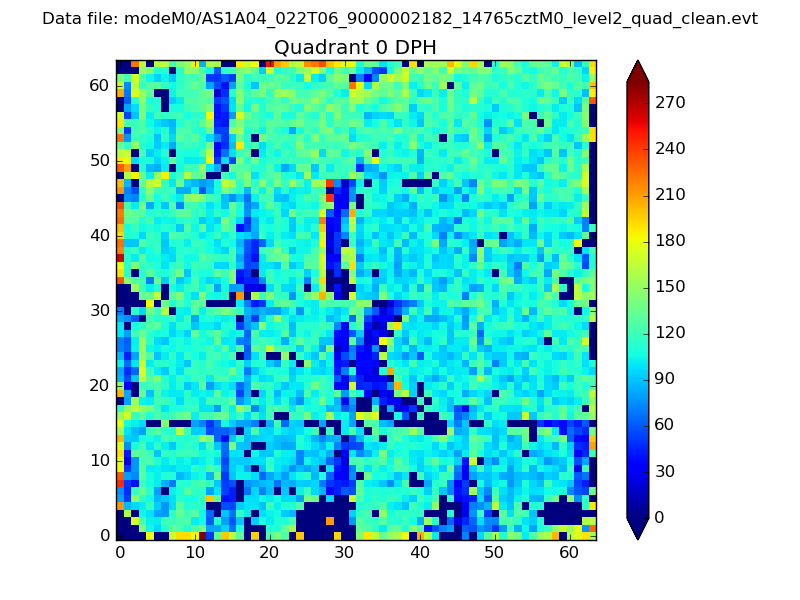 |
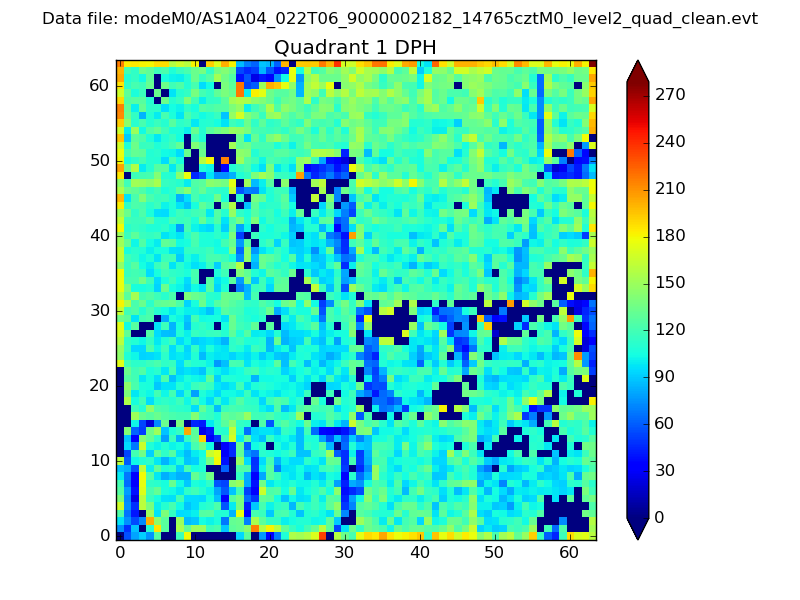 |
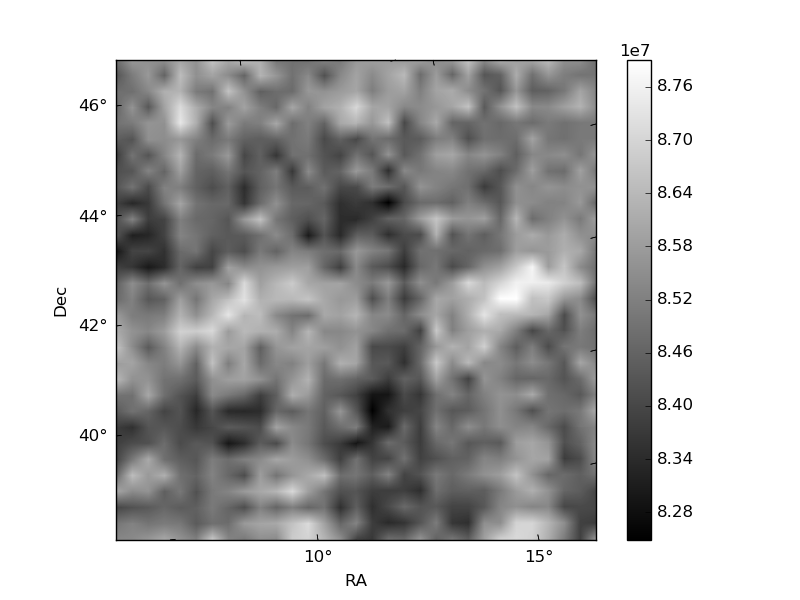
Quadrant B |
|---|---|---|---|
| Quadrant D | 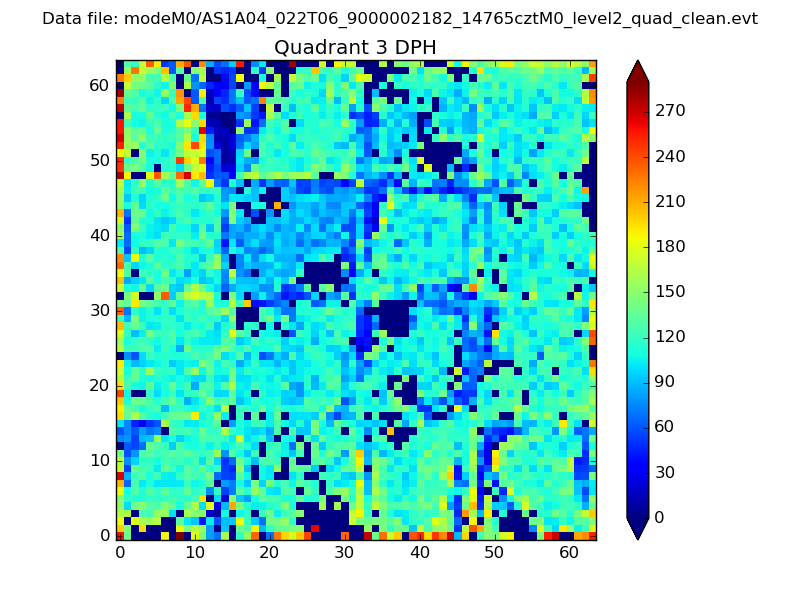 |
 |
Quadrant C |
| Plot type | Count rate plots | Images |
|---|---|---|
| Comparison with Poisson distribution Blue bars denote a histogram of data divided into 1 sec bins. Red curve is a Poisson curve with rate = median count rate of data. |
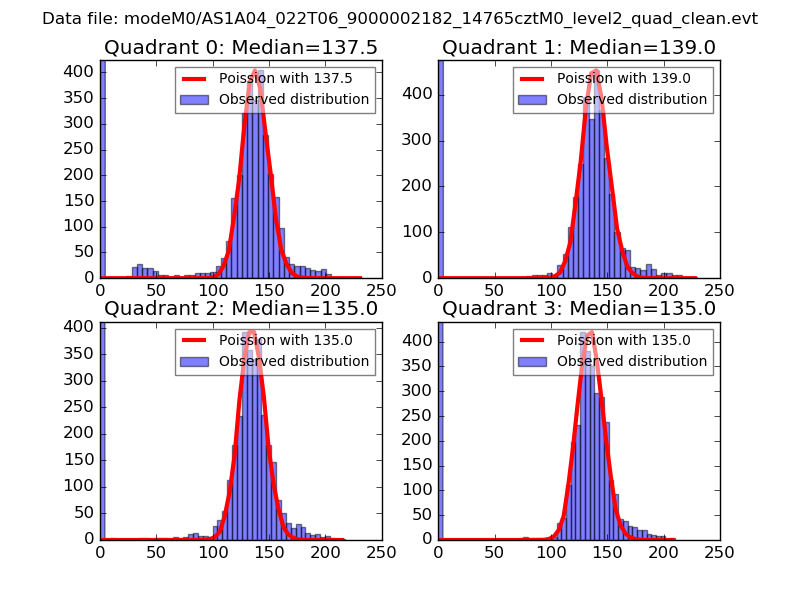 |
 |
| Quadrant-wise count rates Data is divided into 100 sec bins |
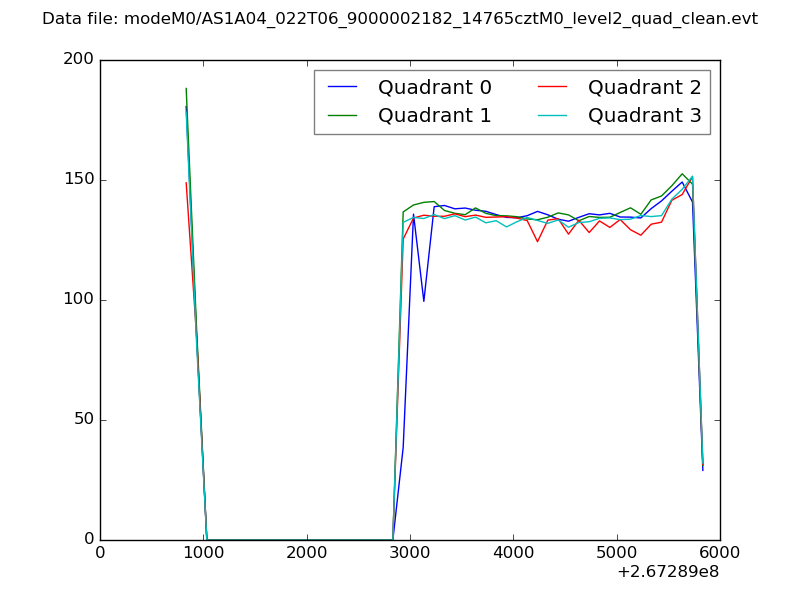 |
|
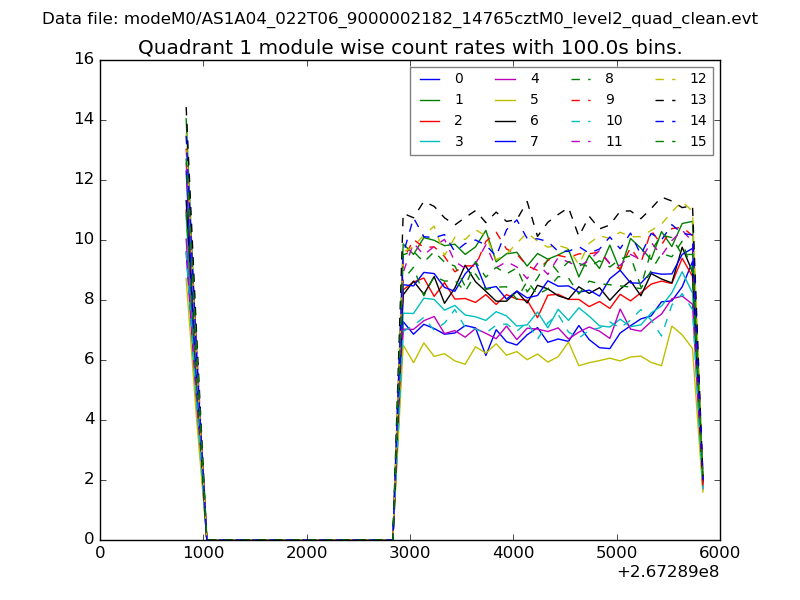
| Module-wise count rates for Quadrant A Data is divided into 100 sec bins |
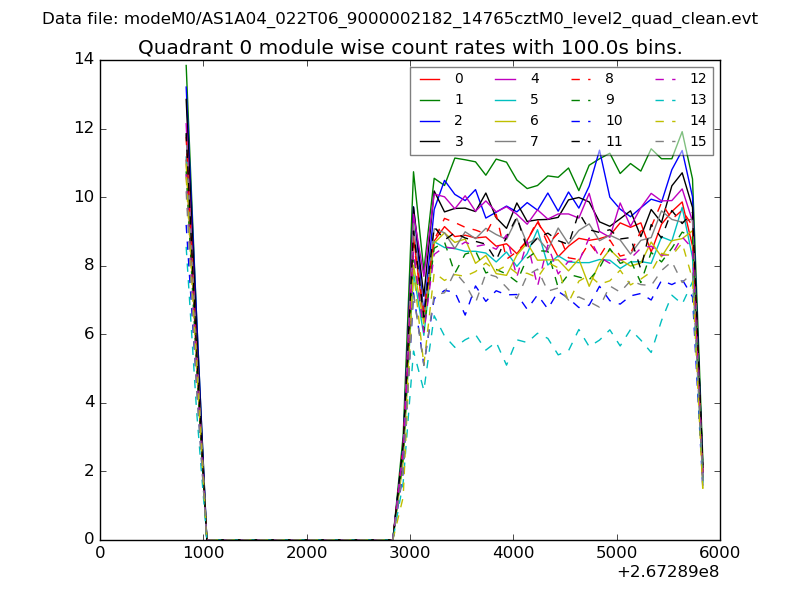 |
 |
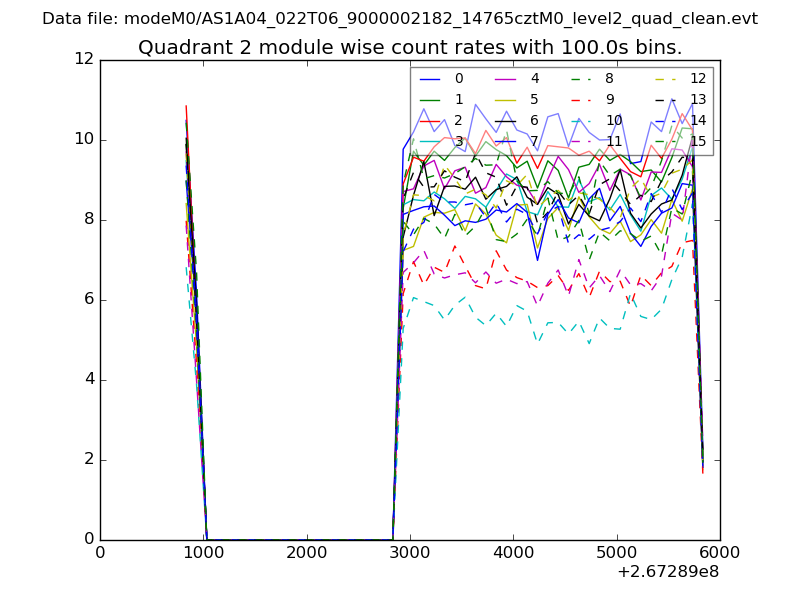
| Module-wise count rates for Quadrant B Data is divided into 100 sec bins |
 |
 |
| Module-wise count rates for Quadrant C Data is divided into 100 sec bins |
 |
 |
| Module-wise count rates for Quadrant D Data is divided into 100 sec bins |
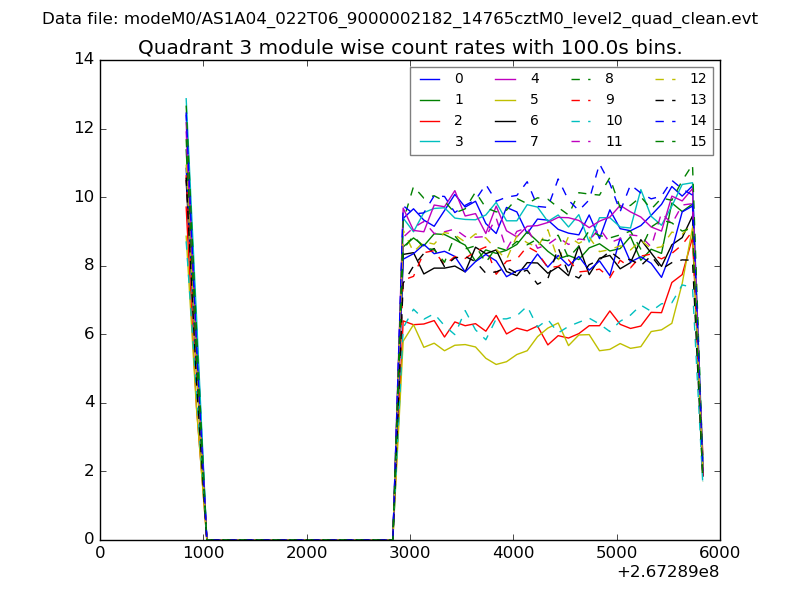 |
 |
| Parameter | Plot |
|---|---|
| CZT HV Monitor | 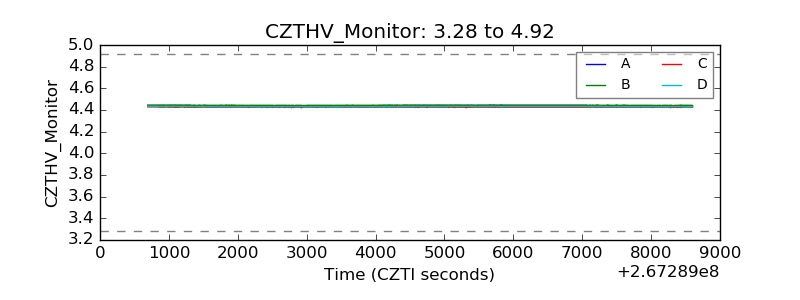 |
| D_VDD | 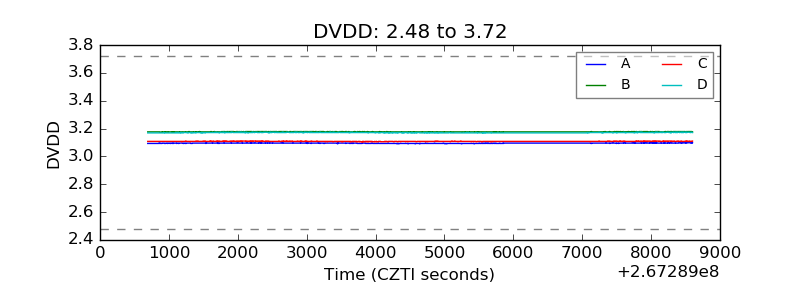 |
| Temperature 1 |  |
| Veto HV Monitor | 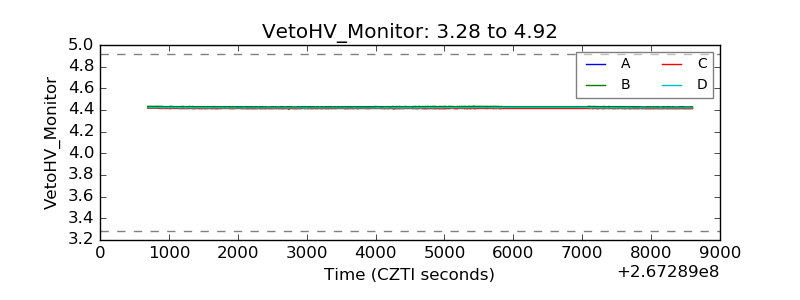 |
| Veto LLD | 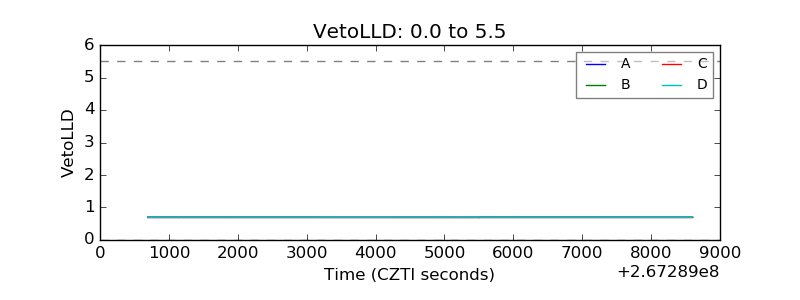 |
| Alpha Counter | 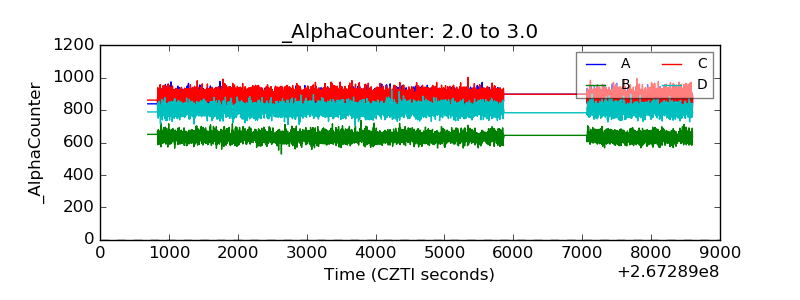 |
| _CPM_Rate | 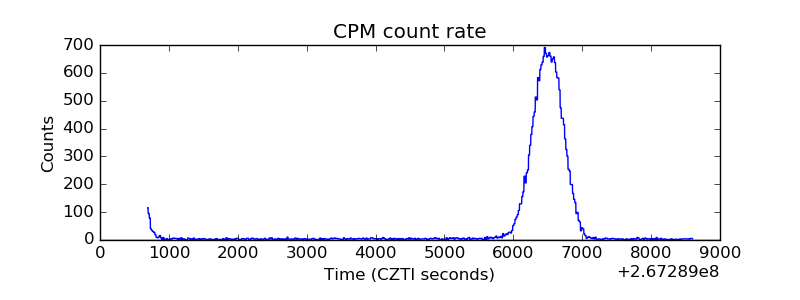 |
| CZT Counter |  |
| +2.5 Volts monitor |  |
| +5 Volts monitor | 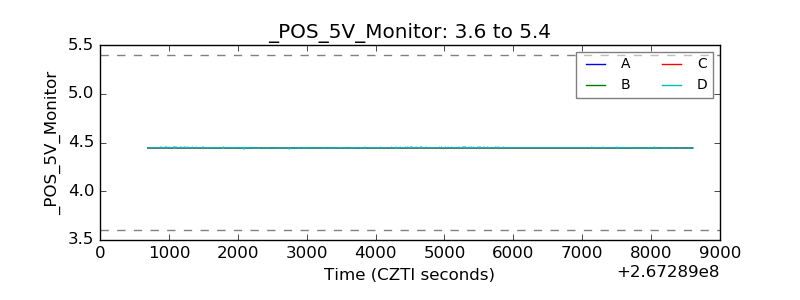 |
| _ROLL_ROT | 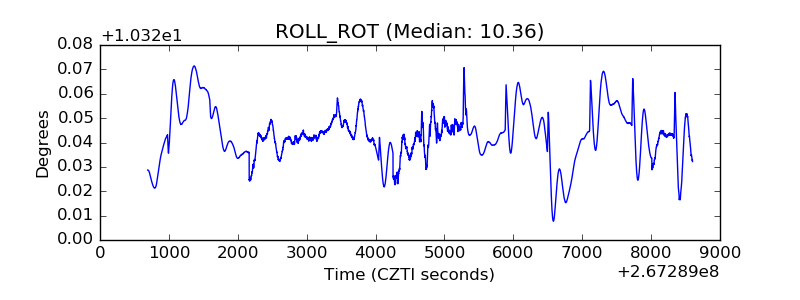 |
| _Roll_DEC | 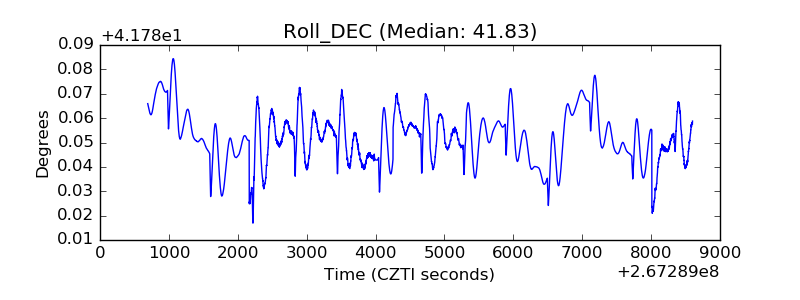 |
| _Roll_RA |  |
| Veto Counter | 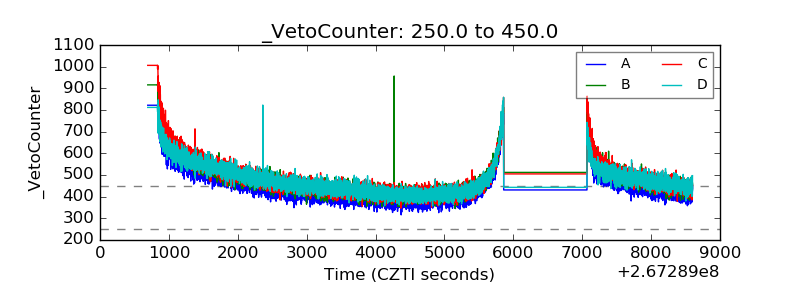 |