| Param | Original file | Final file |
|---|---|---|
| Filename | modeM0/AS1A04_022T06_9000002182_14766cztM0_level2.evt | modeM0/AS1A04_022T06_9000002182_14766cztM0_level2_quad_clean.evt |
| Size (bytes) | 621,817,920 | 76,098,240 |
| Size | 593.0 MB | 72.6 MB |
| Events in quadrant A | 5,681,047 | 449,674 |
| Events in quadrant B | 3,445,780 | 475,301 |
| Events in quadrant C | 5,780,134 | 450,060 |
| Events in quadrant D | 3,474,410 | 465,250 |
| Mode SS | |||
|---|---|---|---|
| Quadrant | BADHDUFLAG | Total packets | Discarded packets |
| A | 0 | 136 | 0 |
| B | 0 | 136 | 0 |
| C | 0 | 136 | 0 |
| D | 0 | 136 | 0 |
| Mode M0 | |||
|---|---|---|---|
| Quadrant | BADHDUFLAG | Total packets | Discarded packets |
| A | 0 | 21672 | 3 |
| B | 0 | 14406 | 2 |
| C | 0 | 21658 | 2 |
| D | 0 | 14775 | 2 |
| Mode M9 | |||
|---|---|---|---|
| Quadrant | BADHDUFLAG | Total packets | Discarded packets |
| A | 0 | 13 | 0 |
| B | 0 | 13 | 0 |
| C | 0 | 13 | 0 |
| D | 0 | 14 | 0 |
| Quadrant | Total seconds | Saturated seconds | Saturation percentage |
|---|---|---|---|
| A | 6644 | 919 | 13.832029% |
| B | 6644 | 131 | 1.971704% |
| C | 6644 | 941 | 14.163155% |
| D | 6644 | 135 | 2.031908% |
Noise dominated data is calculated using 1-second bins in cleaned event files. If a bin has >2000 counts, and if more than 50% of those come from <1% of pixels, then it is considered to be noise-dominated and hence unusable.
| Quadrant | # 1 sec bins | Bins with >0 counts | Bins with >2000 counts | High rate bins dominated by noise | Noise dominated (total time) | Noise dominated (detector-on time) | Marked lightcurve |
|---|---|---|---|---|---|---|---|
| A | 7535 | 6646 | 802 | 802 | 10.64% | 12.07% | 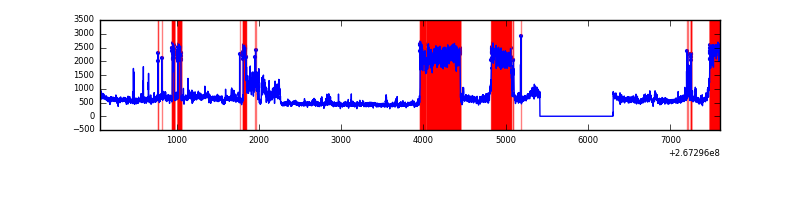 |
| B | 7535 | 6646 | 6 | 6 | 0.08% | 0.09% | 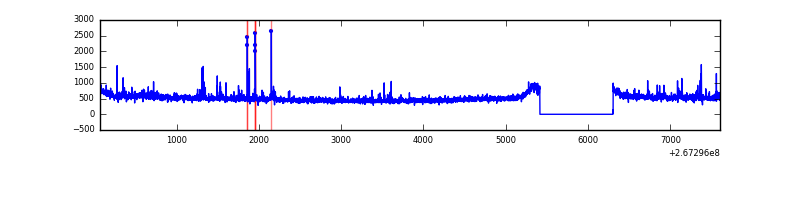 |
| C | 7535 | 6646 | 647 | 647 | 8.59% | 9.74% | 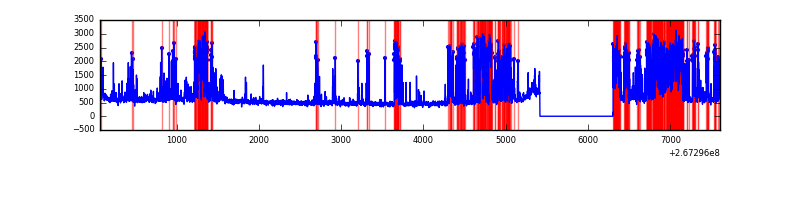 |
| D | 7535 | 6646 | 28 | 28 | 0.37% | 0.42% | 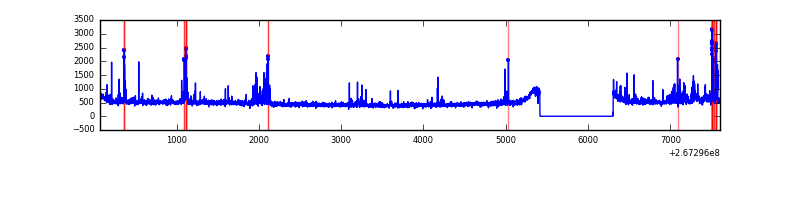 |
Top three noisy pixels from each quadrant. If the there are fewer than three noisy pixels in the level2.evt file, extra rows are filled as -1
| Pixel properties | Quadrant properties | ||||||
|---|---|---|---|---|---|---|---|
| Quadrant | DetID | PixID | Counts | Sigma | Mean | Median | Sigma |
| A | 14 | 237 | 2033833 | 12254.83 | 815 | 796 | 165.9 |
| A | 0 | 23 | 321357 | 1932.29 | 815 | 796 | 165.9 |
| A | 12 | 189 | 124857 | 747.82 | 815 | 796 | 165.9 |
| B | 0 | 190 | 42384 | 260.65 | 838 | 818 | 159.5 |
| B | 4 | 142 | 34641 | 212.1 | 838 | 818 | 159.5 |
| B | 0 | 219 | 23309 | 141.04 | 838 | 818 | 159.5 |
| C | 4 | 254 | 2314470 | 13207.26 | 763 | 765 | 175.2 |
| C | 3 | 233 | 354185 | 2017.42 | 763 | 765 | 175.2 |
| C | 0 | 207 | 113186 | 641.73 | 763 | 765 | 175.2 |
| D | 2 | 136 | 131416 | 655.53 | 817 | 798 | 199.3 |
| D | 8 | 195 | 74666 | 370.72 | 817 | 798 | 199.3 |
| D | 2 | 120 | 69478 | 344.68 | 817 | 798 | 199.3 |
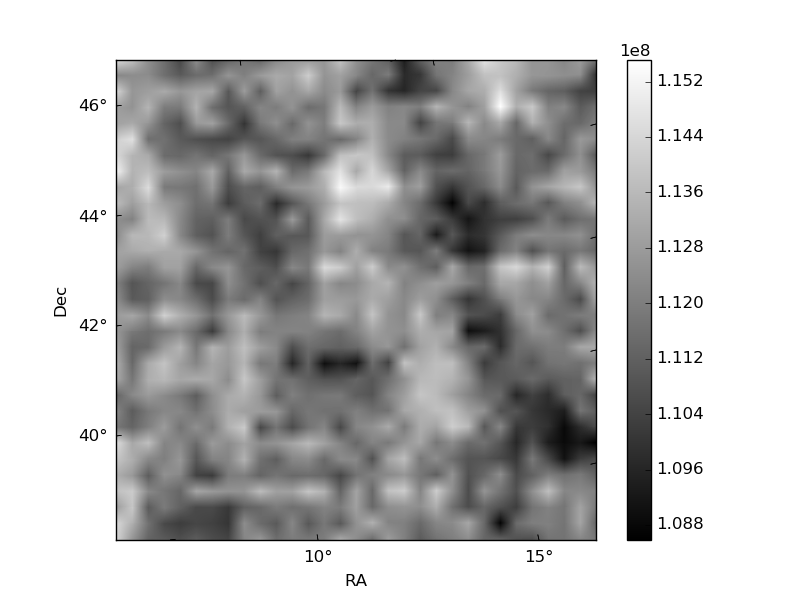
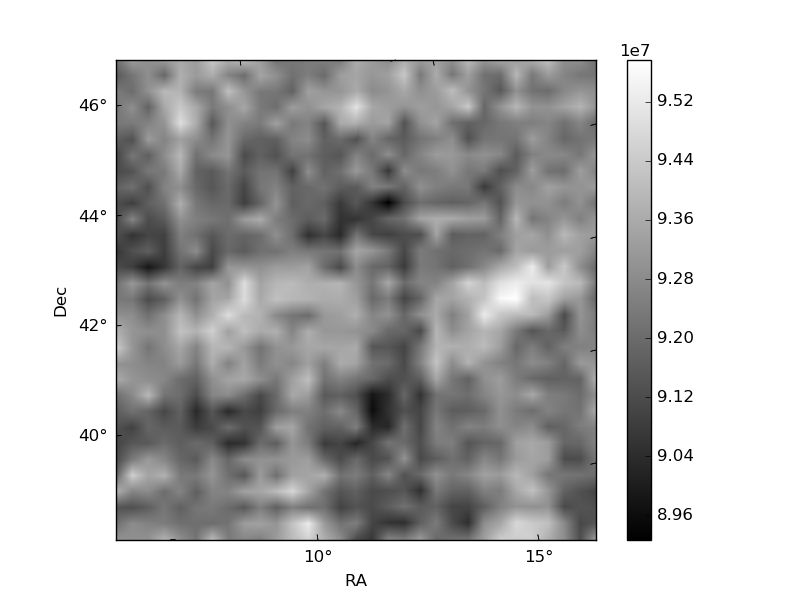
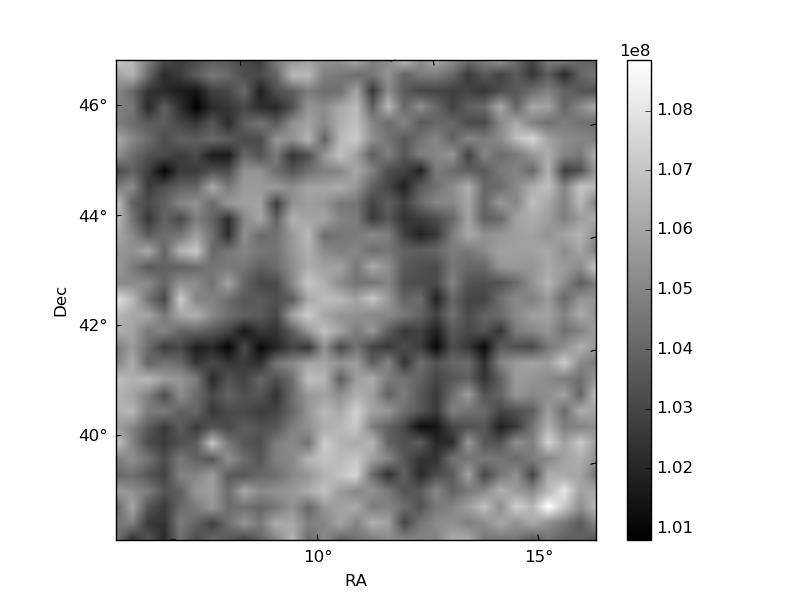
Histogram calculated using DETX and DETY for each event in the final _common_clean file
| Quadrant A | 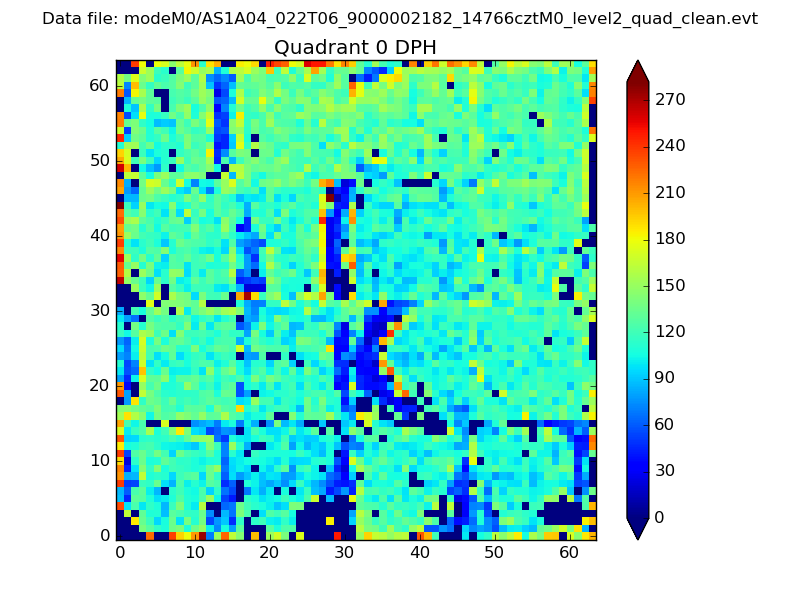 |
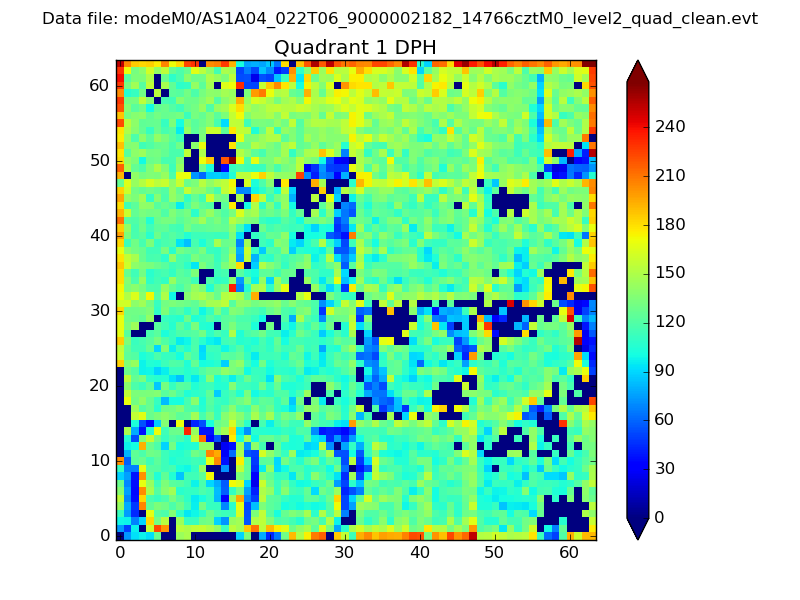 |
Quadrant B |
|---|---|---|---|
| Quadrant D | 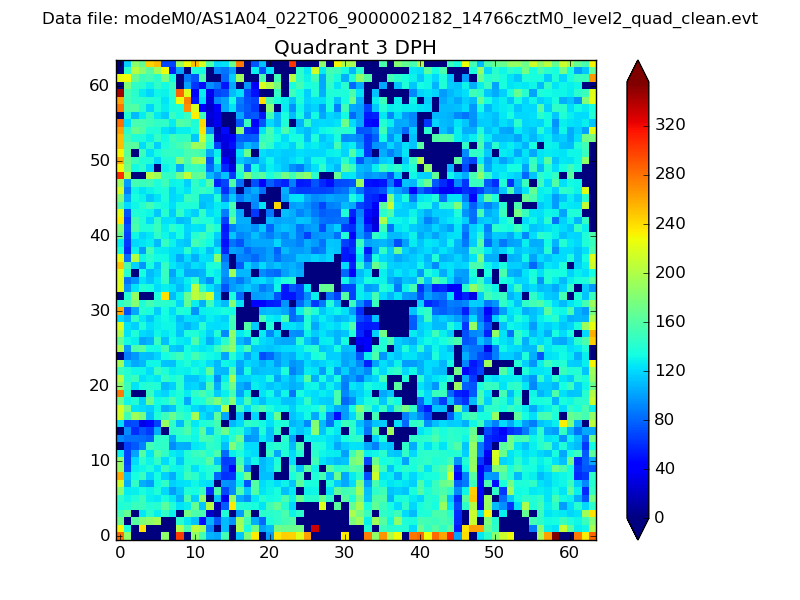 |
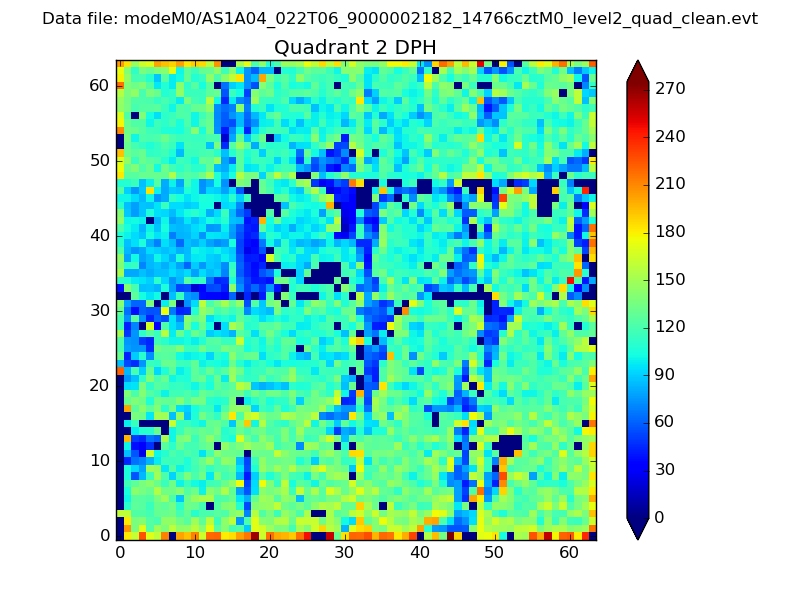 |
Quadrant C |
| Plot type | Count rate plots | Images |
|---|---|---|
| Comparison with Poisson distribution Blue bars denote a histogram of data divided into 1 sec bins. Red curve is a Poisson curve with rate = median count rate of data. |
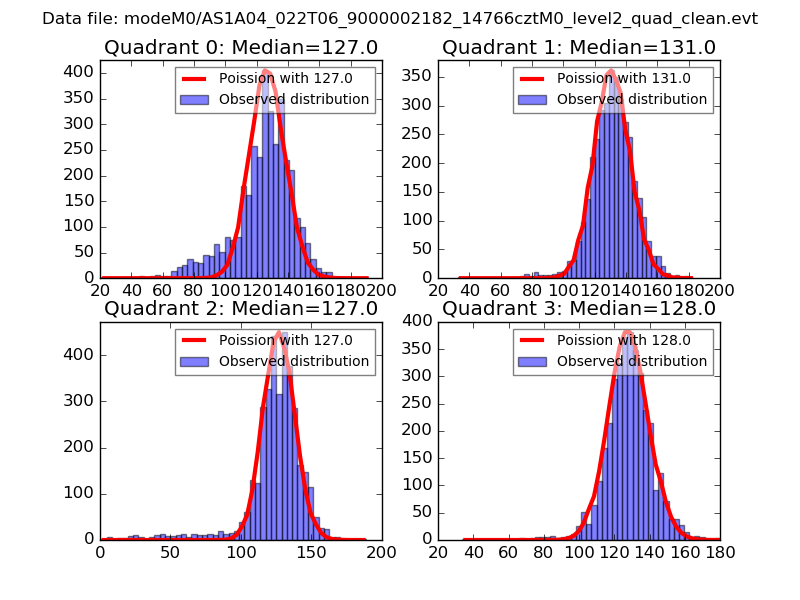 |
 |
| Quadrant-wise count rates Data is divided into 100 sec bins |
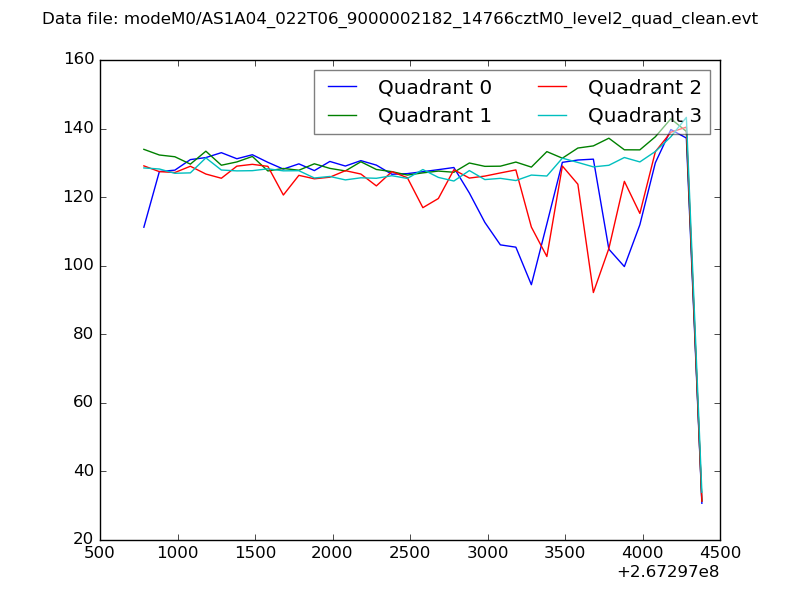 |
|
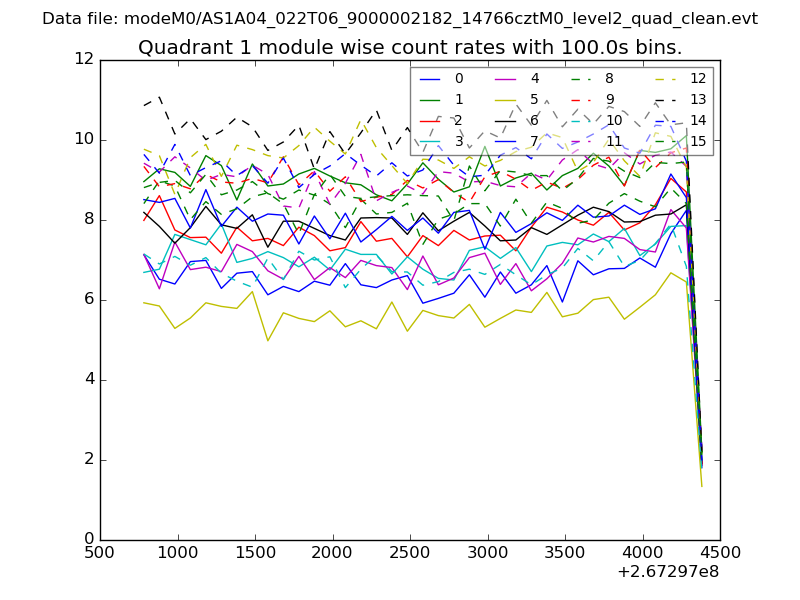
| Module-wise count rates for Quadrant A Data is divided into 100 sec bins |
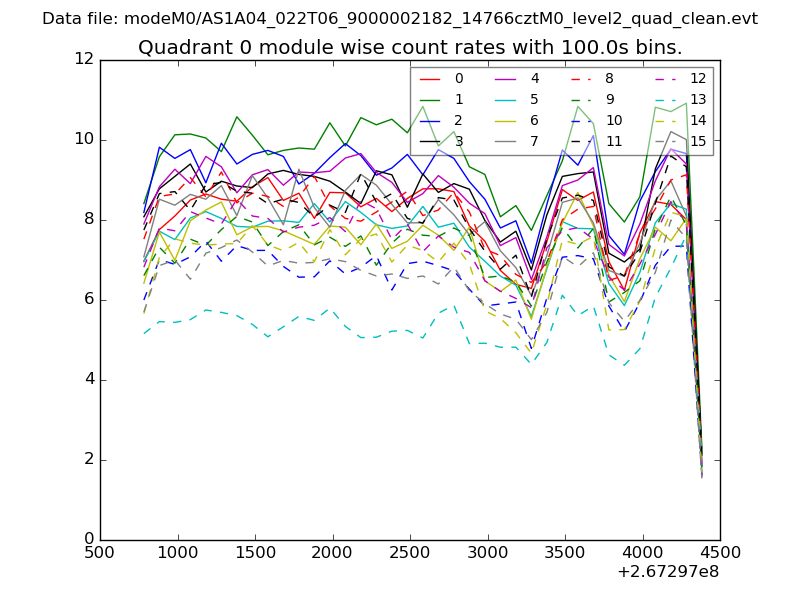 |
 |
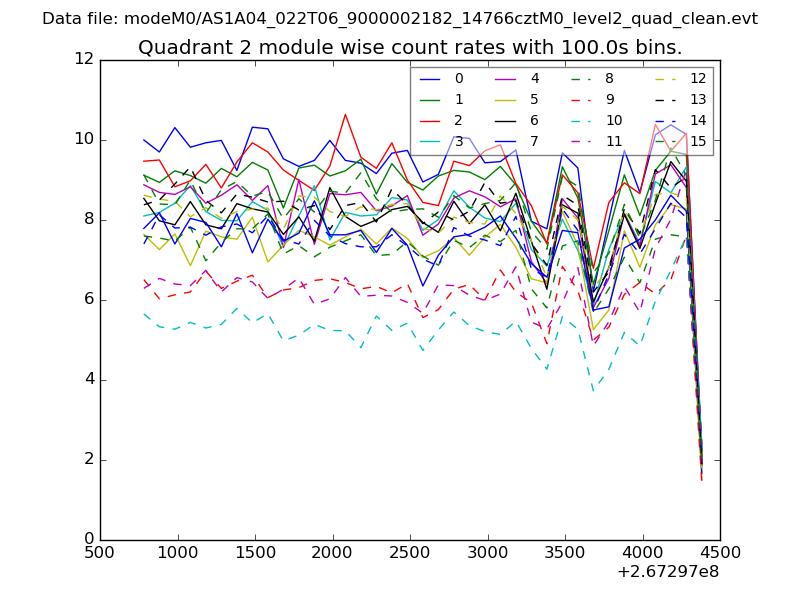
| Module-wise count rates for Quadrant B Data is divided into 100 sec bins |
 |
 |
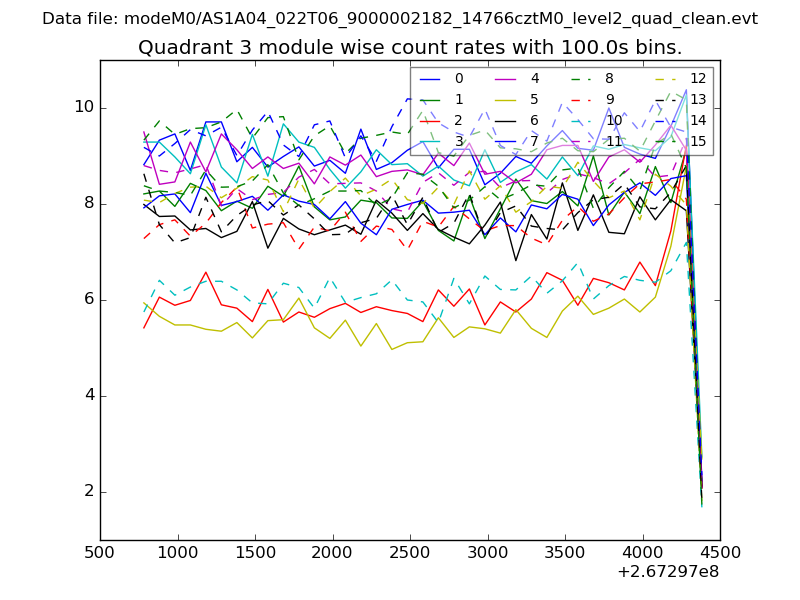
| Module-wise count rates for Quadrant C Data is divided into 100 sec bins |
 |
 |
| Module-wise count rates for Quadrant D Data is divided into 100 sec bins |
 |
 |
| Parameter | Plot |
|---|---|
| CZT HV Monitor | 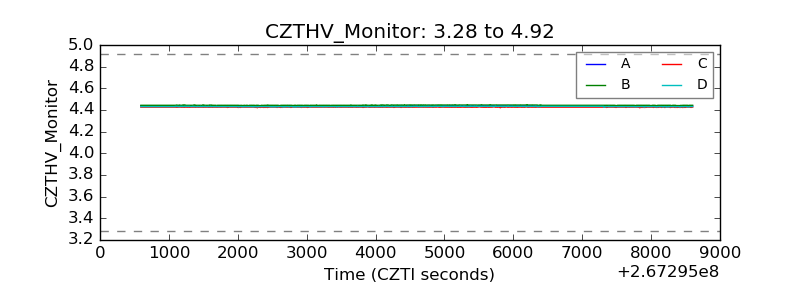 |
| D_VDD | 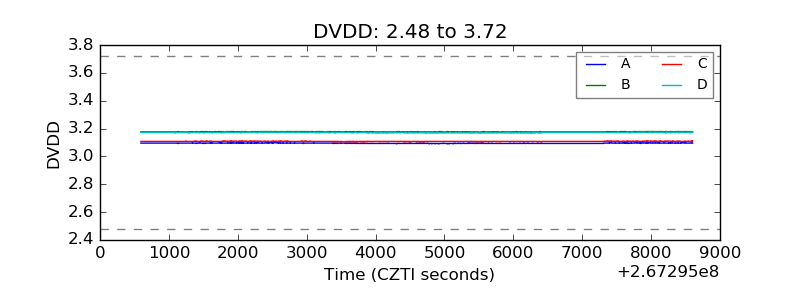 |
| Temperature 1 | 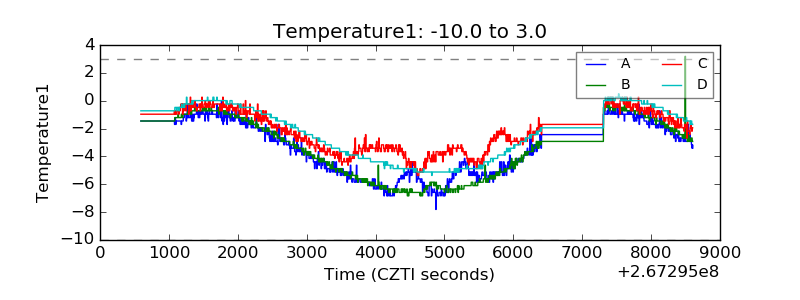 |
| Veto HV Monitor | 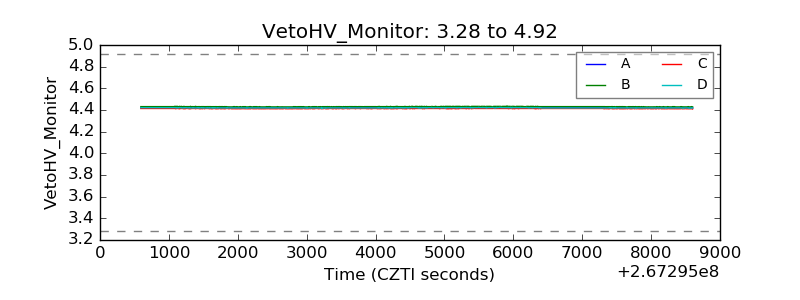 |
| Veto LLD | 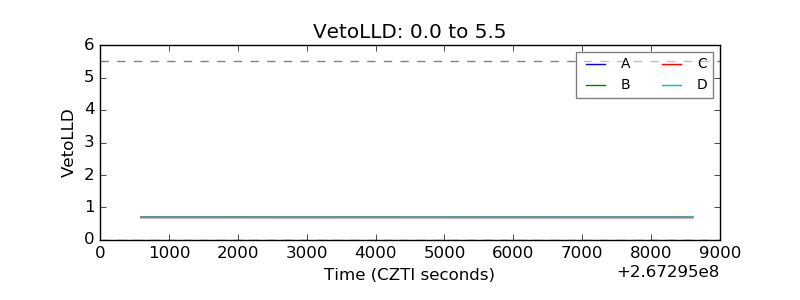 |
| Alpha Counter | 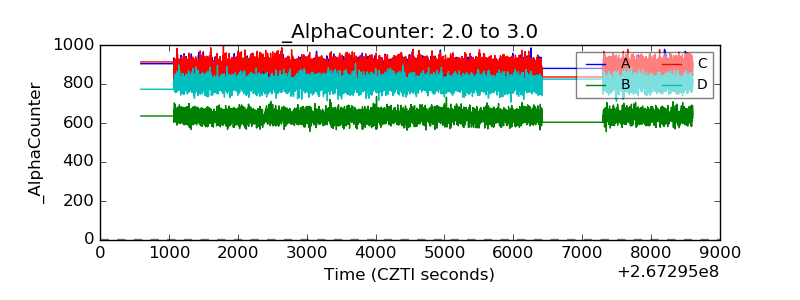 |
| _CPM_Rate | 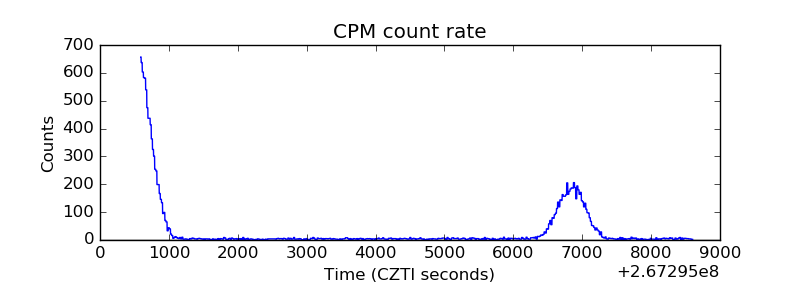 |
| CZT Counter | 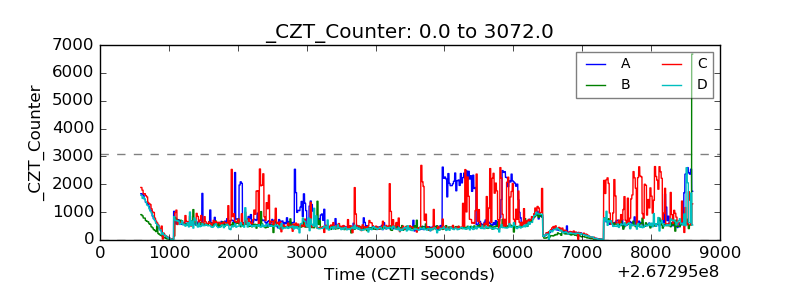 |
| +2.5 Volts monitor |  |
| +5 Volts monitor |  |
| _ROLL_ROT | 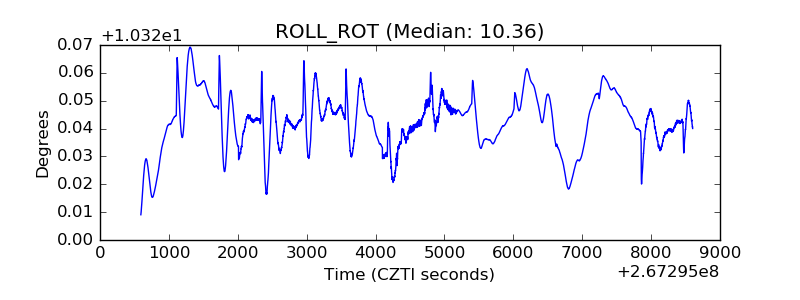 |
| _Roll_DEC | 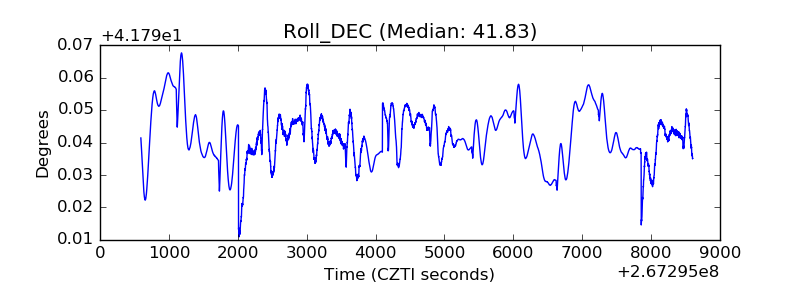 |
| _Roll_RA |  |
| Veto Counter | 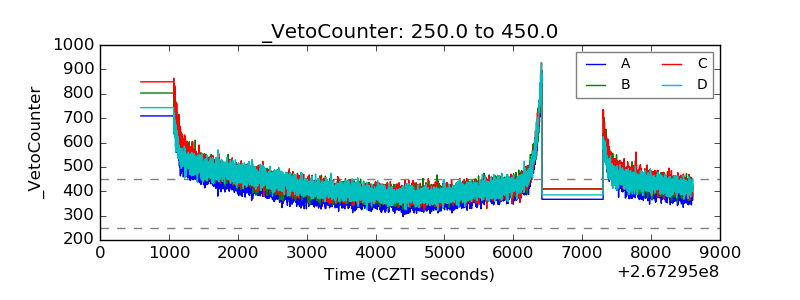 |