| Param | Original file | Final file |
|---|---|---|
| Filename | modeM0/AS1A04_022T06_9000002182_14767cztM0_level2.evt | modeM0/AS1A04_022T06_9000002182_14767cztM0_level2_quad_clean.evt |
| Size (bytes) | 719,343,360 | 86,057,280 |
| Size | 686.0 MB | 82.1 MB |
| Events in quadrant A | 5,563,995 | 531,915 |
| Events in quadrant B | 3,647,296 | 558,197 |
| Events in quadrant C | 8,141,795 | 474,716 |
| Events in quadrant D | 3,944,822 | 538,829 |
| Mode SS | |||
|---|---|---|---|
| Quadrant | BADHDUFLAG | Total packets | Discarded packets |
| A | 0 | 144 | 0 |
| B | 0 | 144 | 0 |
| C | 0 | 144 | 0 |
| D | 0 | 144 | 0 |
| Mode M0 | |||
|---|---|---|---|
| Quadrant | BADHDUFLAG | Total packets | Discarded packets |
| A | 0 | 21374 | 3 |
| B | 0 | 15475 | 2 |
| C | 0 | 29114 | 2 |
| D | 0 | 16788 | 2 |
| Mode M9 | |||
|---|---|---|---|
| Quadrant | BADHDUFLAG | Total packets | Discarded packets |
| A | 0 | 12 | 0 |
| B | 0 | 12 | 0 |
| C | 0 | 12 | 0 |
| D | 0 | 13 | 0 |
| Quadrant | Total seconds | Saturated seconds | Saturation percentage |
|---|---|---|---|
| A | 7213 | 651 | 9.025371% |
| B | 7213 | 74 | 1.025925% |
| C | 7213 | 1816 | 25.176764% |
| D | 7213 | 81 | 1.122972% |
Noise dominated data is calculated using 1-second bins in cleaned event files. If a bin has >2000 counts, and if more than 50% of those come from <1% of pixels, then it is considered to be noise-dominated and hence unusable.
| Quadrant | # 1 sec bins | Bins with >0 counts | Bins with >2000 counts | High rate bins dominated by noise | Noise dominated (total time) | Noise dominated (detector-on time) | Marked lightcurve |
|---|---|---|---|---|---|---|---|
| A | 7729 | 7215 | 597 | 597 | 7.72% | 8.27% | 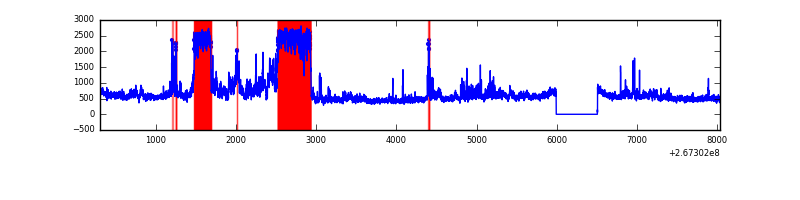 |
| B | 7729 | 7215 | 3 | 3 | 0.04% | 0.04% | 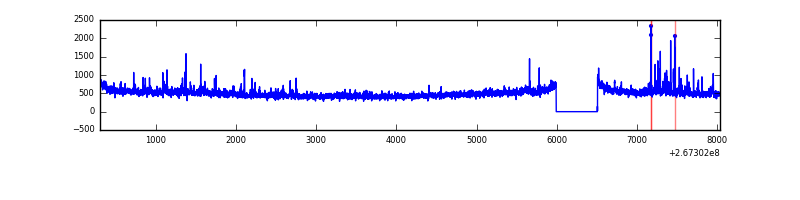 |
| C | 7729 | 7215 | 1342 | 1342 | 17.36% | 18.60% | 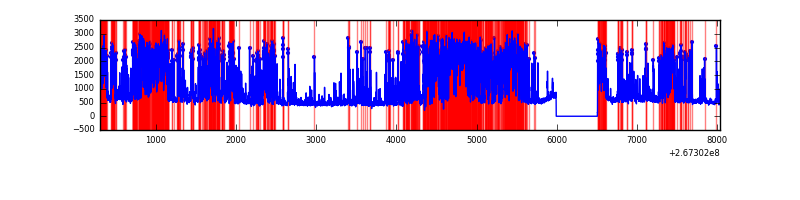 |
| D | 7729 | 7215 | 34 | 34 | 0.44% | 0.47% | 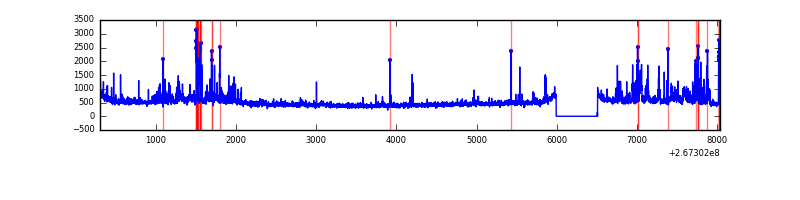 |
Top three noisy pixels from each quadrant. If the there are fewer than three noisy pixels in the level2.evt file, extra rows are filled as -1
| Pixel properties | Quadrant properties | ||||||
|---|---|---|---|---|---|---|---|
| Quadrant | DetID | PixID | Counts | Sigma | Mean | Median | Sigma |
| A | 14 | 237 | 2035702 | 11682.38 | 853 | 831 | 174.2 |
| A | 12 | 189 | 124001 | 707.13 | 853 | 831 | 174.2 |
| A | 0 | 23 | 79063 | 449.14 | 853 | 831 | 174.2 |
| B | 0 | 190 | 37304 | 217.53 | 880 | 859 | 167.5 |
| B | 0 | 229 | 28753 | 166.49 | 880 | 859 | 167.5 |
| B | 3 | 209 | 28027 | 162.16 | 880 | 859 | 167.5 |
| C | 4 | 254 | 4691243 | 27351.07 | 746 | 749 | 171.5 |
| C | 3 | 233 | 360960 | 2100.45 | 746 | 749 | 171.5 |
| C | 0 | 207 | 70174 | 404.83 | 746 | 749 | 171.5 |
| D | 2 | 136 | 338351 | 1595.11 | 851 | 829 | 211.6 |
| D | 8 | 195 | 143182 | 672.75 | 851 | 829 | 211.6 |
| D | 2 | 120 | 64932 | 302.95 | 851 | 829 | 211.6 |
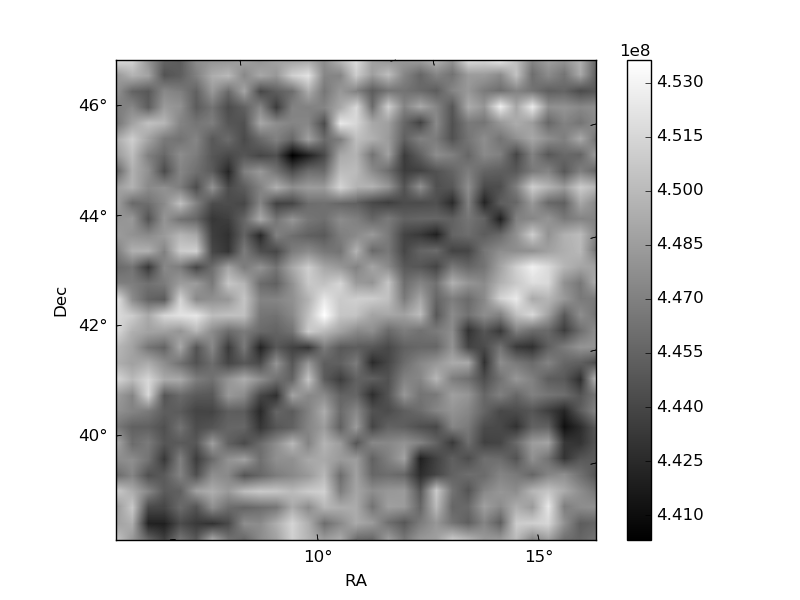
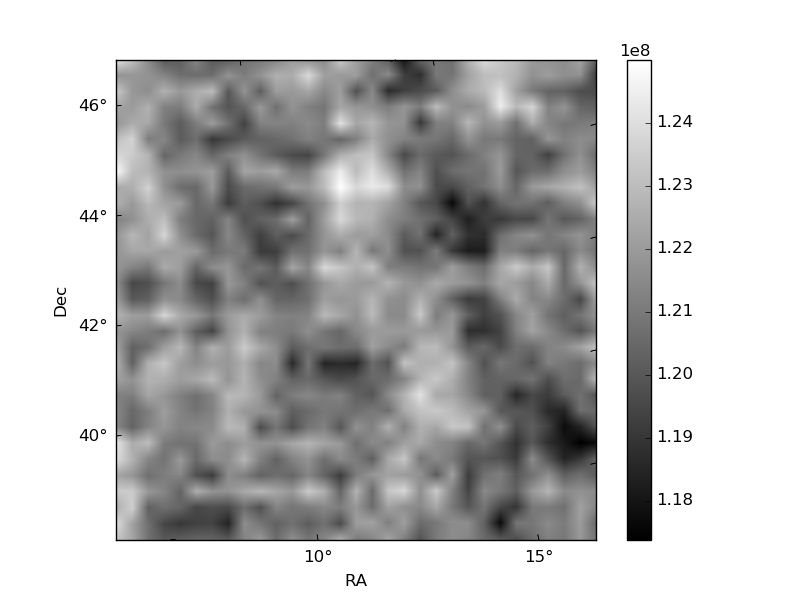
Histogram calculated using DETX and DETY for each event in the final _common_clean file
| Quadrant A | 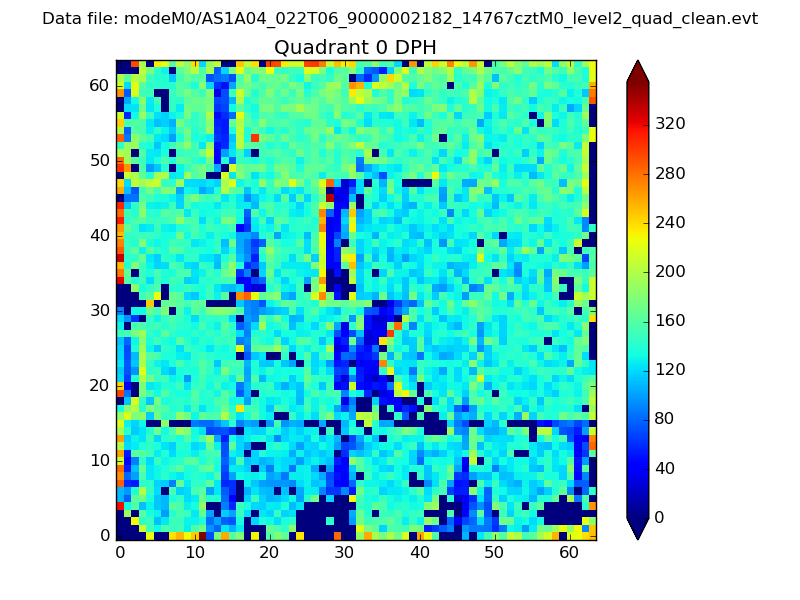 |
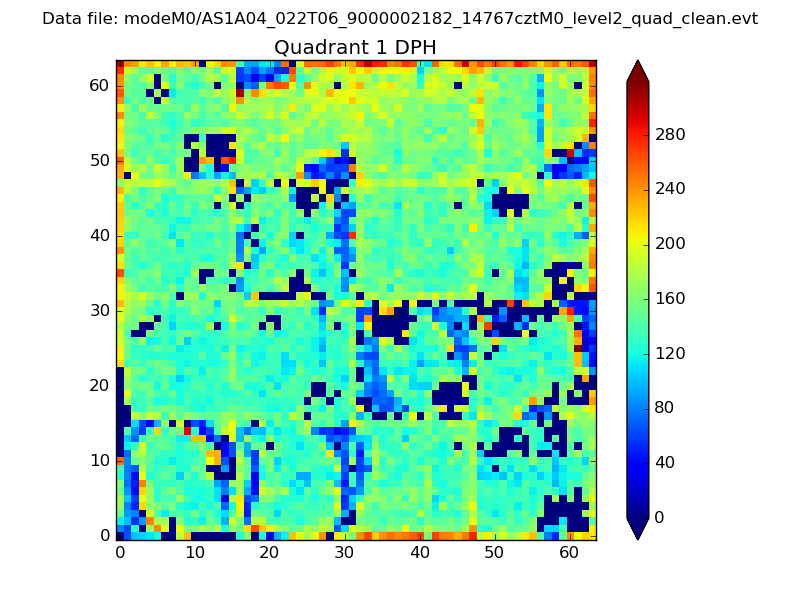 |
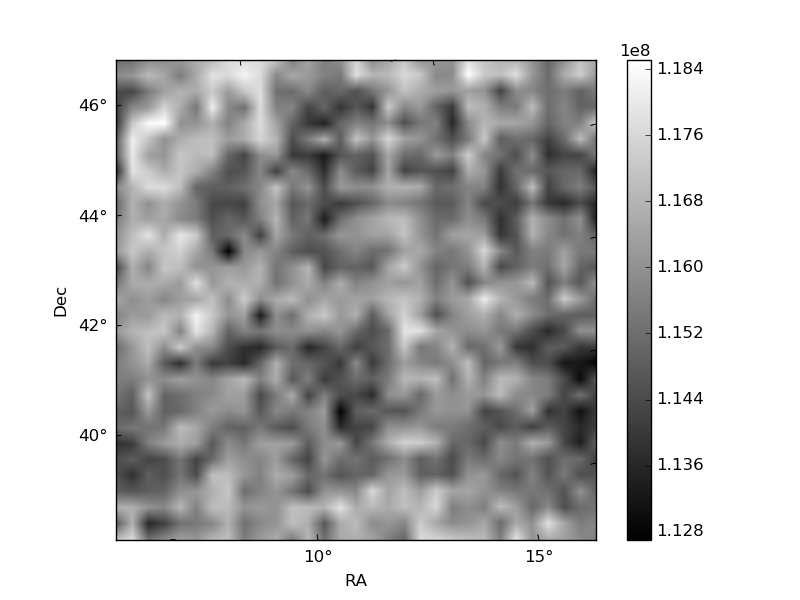
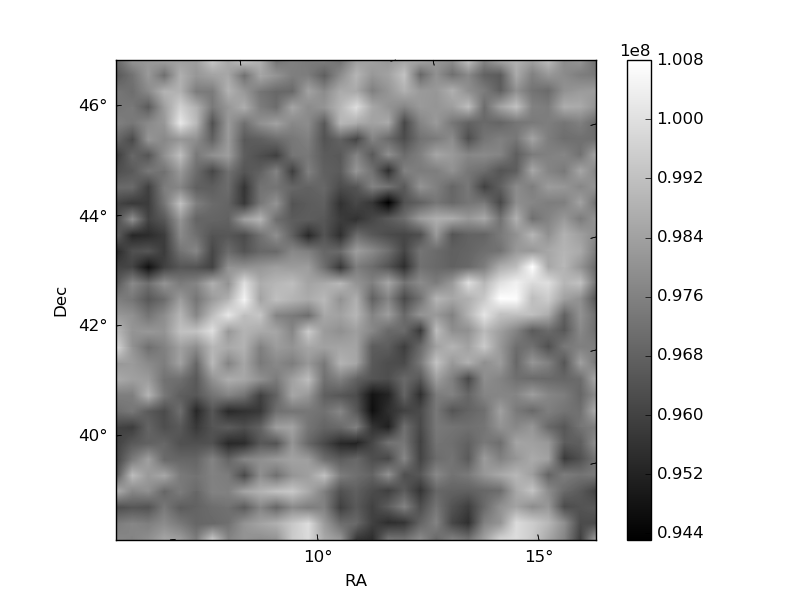
Quadrant B |
|---|---|---|---|
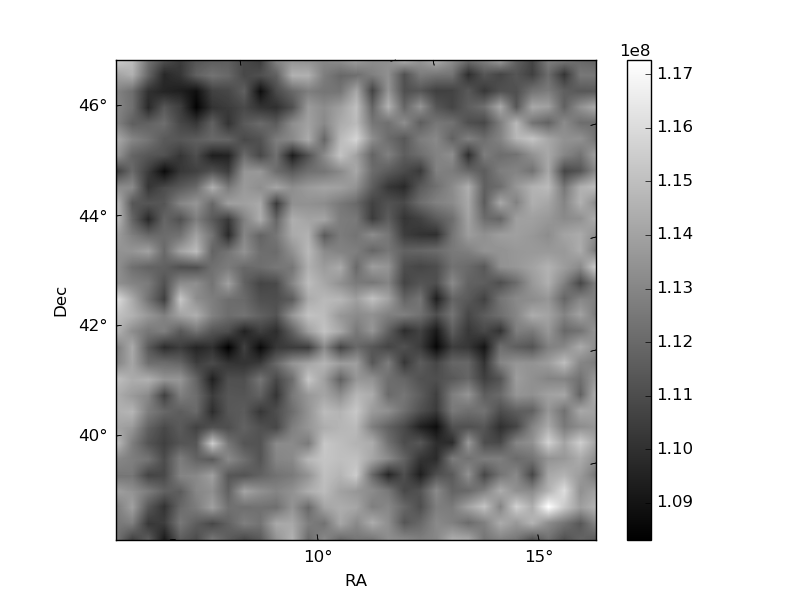
| Quadrant D | 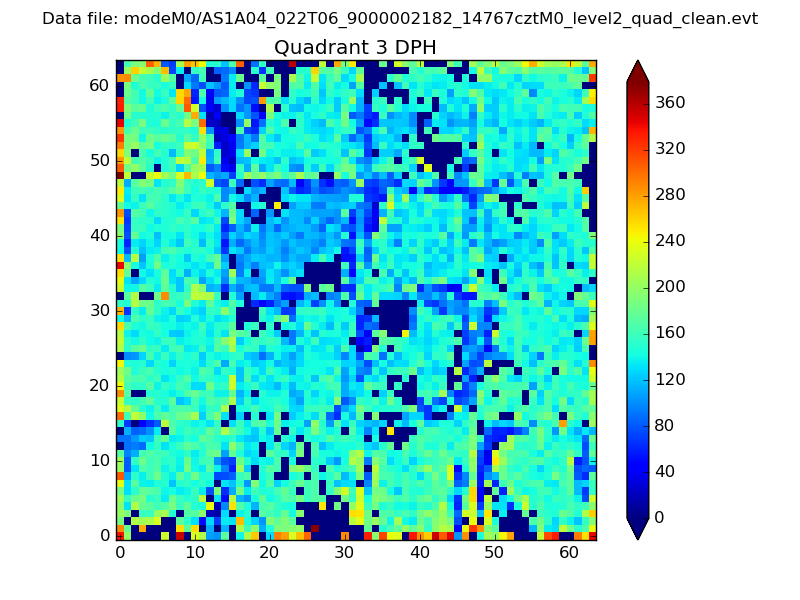 |
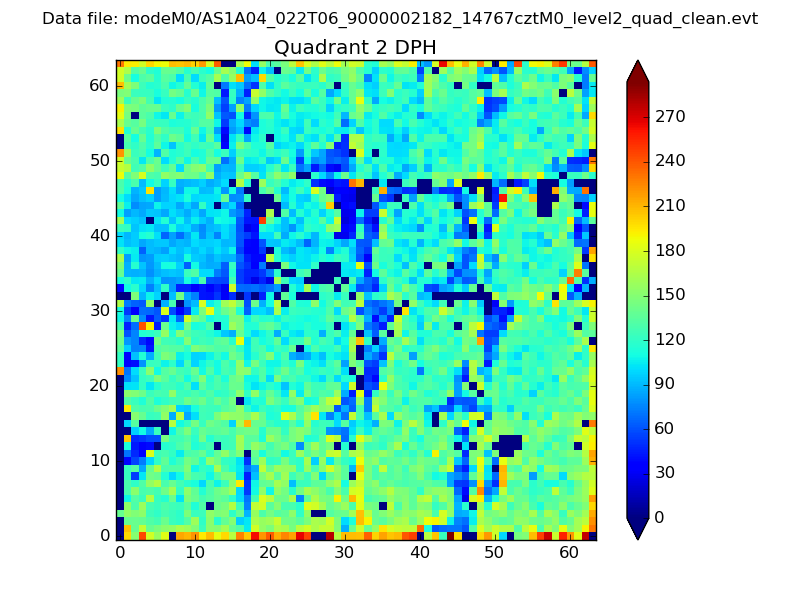 |
Quadrant C |
| Plot type | Count rate plots | Images |
|---|---|---|
| Comparison with Poisson distribution Blue bars denote a histogram of data divided into 1 sec bins. Red curve is a Poisson curve with rate = median count rate of data. |
 |
 |
| Quadrant-wise count rates Data is divided into 100 sec bins |
 |
|
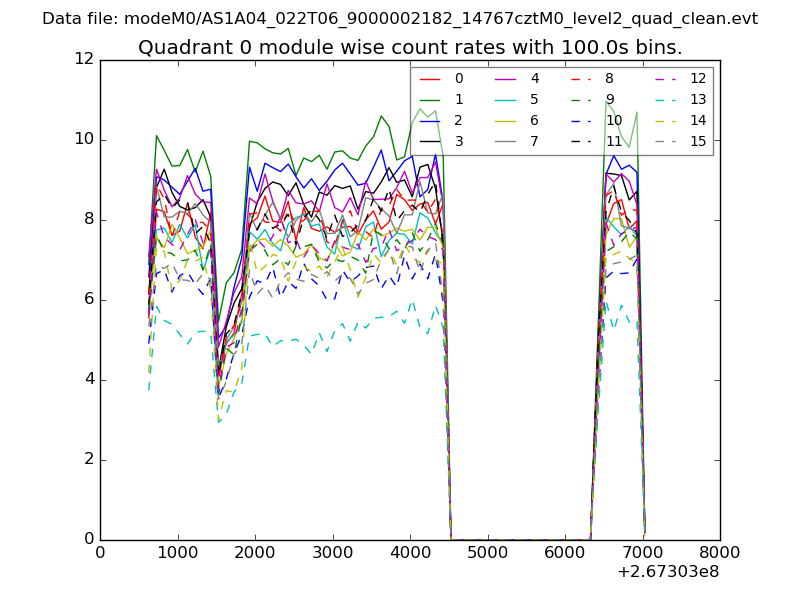
| Module-wise count rates for Quadrant A Data is divided into 100 sec bins |
 |
 |
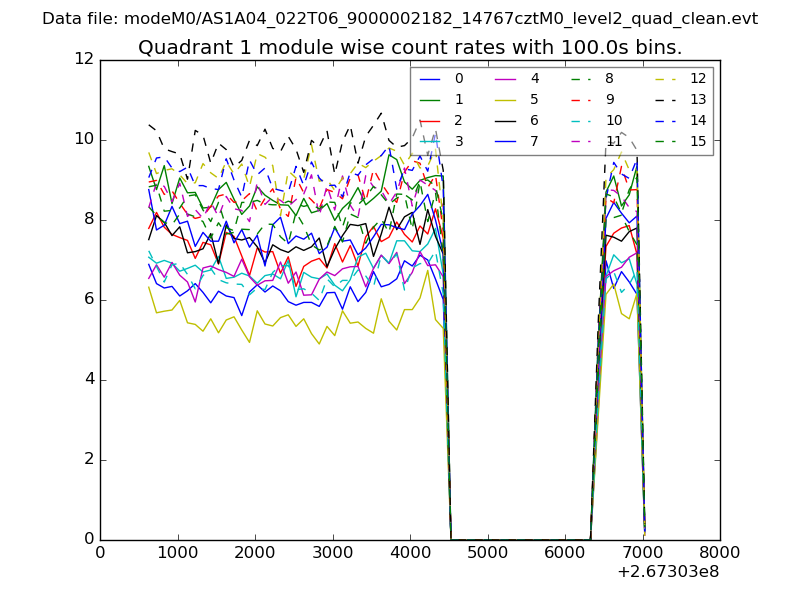
| Module-wise count rates for Quadrant B Data is divided into 100 sec bins |
 |
 |
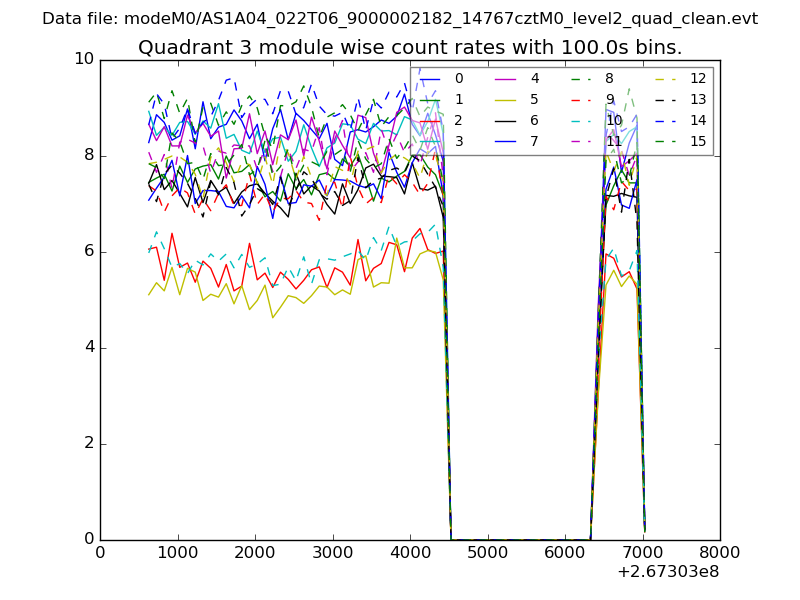
| Module-wise count rates for Quadrant C Data is divided into 100 sec bins |
 |
 |
| Module-wise count rates for Quadrant D Data is divided into 100 sec bins |
 |
 |
| Parameter | Plot |
|---|---|
| CZT HV Monitor |  |
| D_VDD | 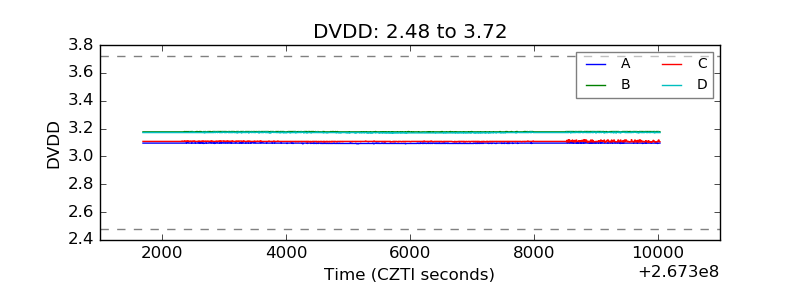 |
| Temperature 1 | 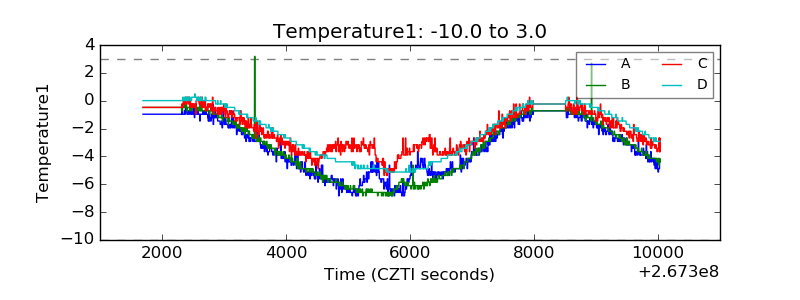 |
| Veto HV Monitor | 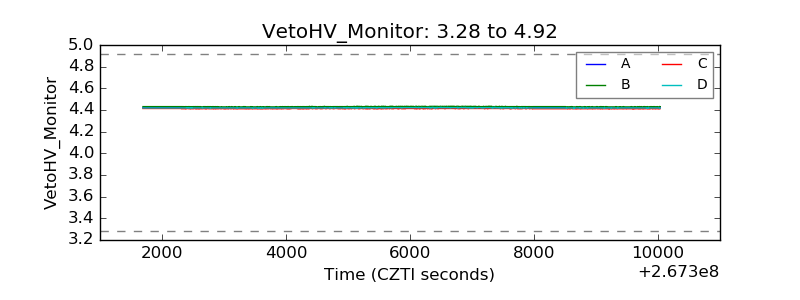 |
| Veto LLD | 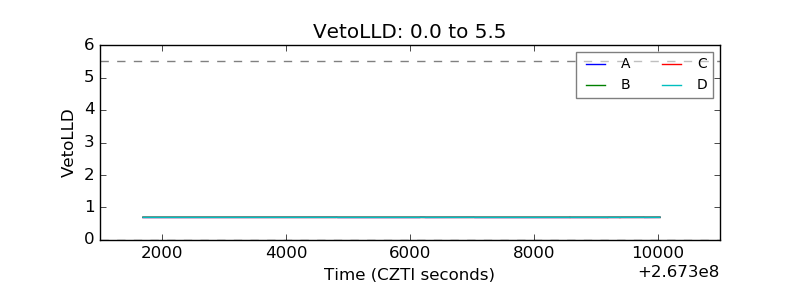 |
| Alpha Counter |  |
| _CPM_Rate | 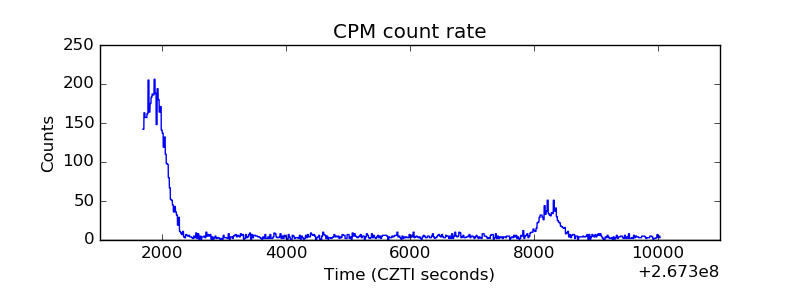 |
| CZT Counter | 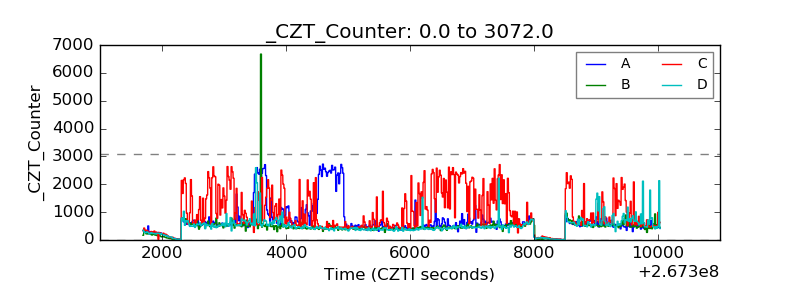 |
| +2.5 Volts monitor |  |
| +5 Volts monitor |  |
| _ROLL_ROT | 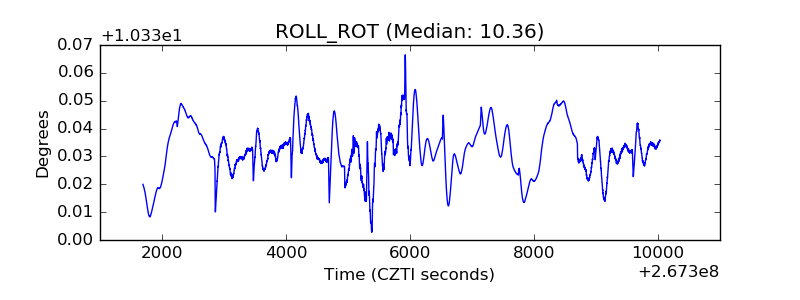 |
| _Roll_DEC | 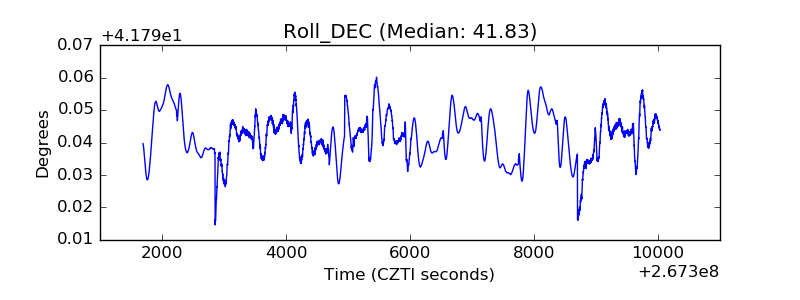 |
| _Roll_RA | 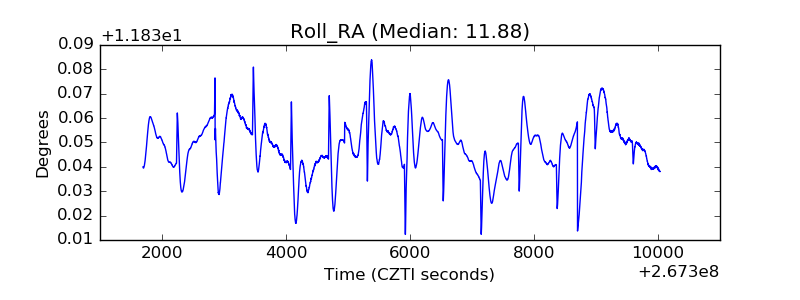 |
| Veto Counter | 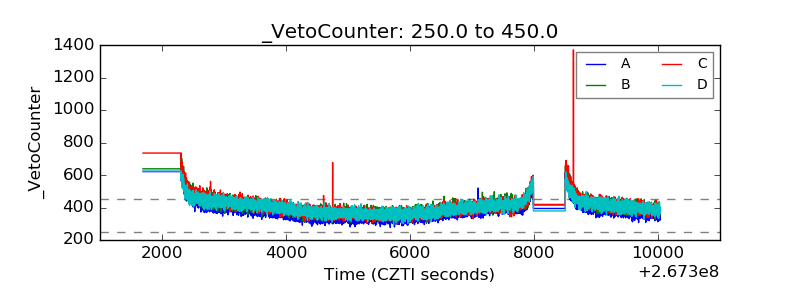 |