| Param | Original file | Final file |
|---|---|---|
| Filename | modeM0/AS1A04_022T06_9000002182_14769cztM0_level2.evt | modeM0/AS1A04_022T06_9000002182_14769cztM0_level2_quad_clean.evt |
| Size (bytes) | 627,062,400 | 102,899,520 |
| Size | 598.0 MB | 98.1 MB |
| Events in quadrant A | 4,338,376 | 656,066 |
| Events in quadrant B | 4,185,524 | 658,227 |
| Events in quadrant C | 5,496,006 | 608,076 |
| Events in quadrant D | 4,425,874 | 634,915 |
| Mode SS | |||
|---|---|---|---|
| Quadrant | BADHDUFLAG | Total packets | Discarded packets |
| A | 0 | 164 | 0 |
| B | 0 | 164 | 0 |
| C | 0 | 164 | 0 |
| D | 0 | 164 | 0 |
| Mode M0 | |||
|---|---|---|---|
| Quadrant | BADHDUFLAG | Total packets | Discarded packets |
| A | 0 | 18264 | 3 |
| B | 0 | 17714 | 2 |
| C | 0 | 21566 | 2 |
| D | 0 | 18810 | 2 |
| Mode M9 | |||
|---|---|---|---|
| Quadrant | BADHDUFLAG | Total packets | Discarded packets |
| A | 0 | 6 | 0 |
| B | 0 | 6 | 0 |
| C | 0 | 6 | 0 |
| D | 0 | 6 | 0 |
| Quadrant | Total seconds | Saturated seconds | Saturation percentage |
|---|---|---|---|
| A | 8041 | 187 | 2.325581% |
| B | 8041 | 125 | 1.554533% |
| C | 8041 | 583 | 7.250342% |
| D | 8041 | 82 | 1.019774% |
Noise dominated data is calculated using 1-second bins in cleaned event files. If a bin has >2000 counts, and if more than 50% of those come from <1% of pixels, then it is considered to be noise-dominated and hence unusable.
| Quadrant | # 1 sec bins | Bins with >0 counts | Bins with >2000 counts | High rate bins dominated by noise | Noise dominated (total time) | Noise dominated (detector-on time) | Marked lightcurve |
|---|---|---|---|---|---|---|---|
| A | 8602 | 8044 | 61 | 61 | 0.71% | 0.76% | 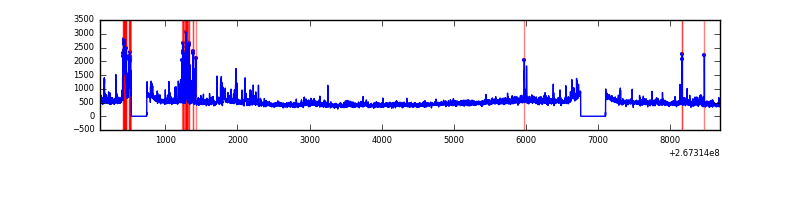 |
| B | 8602 | 8044 | 19 | 19 | 0.22% | 0.24% | 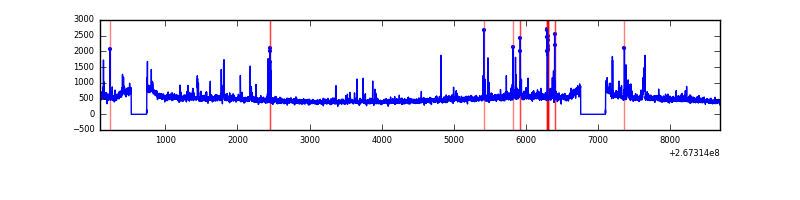 |
| C | 8602 | 8044 | 340 | 340 | 3.95% | 4.23% | 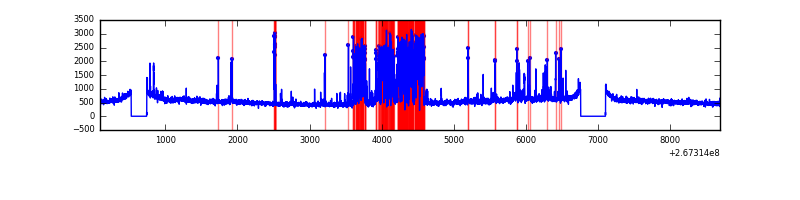 |
| D | 8602 | 8044 | 32 | 32 | 0.37% | 0.40% | 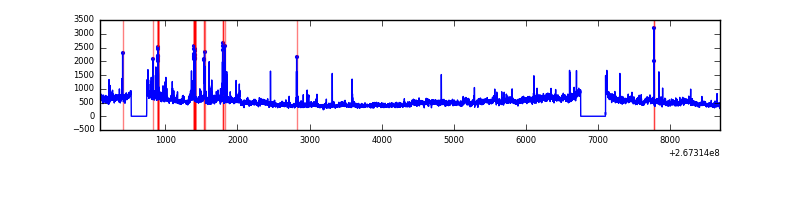 |
Top three noisy pixels from each quadrant. If the there are fewer than three noisy pixels in the level2.evt file, extra rows are filled as -1
| Pixel properties | Quadrant properties | ||||||
|---|---|---|---|---|---|---|---|
| Quadrant | DetID | PixID | Counts | Sigma | Mean | Median | Sigma |
| A | 14 | 237 | 363446 | 1840.59 | 964 | 942 | 196.9 |
| A | 12 | 189 | 177583 | 896.88 | 964 | 942 | 196.9 |
| A | 0 | 23 | 47738 | 237.6 | 964 | 942 | 196.9 |
| B | 4 | 216 | 63075 | 333.76 | 975 | 948 | 186.1 |
| B | 4 | 142 | 54808 | 289.35 | 975 | 948 | 186.1 |
| B | 10 | 246 | 54684 | 288.68 | 975 | 948 | 186.1 |
| C | 4 | 254 | 1344086 | 6310.22 | 913 | 917 | 212.9 |
| C | 3 | 233 | 467944 | 2194.1 | 913 | 917 | 212.9 |
| C | 7 | 247 | 89126 | 414.41 | 913 | 917 | 212.9 |
| D | 8 | 195 | 536639 | 2130.97 | 937 | 915 | 251.4 |
| D | 15 | 0 | 114621 | 452.29 | 937 | 915 | 251.4 |
| D | 2 | 136 | 94945 | 374.03 | 937 | 915 | 251.4 |
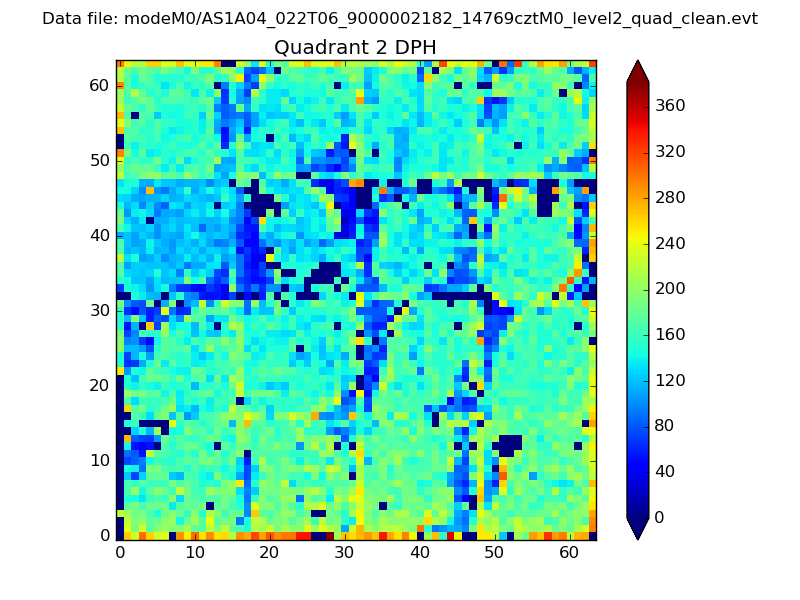
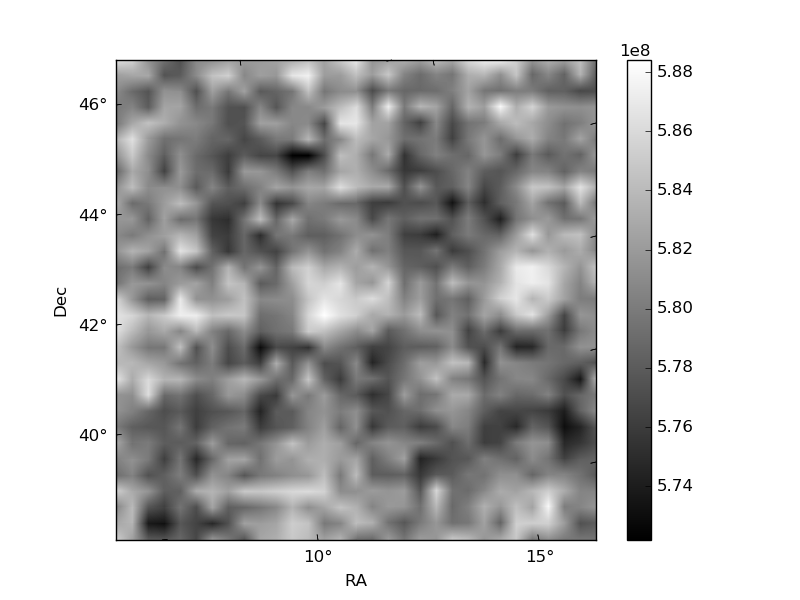
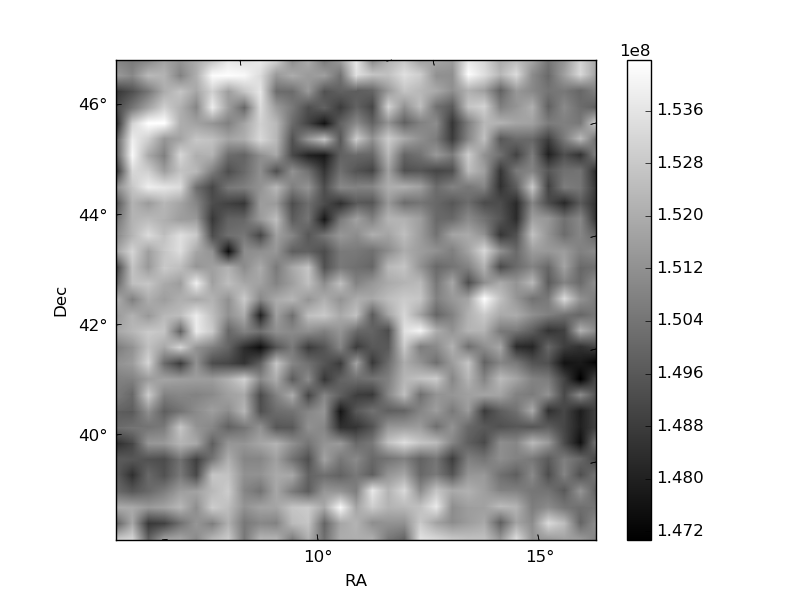
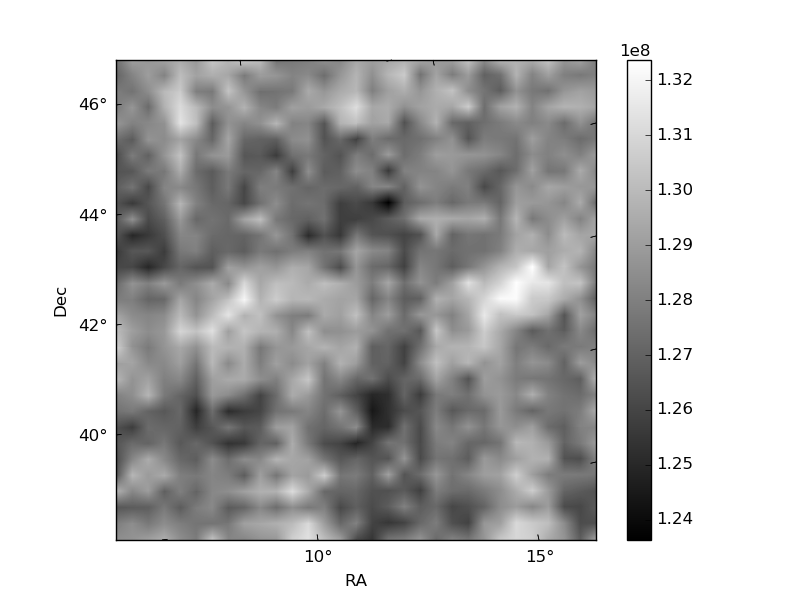
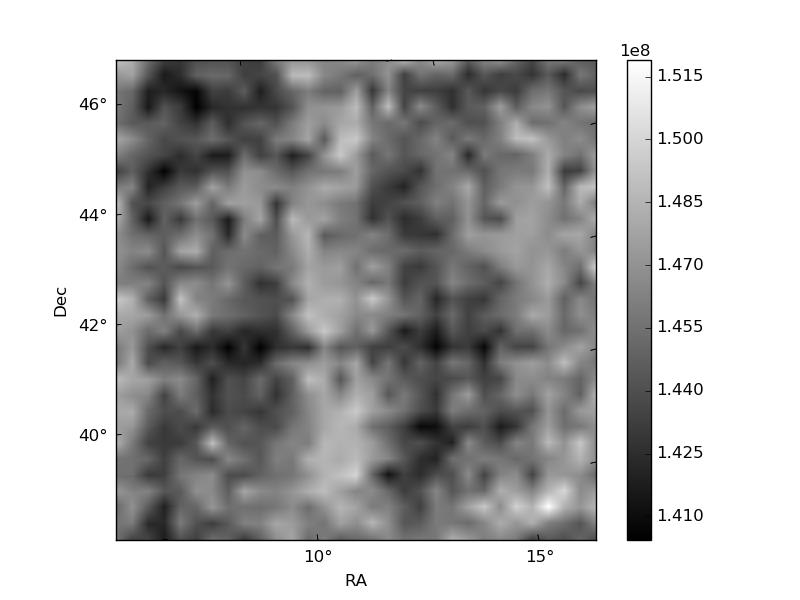
Histogram calculated using DETX and DETY for each event in the final _common_clean file
| Quadrant A | 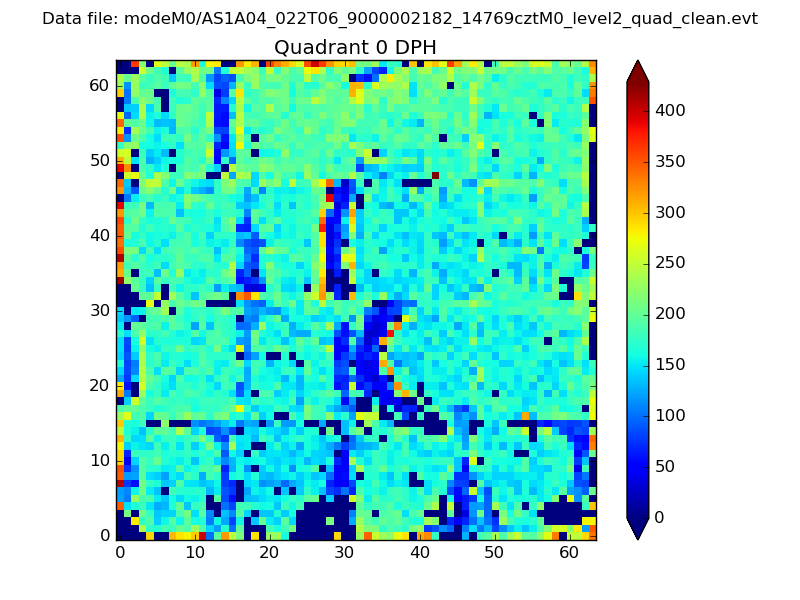 |
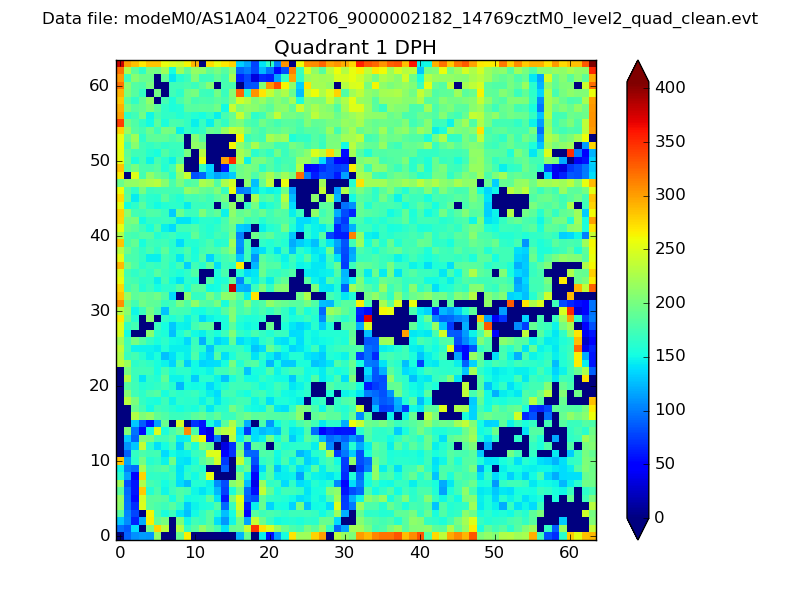 |
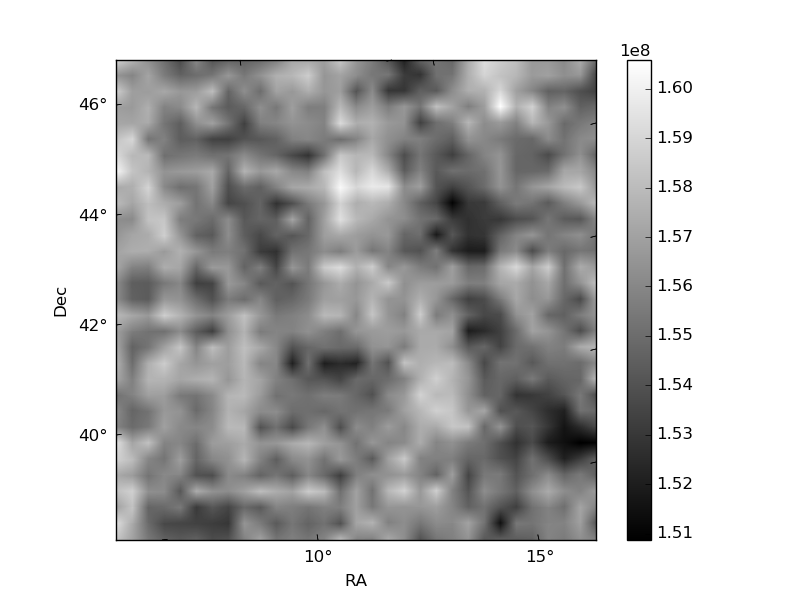
Quadrant B |
|---|---|---|---|
| Quadrant D | 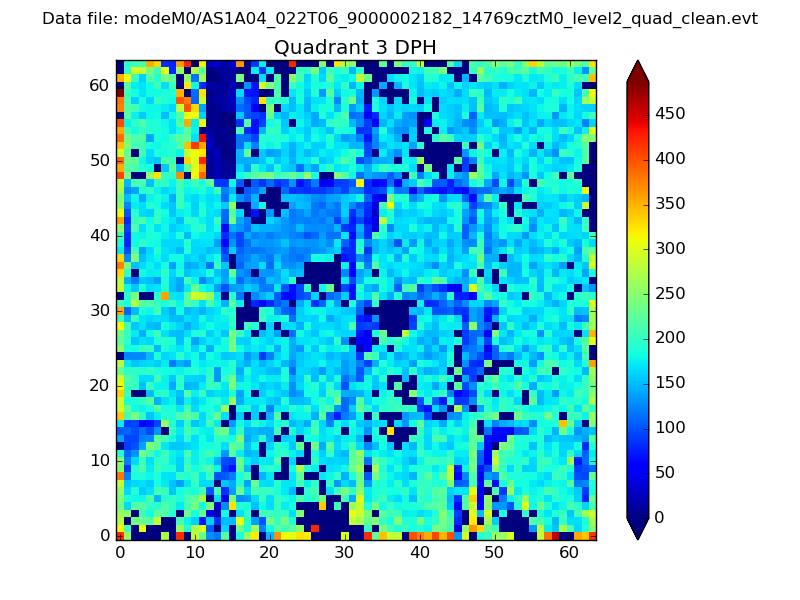 |
 |
Quadrant C |
| Plot type | Count rate plots | Images |
|---|---|---|
| Comparison with Poisson distribution Blue bars denote a histogram of data divided into 1 sec bins. Red curve is a Poisson curve with rate = median count rate of data. |
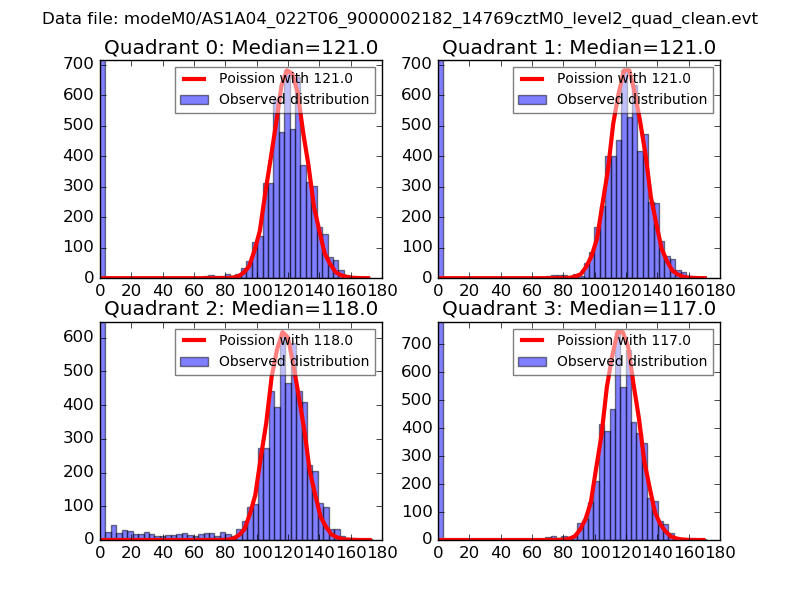 |
 |
| Quadrant-wise count rates Data is divided into 100 sec bins |
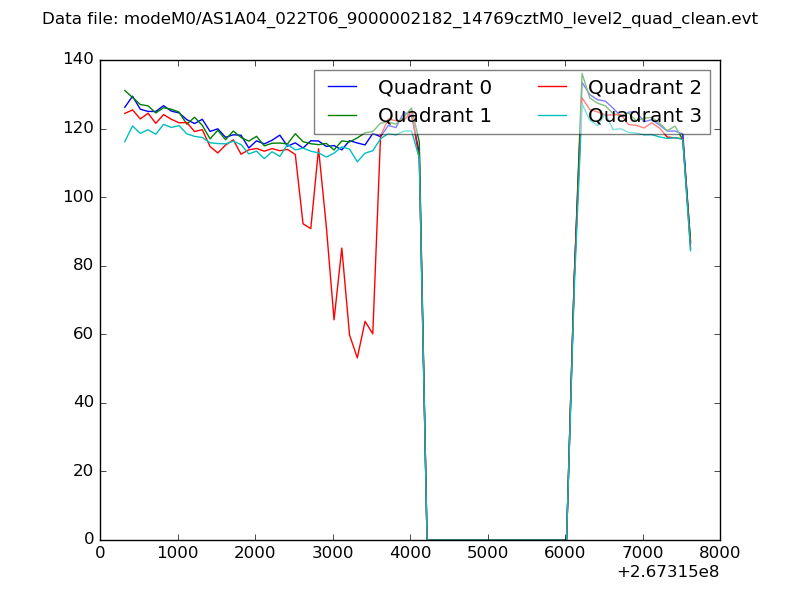 |
|
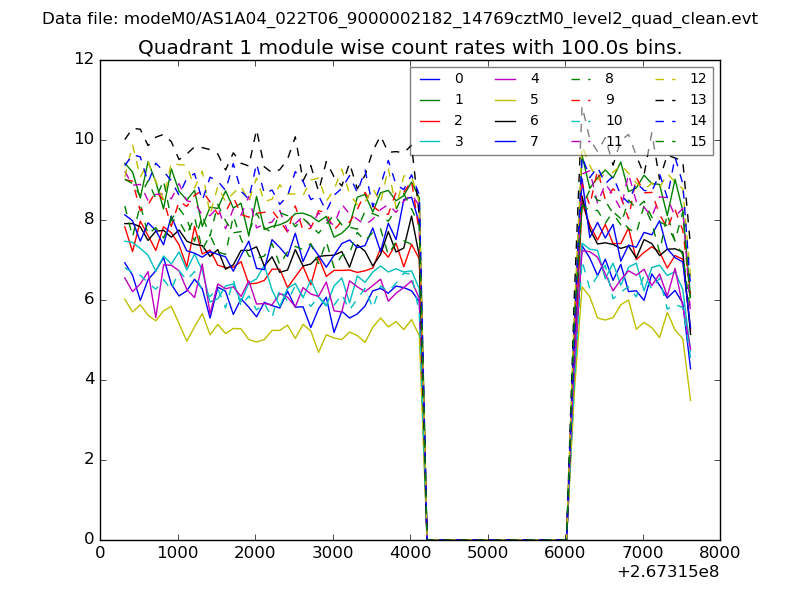
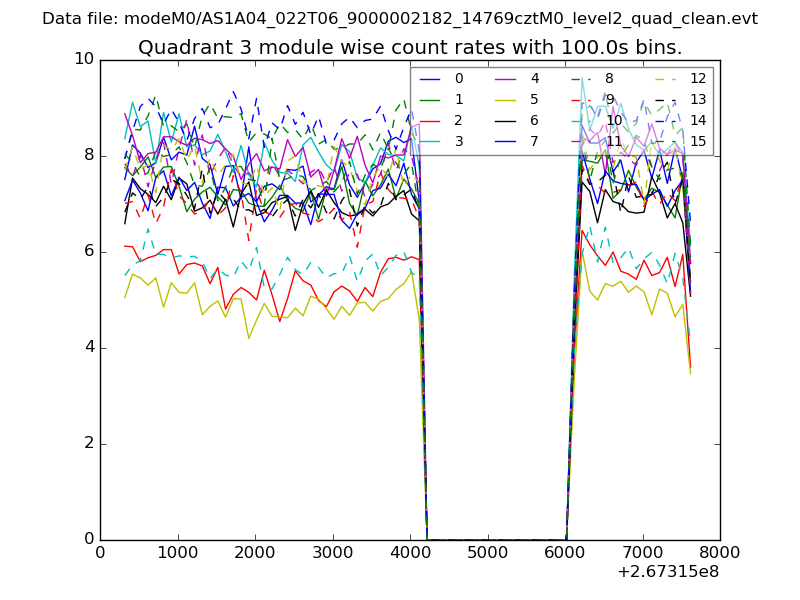
| Module-wise count rates for Quadrant A Data is divided into 100 sec bins |
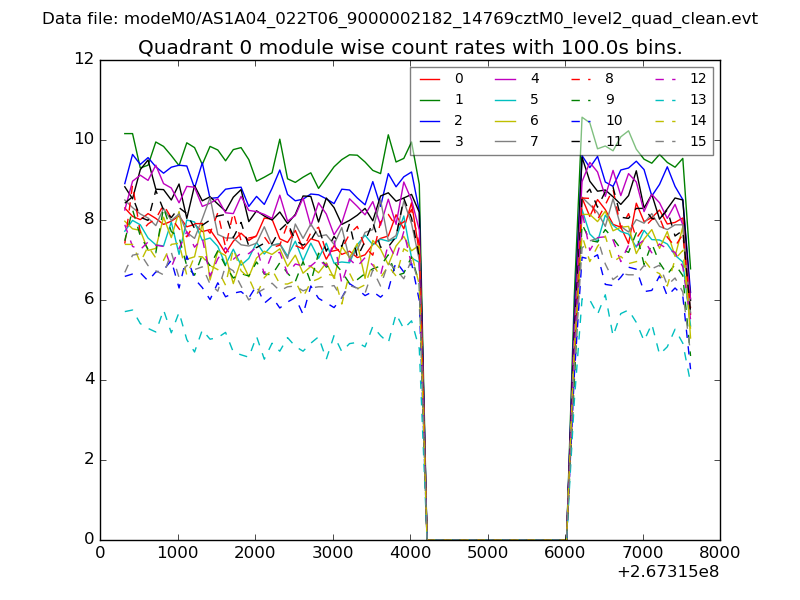 |
 |
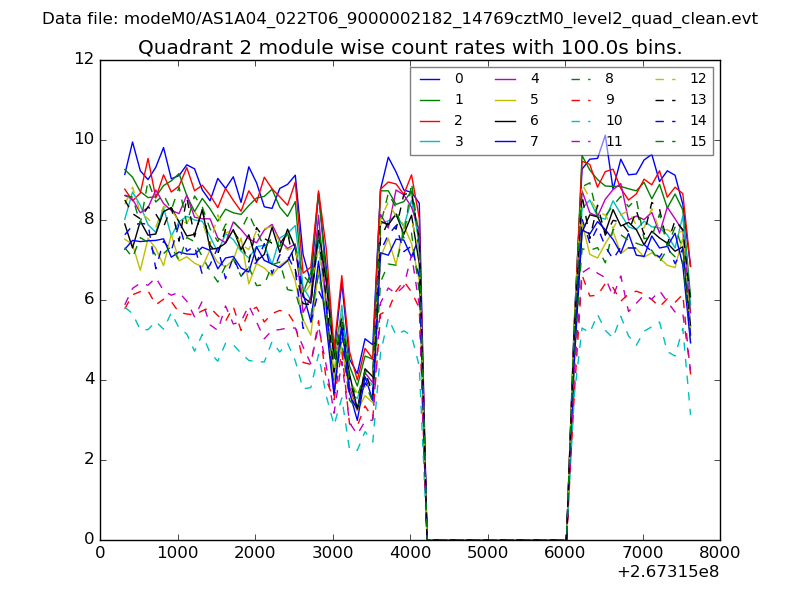
| Module-wise count rates for Quadrant B Data is divided into 100 sec bins |
 |
 |
| Module-wise count rates for Quadrant C Data is divided into 100 sec bins |
 |
 |
| Module-wise count rates for Quadrant D Data is divided into 100 sec bins |
 |
 |
| Parameter | Plot |
|---|---|
| CZT HV Monitor | 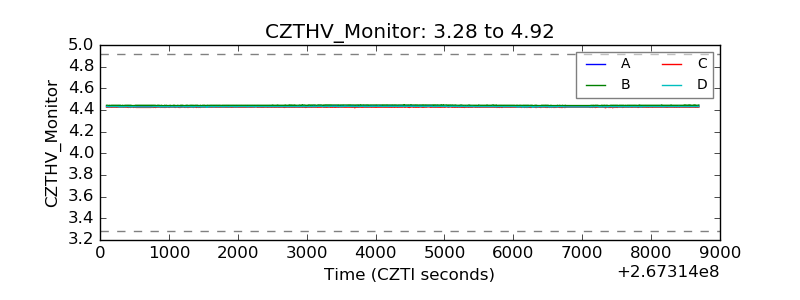 |
| D_VDD | 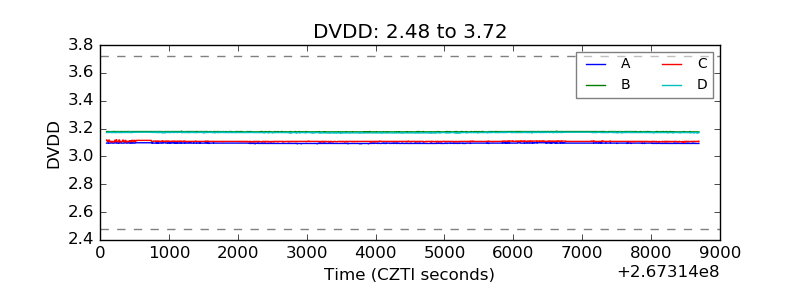 |
| Temperature 1 | 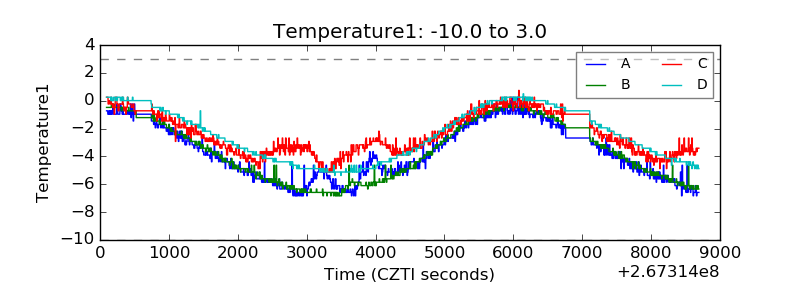 |
| Veto HV Monitor |  |
| Veto LLD |  |
| Alpha Counter |  |
| _CPM_Rate | 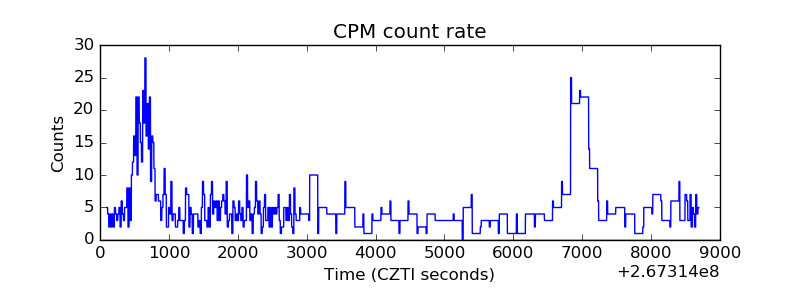 |
| CZT Counter | 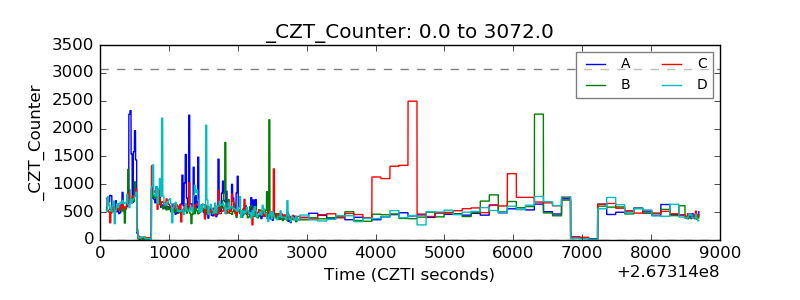 |
| +2.5 Volts monitor |  |
| +5 Volts monitor |  |
| _ROLL_ROT | 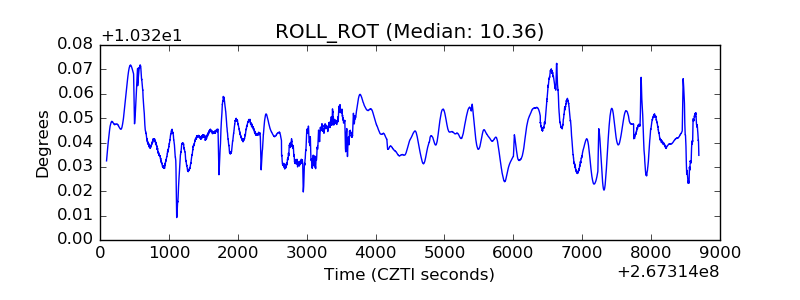 |
| _Roll_DEC | 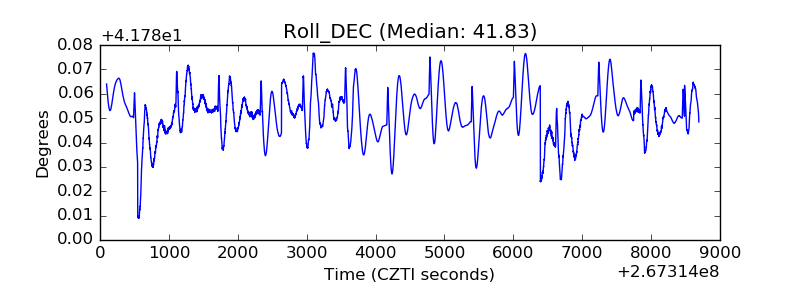 |
| _Roll_RA | 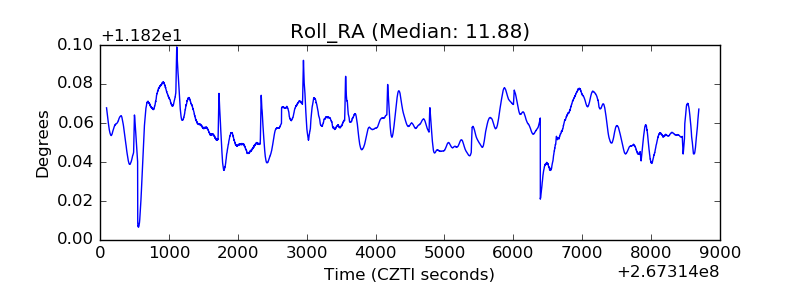 |
| Veto Counter | 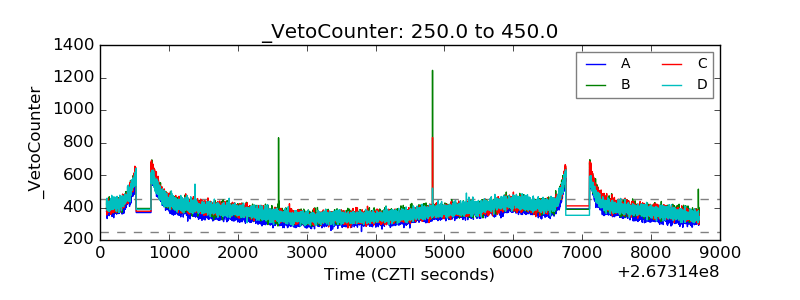 |