| Param | Original file | Final file |
|---|---|---|
| Filename | modeM0/AS1A04_022T06_9000002182_14772cztM0_level2.evt | modeM0/AS1A04_022T06_9000002182_14772cztM0_level2_quad_clean.evt |
| Size (bytes) | 1,335,098,880 | 238,993,920 |
| Size | 1.2 GB | 227.9 MB |
| Events in quadrant A | 9,458,078 | 1,500,459 |
| Events in quadrant B | 9,484,244 | 1,510,813 |
| Events in quadrant C | 10,985,587 | 1,465,225 |
| Events in quadrant D | 9,226,211 | 1,457,786 |
| Mode SS | |||
|---|---|---|---|
| Quadrant | BADHDUFLAG | Total packets | Discarded packets |
| A | 0 | 386 | 0 |
| B | 0 | 386 | 0 |
| C | 0 | 386 | 0 |
| D | 0 | 386 | 0 |
| Mode M0 | |||
|---|---|---|---|
| Quadrant | BADHDUFLAG | Total packets | Discarded packets |
| A | 0 | 40912 | 5 |
| B | 0 | 41015 | 4 |
| C | 0 | 45328 | 4 |
| D | 0 | 41197 | 4 |
| Mode M9 | |||
|---|---|---|---|
| Quadrant | BADHDUFLAG | Total packets | Discarded packets |
| A | 0 | 24 | 0 |
| B | 0 | 24 | 0 |
| C | 0 | 24 | 0 |
| D | 0 | 24 | 0 |
| Quadrant | Total seconds | Saturated seconds | Saturation percentage |
|---|---|---|---|
| A | 18931 | 86 | 0.454281% |
| B | 18931 | 207 | 1.093445% |
| C | 18931 | 615 | 3.248640% |
| D | 18931 | 105 | 0.554646% |
Noise dominated data is calculated using 1-second bins in cleaned event files. If a bin has >2000 counts, and if more than 50% of those come from <1% of pixels, then it is considered to be noise-dominated and hence unusable.
| Quadrant | # 1 sec bins | Bins with >0 counts | Bins with >2000 counts | High rate bins dominated by noise | Noise dominated (total time) | Noise dominated (detector-on time) | Marked lightcurve |
|---|---|---|---|---|---|---|---|
| A | 21312 | 18936 | 4 | 4 | 0.02% | 0.02% | 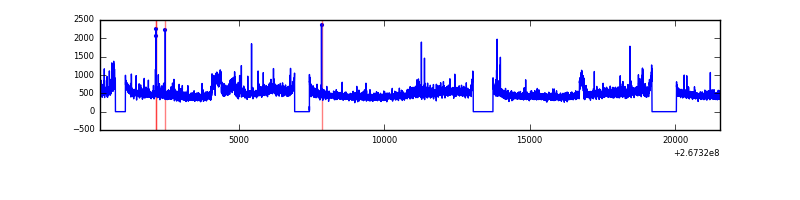 |
| B | 21312 | 18936 | 39 | 39 | 0.18% | 0.21% | 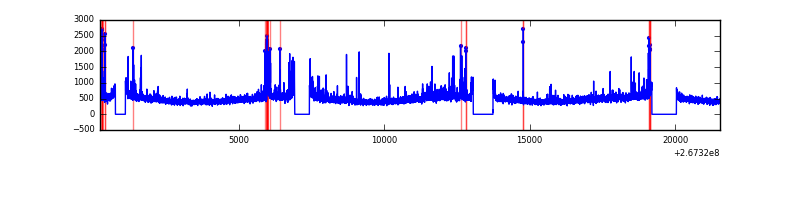 |
| C | 21312 | 18936 | 390 | 390 | 1.83% | 2.06% | 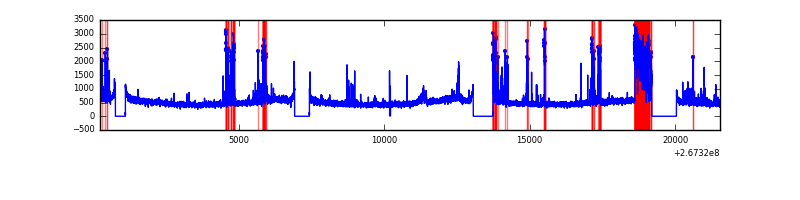 |
| D | 21312 | 18936 | 61 | 61 | 0.29% | 0.32% | 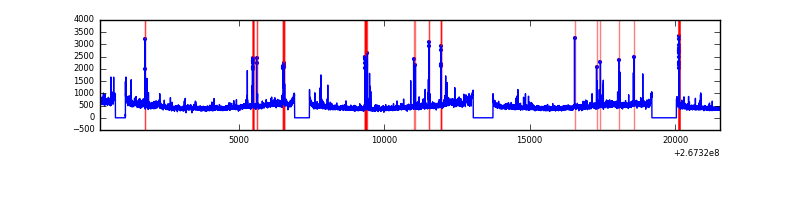 |
Top three noisy pixels from each quadrant. If the there are fewer than three noisy pixels in the level2.evt file, extra rows are filled as -1
| Pixel properties | Quadrant properties | ||||||
|---|---|---|---|---|---|---|---|
| Quadrant | DetID | PixID | Counts | Sigma | Mean | Median | Sigma |
| A | 12 | 189 | 647880 | 1427.02 | 2222 | 2174 | 452.5 |
| A | 0 | 23 | 140709 | 306.16 | 2222 | 2174 | 452.5 |
| A | 14 | 237 | 70919 | 151.93 | 2222 | 2174 | 452.5 |
| B | 10 | 246 | 128017 | 301.6 | 2220 | 2165 | 417.3 |
| B | 0 | 219 | 108147 | 253.98 | 2220 | 2165 | 417.3 |
| B | 0 | 229 | 97672 | 228.88 | 2220 | 2165 | 417.3 |
| C | 4 | 254 | 1601197 | 3282.84 | 2115 | 2123 | 487.1 |
| C | 3 | 233 | 942012 | 1929.56 | 2115 | 2123 | 487.1 |
| C | 0 | 207 | 131173 | 264.94 | 2115 | 2123 | 487.1 |
| D | 8 | 195 | 615872 | 1124.18 | 2139 | 2079 | 546.0 |
| D | 15 | 0 | 198319 | 359.42 | 2139 | 2079 | 546.0 |
| D | 2 | 234 | 74390 | 132.44 | 2139 | 2079 | 546.0 |
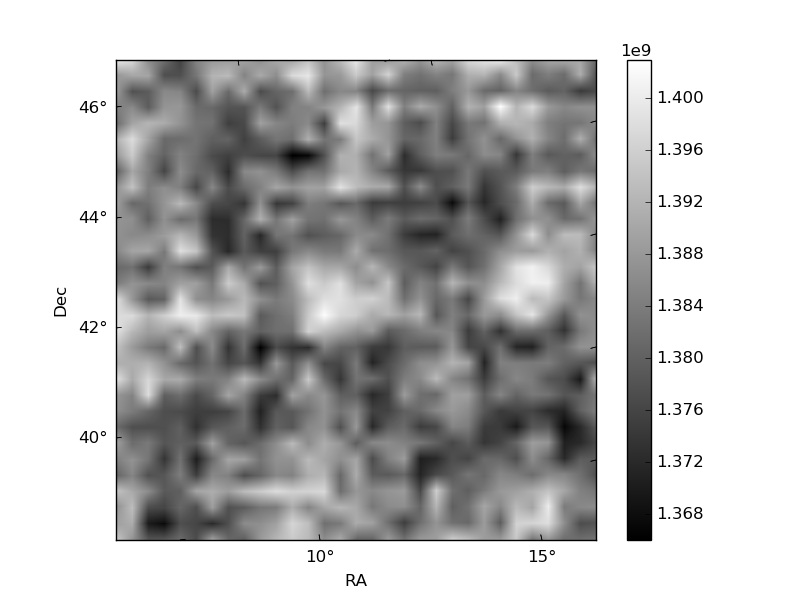
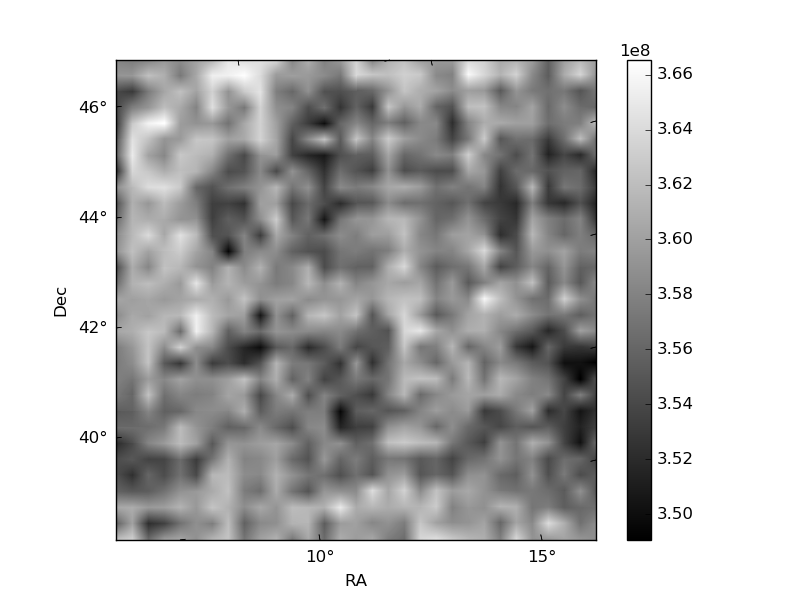
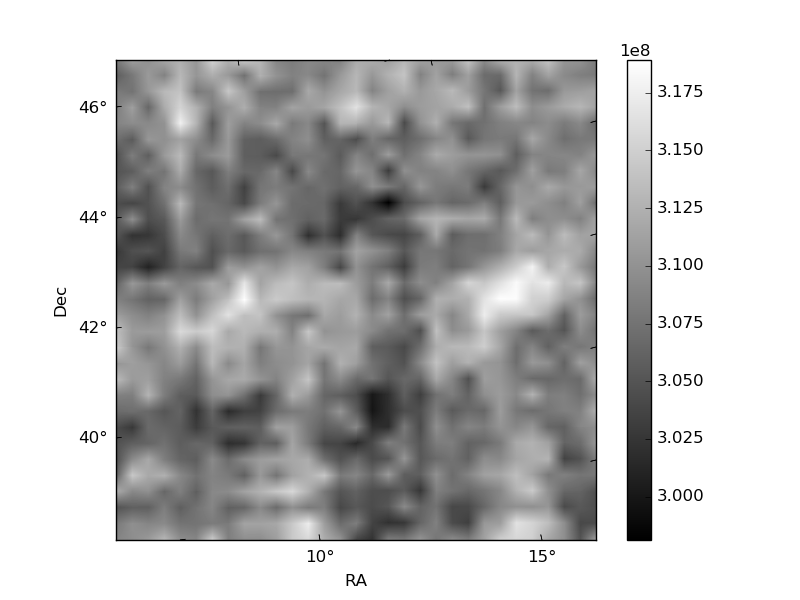
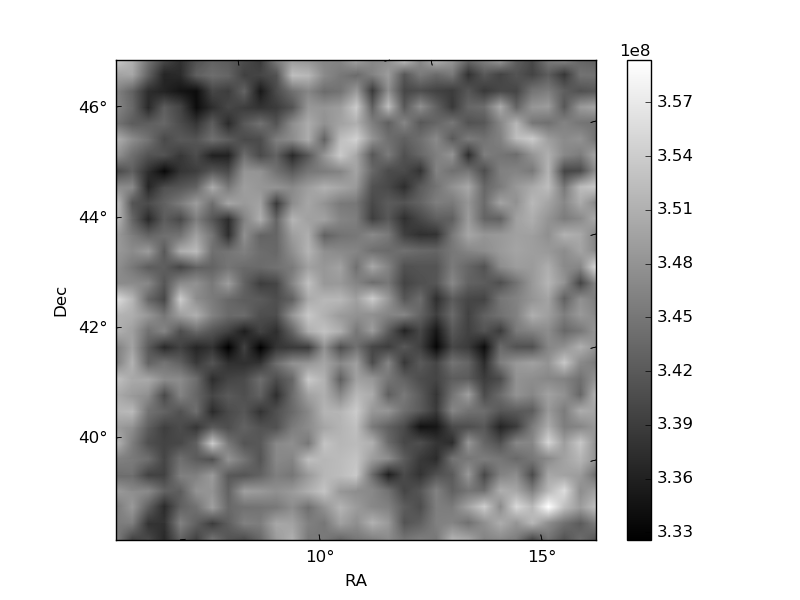
Histogram calculated using DETX and DETY for each event in the final _common_clean file
| Quadrant A | 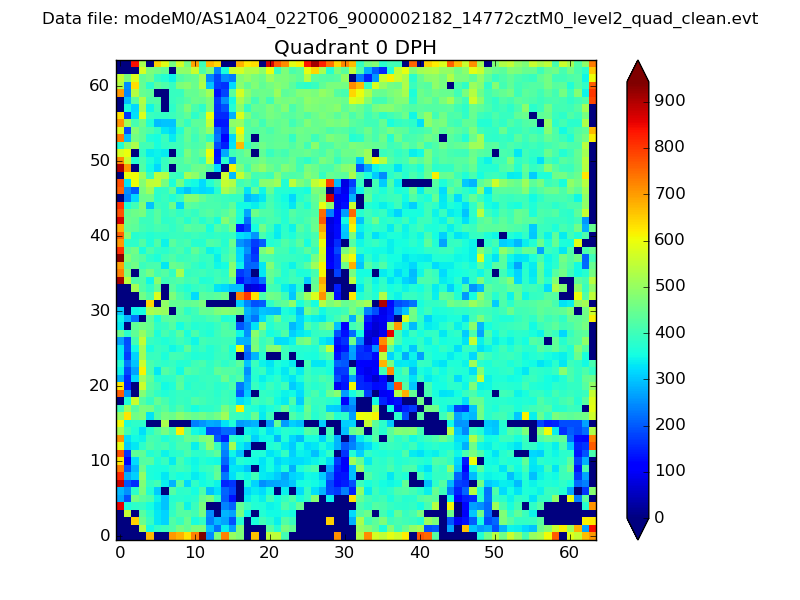 |
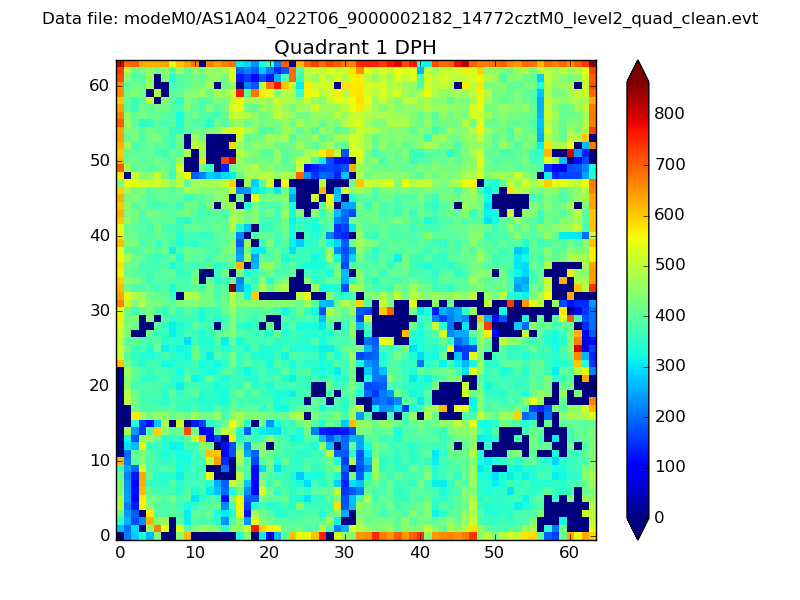 |
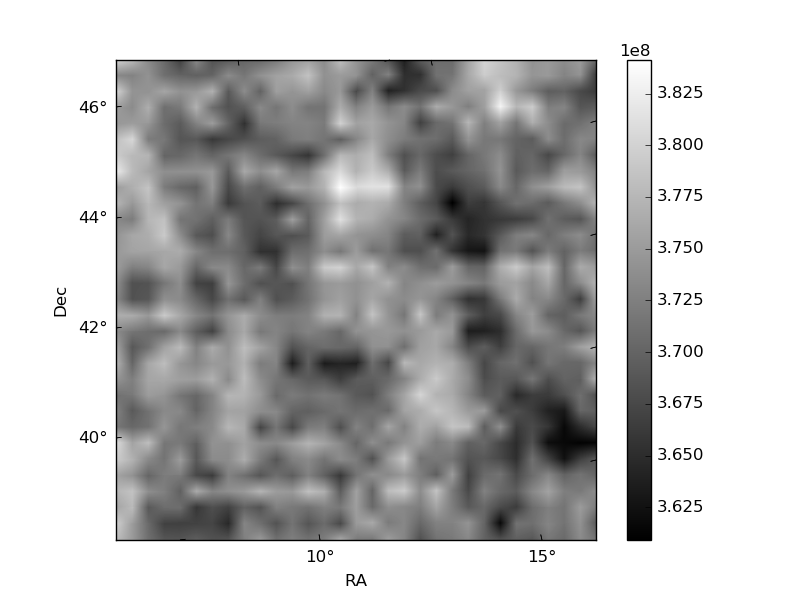
Quadrant B |
|---|---|---|---|
| Quadrant D | 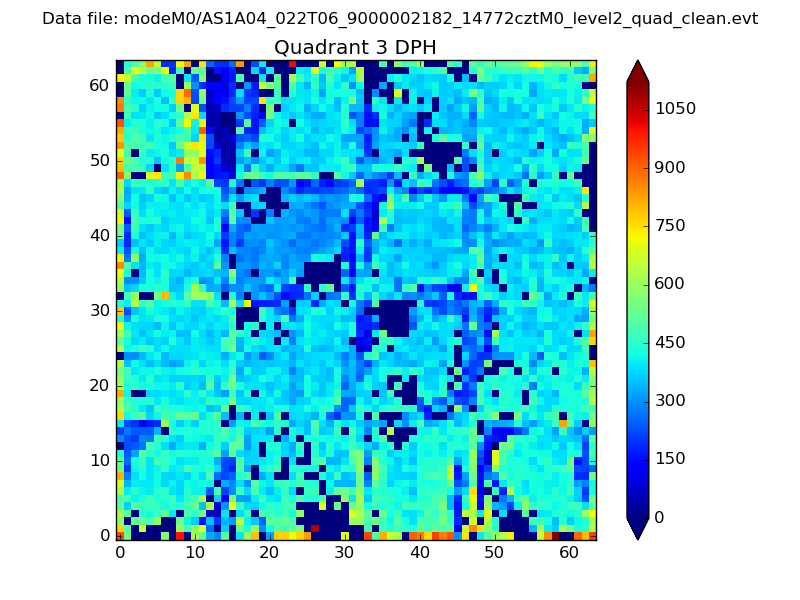 |
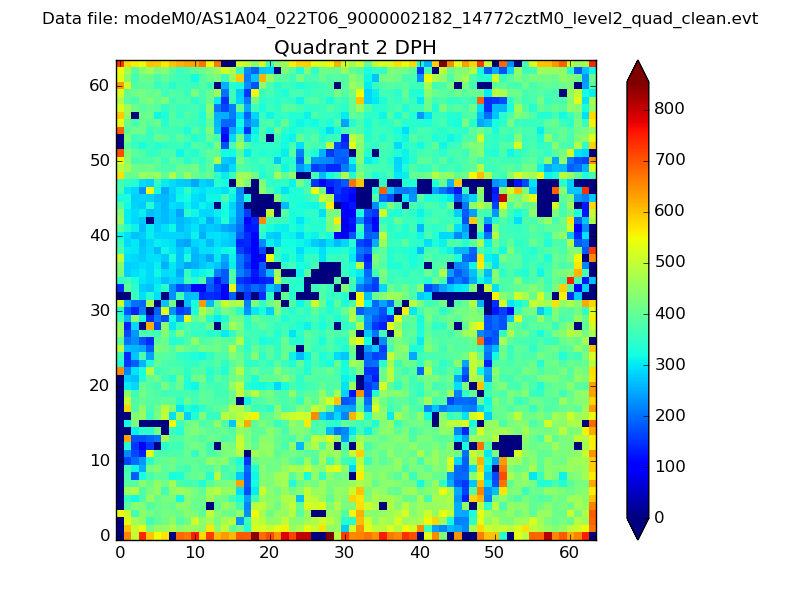 |
Quadrant C |
| Plot type | Count rate plots | Images |
|---|---|---|
| Comparison with Poisson distribution Blue bars denote a histogram of data divided into 1 sec bins. Red curve is a Poisson curve with rate = median count rate of data. |
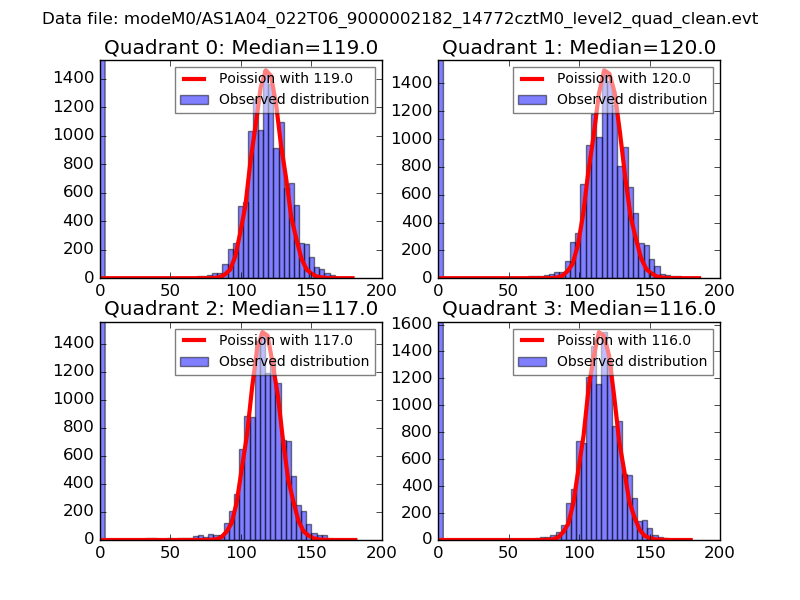 |
 |
| Quadrant-wise count rates Data is divided into 100 sec bins |
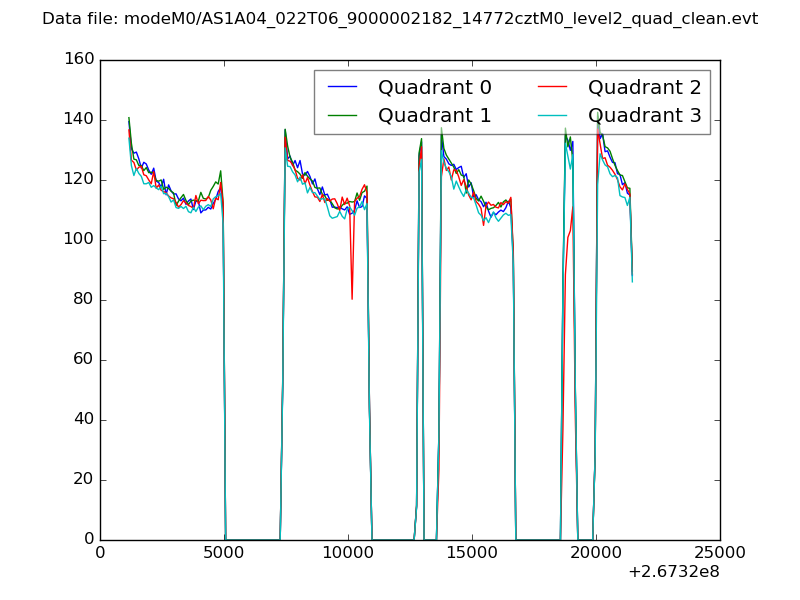 |
|
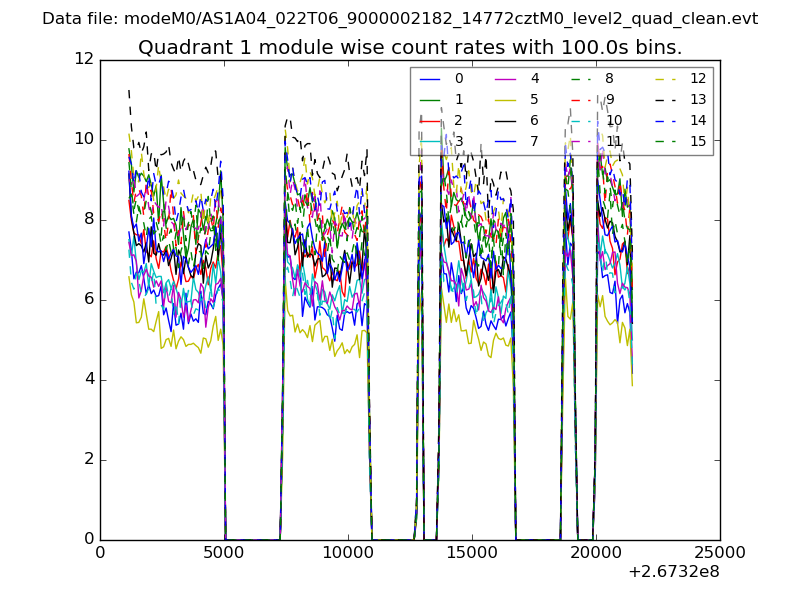
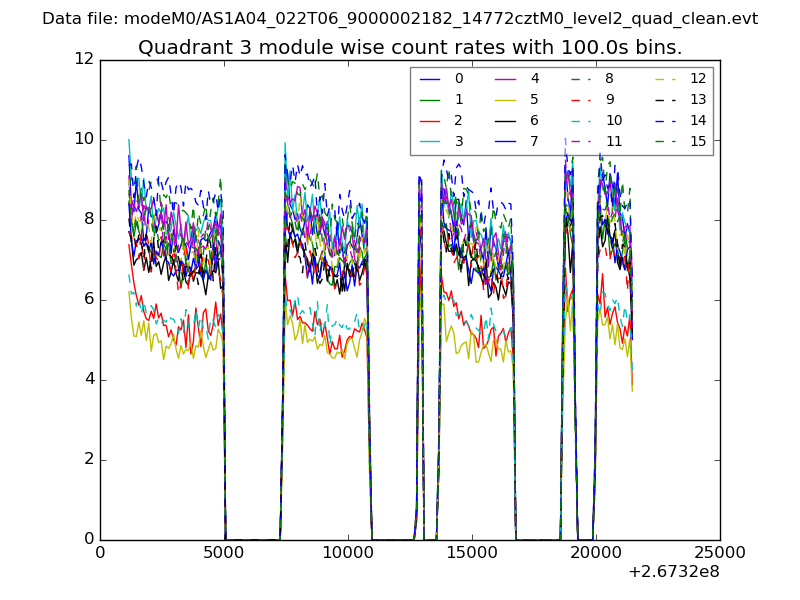
| Module-wise count rates for Quadrant A Data is divided into 100 sec bins |
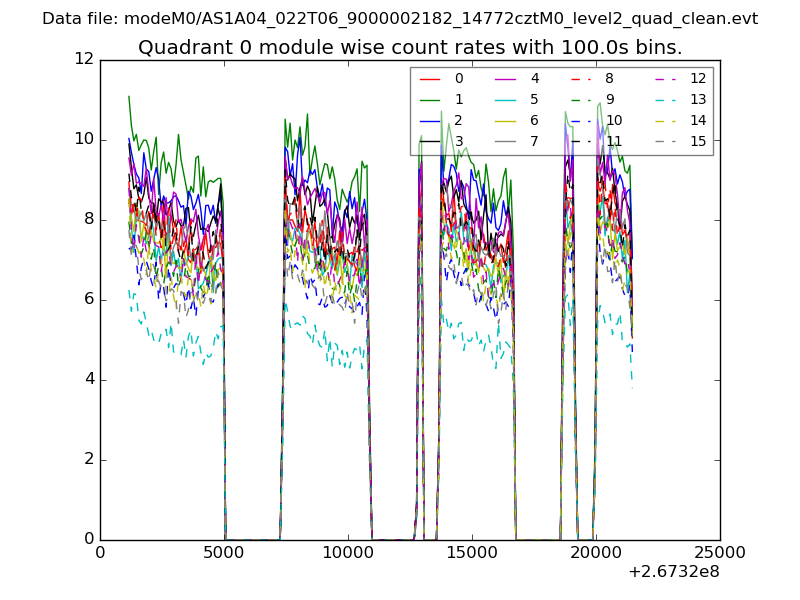 |
 |
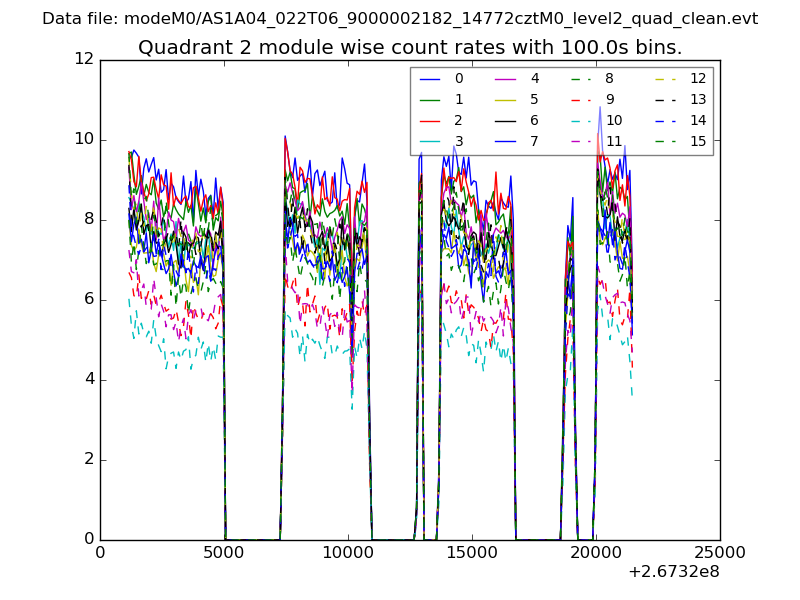
| Module-wise count rates for Quadrant B Data is divided into 100 sec bins |
 |
 |
| Module-wise count rates for Quadrant C Data is divided into 100 sec bins |
 |
 |
| Module-wise count rates for Quadrant D Data is divided into 100 sec bins |
 |
 |
| Parameter | Plot |
|---|---|
| CZT HV Monitor | 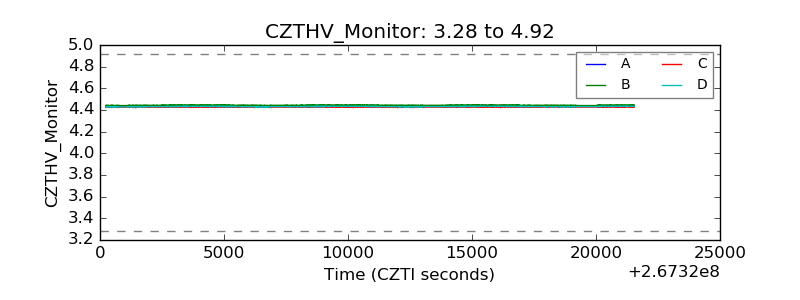 |
| D_VDD | 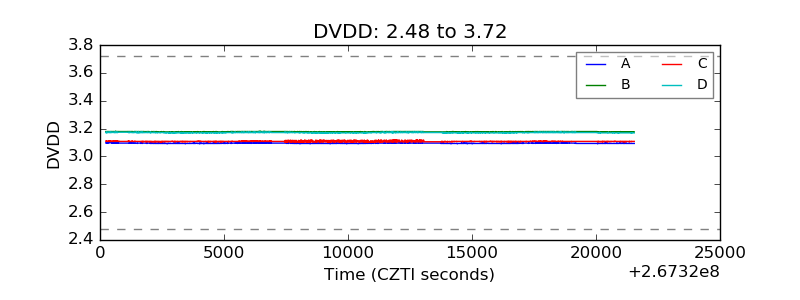 |
| Temperature 1 | 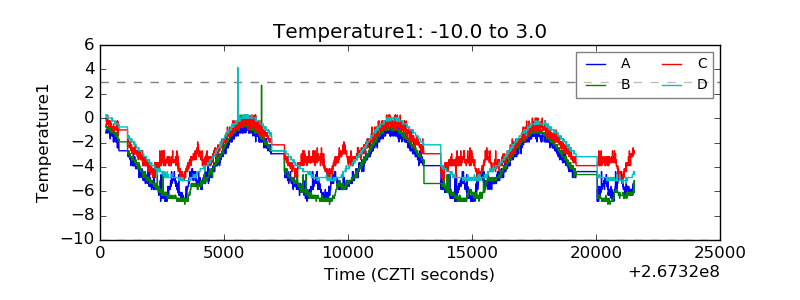 |
| Veto HV Monitor | 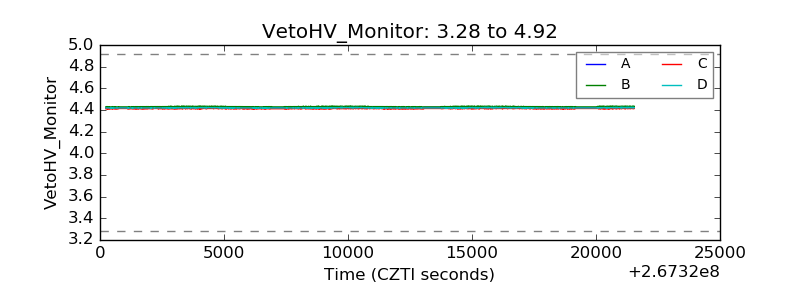 |
| Veto LLD | 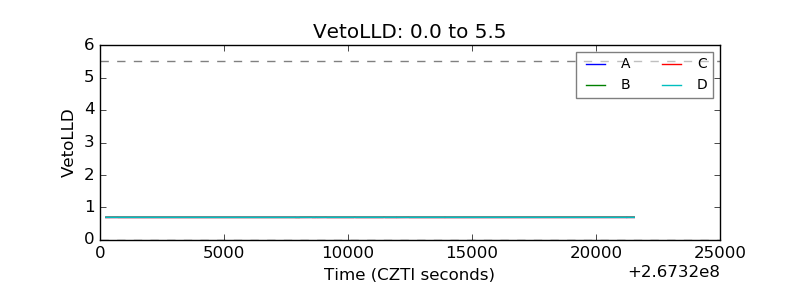 |
| Alpha Counter | 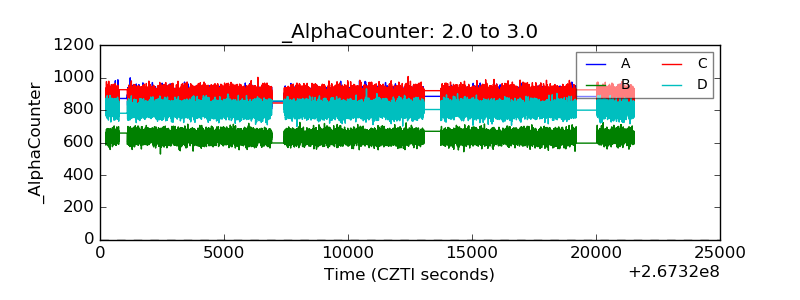 |
| _CPM_Rate | 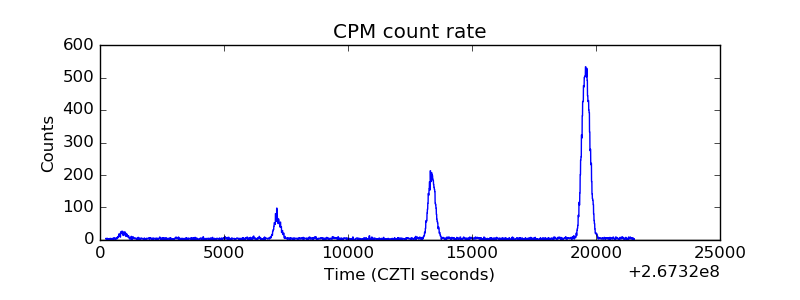 |
| CZT Counter | 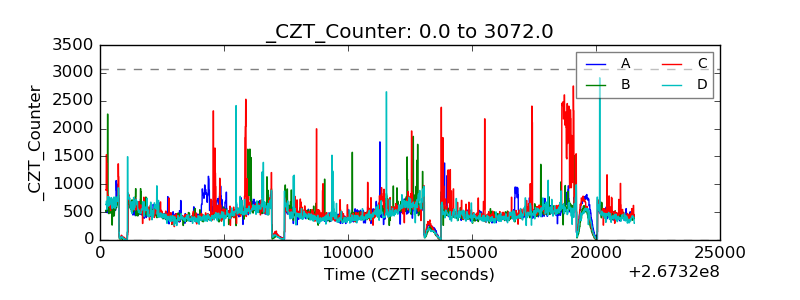 |
| +2.5 Volts monitor | 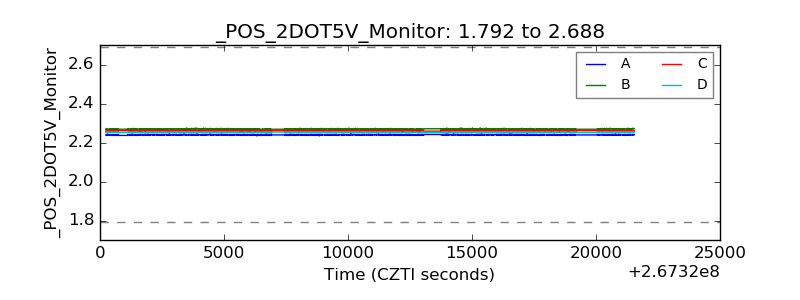 |
| +5 Volts monitor | 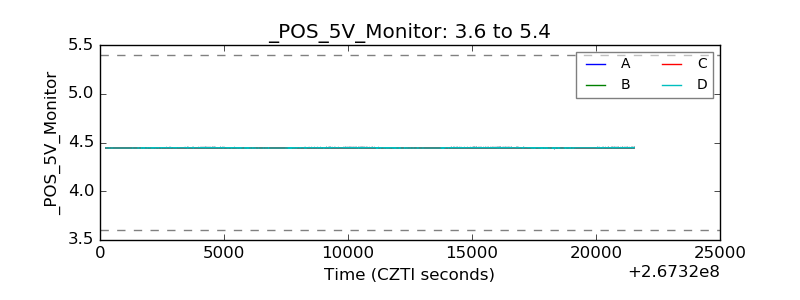 |
| _ROLL_ROT | 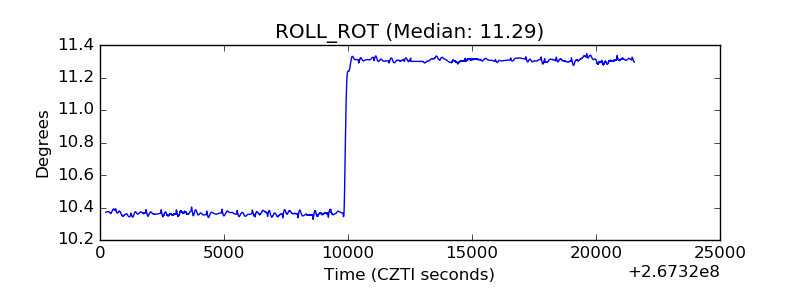 |
| _Roll_DEC |  |
| _Roll_RA | 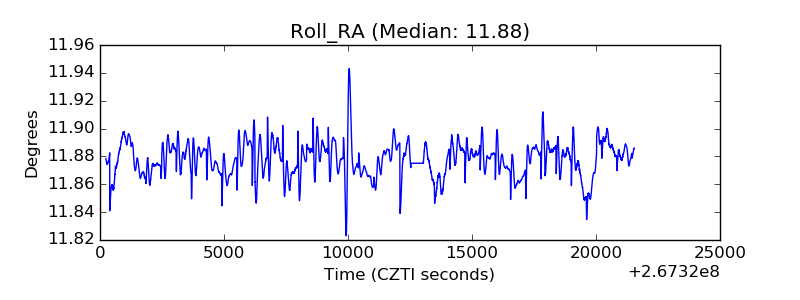 |
| Veto Counter | 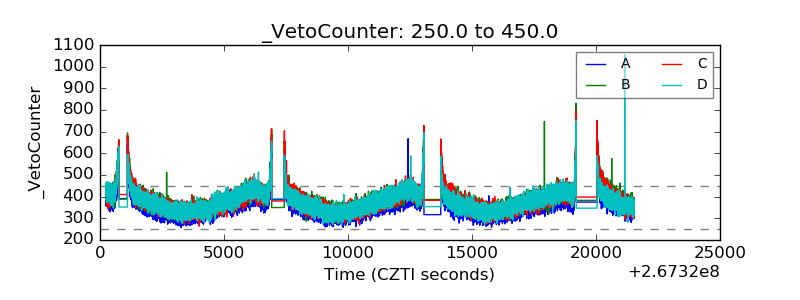 |